


|
시장보고서
상품코드
1766326
산업용 에어레이터 시장(2025-2034년) : 기회, 성장 촉진요인, 산업 동향 분석, 예측Industrial Aerators Market Opportunity, Growth Drivers, Industry Trend Analysis, and Forecast 2025 - 2034 |
||||||
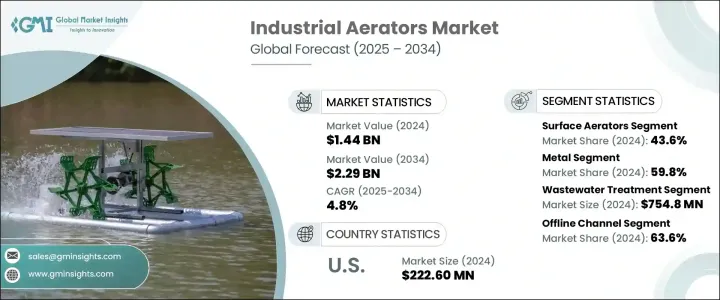
세계의 산업용 에어레이터 시장은 2024년에는 14억 4,000만 달러로 평가되었고, CAGR 4.8%로 성장하여 2034년에는 22억 9,000만 달러에 이를 것으로 예측됩니다.
이러한 성장은 산업화의 진전, 환경 규제의 강화, 지속 가능하고 효율적인 수질 관리 관행으로의 광범위한 전환의 영향을 강하게 받고 있습니다. 에어레이션은 폐수 처리 전략에 필수적인 요소로 자리잡고 있습니다.

첨단 에어레이터에 대한 수요는 특히 산업 시설이 환경에 미치는 영향을 줄이려고 하는 가운데, 효과적인 산소 이동과 배출 기준 준수를 확보하고자 하는 명확한 필요에 의해 추진되고 있습니다. 또한 지능형 시스템의 통합을 위한 움직임이 활발해지고 있습니다. 이러한 발전은 보다 광범위한 인더스트리 4.0 동향과 일치하며 기존 장비에 스마트 기능을 통합함으로써 에어레이터 시스템 시장을 재구성합니다.
| 시장 범위 | |
|---|---|
| 시작 연도 | 2024년 |
| 예측 연도 | 2025-2034년 |
| 시작 금액 | 14억 4,000만 달러 |
| 예측 금액 | 22억 9,000만 달러 |
| CAGR | 4.8% |
각 분야의 기업은 장기 내구성과 낮은 유지보수 요구사항을 제공하는 내식성 설계 및 구성 요소의 가치를 인식하고 있습니다. 뿐만 아니라 ESG 벤치마크에 대한 주목이 높아짐에 따라 경제적으로나 생태학적으로 실행 가능한 수질 관리 솔루션에 대한 요구가 커지고 있습니다.
2024년에는 표면 에어레이터가 세계 매출의 43.6%를 차지하였고 2034년까지 5%의 연평균 복합 성장률(CAGR)을 보일 것으로 예측되고 있습니다. 표면 에어레이터는 안정적인 혼합과 에어레이션을 필요로 하는 환경에서 사용되는 경우가 많습니다. 표면 에어레이터의 설계는 유지보수성이나 비용 효율성이 중요시되는 컴팩트한 시스템이나 분산형 시스템 용도에 특히 적합합니다.
재료의 관점에서는 금속 기반 에어레이터가 2024년 59.8%의 수익 점유율을 차지하며 시장을 독점하였고 예측 기간 동안 CAGR 5%로 성장할 것으로 보입니다. 스테인레스 스틸 및 알루미늄과 같은 재료는 가혹한 조건에서 작동하는 데 필요한 탄력성을 제공하며 고강도 사용에 적합한 옵션입니다.
용도별로는 폐수 처리 분야가 2024년 7억 5,480만 달러로 시장을 선도하였고 2034년까지 연평균 복합 성장률(CAGR) 4.9%로 확대될 것으로 예측되고 있습니다. 에어레이션은 호기성 균의 활동을 유지하는 데 도움이 되며 최신 생물학적 처리 과정에 필수적입니다. 산업계와 지자체도 보다 엄격한 배수 가이드라인을 충족하고 시설 전체의 처리 성과를 향상시키기 위해 에어레이터에 대한 투자를 지속하고 있습니다.
판매 채널에 관해서는 오프라인 부문이 2024년에 시장 점유율의 63.6%를 확보했으며, 지배적인 판매 형태로 부상했습니다. 설치, 서비스 계약은 주로 확립된 벤더와의 관계에 의존하는 경우가 많습니다. 또, 부품이나 서포트 서비스의 시기 적절한 납품 능력을 확보하는 데는 현지의 대리점 네트워크가 중요한 역할을 담당하고 있어 대규모 주문이나 맞춤형 주문에 대한 오프라인 조달의 중요성을 한층 더 높이고 있습니다.
지역별로는 미국이 세계의 산업용 에어레이터 시장에서 최고 자리를 차지하고 있으며 2024년의 매출액은 2억 2,260만 달러에 달했습니다. 정부의 규제에 의해 시설은 효율적인 에어레이션 기술의 채용을 요구받고 있습니다. 또한 노후화된 처리 시설을 대상으로 한 현대화가 진행되고 있어, 미국에서는 업그레이드된 지능형 에어레이션 시스템에 대한 안정된 수요가 탄생하고 있습니다.
시장의 주요 기업에는 혁신적이고 에너지 의식이 높은 에어레이션 솔루션을 제공하는 데 주력하는 기업이 포함되어 있습니다. 산업계 최종 사용자가 성능 목표와 환경 목표를 모두 달성하려고 하므로 스마트하고 지속 가능한 기술을 제공하는 공급업체는 진화하는 시장 상황에서 더 큰 견인력을 획득할 가능성이 높습니다.
목차
제1장 조사 방법과 범위
제2장 주요 요약
제3장 업계 인사이트
- 생태계 분석
- 공급자의 상황
- 이익률
- 각 단계에서의 부가가치
- 밸류체인에 영향을 주는 요인
- 업계에 미치는 영향요인
- 성장 촉진요인
- 엄격한 환경 규제와 폐수 처리
- 신흥 경제국에서의 산업화와 도시화의 진전
- 기술의 진보와 스마트 시스템의 통합
- 업계의 잠재적 위험 및 과제
- 낡은 인프라의 개수에 따르는 운영상의 비효율성
- 높은 초기 자본과 유지비
- 기회
- 성장 촉진요인
- 성장 가능성 분석
- 장래 시장 동향
- 기술과 혁신의 상황
- 현재의 기술 동향
- 신흥 기술
- 가격 동향
- 지역별
- 제품 유형별
- 규제 프레임워크
- 표준 및 컴플라이언스 요건
- 지역 규제 프레임워크
- 인증 기준
- 무역 통계(HS코드 84145930)
- 주요 수입국
- 주요 수출국
- Porter's Five Forces 분석
- PESTEL 분석
제4장 경쟁 구도
- 소개
- 기업의 시장 점유율 분석
- 지역별
- 북미
- 유럽
- 아시아태평양
- 지역별
- 기업 매트릭스 분석
- 주요 시장 기업의 경쟁 분석
- 경쟁 포지셔닝 매트릭스
- 주요 발전
- 합병과 인수
- 파트너십 및 협업
- 신제품 발매
- 확장 계획
제5장 시장 추계 및 예측 : 제품별(2021-2034년)
- 표면 에어레이터
- 수중 에어레이터
- 기계식 에어레이터
- 플로팅 에어레이터
제6장 시장 추계 및 예측 : 마력별(2021-2034년)
- 저마력(0.5-5마력)
- 중마력(5-20마력)
- 고마력(20마력 이상)
제7장 시장 추계 및 예측 : 재료별(2021-2034년)
- 금속
- 플라스틱
제8장 시장추계 및 예측 : 자동화별(2021-2034년)
- 자동화
- 비자동화
제9장 시장 추계 및 예측 : 용도별(2021-2034년)
- 주요 동향
- 폐수 처리
- 양식업
- 수처리
- 식음료 업계
- 광업
- 펄프 및 제지 제조
- 석유 및 가스
- 기타
제10장 시장 추계 및 예측 : 유통 채널별(2021-2034년)
- 주요 동향
- 온라인
- 오프라인
제11장 시장 추계 및 예측 : 지역별(2021-2034년)
- 주요 동향
- 북미
- 미국
- 캐나다
- 유럽
- 영국
- 독일
- 프랑스
- 이탈리아
- 스페인
- 러시아
- 아시아태평양
- 중국
- 인도
- 일본
- 한국
- 호주
- 라틴아메리카
- 브라질
- 멕시코
- 아르헨티나
- 중동 및 아프리카
- 아랍에미리트(UAE)
- 남아프리카
- 사우디아라비아
제12장 기업 프로파일
- Brother Industries Ltd.
- Canon Inc
- Domino Printing Sciences
- Durst Phototechnik AG
- Epson Corporation
- Heidelberger Druckmaschinen AG
- HP Inc
- Kornit Digital Ltd.
- Konica Minolta, Inc.
- Mutoh Holdings Co., Ltd.
- Ricoh Company Ltd.
- Seiko Holdings Corporation
- Xaar plc
- Xerox Holdings Corporation
- Zebra Technologies Corporation
The Global Industrial Aerators Market was valued at USD 1.44 billion in 2024 and is estimated to grow at a CAGR of 4.8% to reach USD 2.29 billion by 2034. This growth is strongly influenced by rising industrialization, increased environmental regulations, and a broader shift toward sustainable and efficient water management practices. As industries place greater emphasis on process optimization and resource recovery, aeration technologies are becoming integral to wastewater treatment strategies. Organizations are prioritizing energy-efficient and high-performance solutions that support their operational goals while meeting evolving regulatory frameworks.
The demand for advanced aerators is being driven by a clear need to ensure effective oxygen transfer and compliance with discharge standards, especially as industrial facilities look to reduce their environmental impact. There's a growing push toward integrating intelligent systems capable of real-time monitoring, predictive maintenance, and automation. These advancements align with broader Industry 4.0 trends and are reshaping the market for aeration systems by embedding smart capabilities into traditional equipment.
| Market Scope | |
|---|---|
| Start Year | 2024 |
| Forecast Year | 2025-2034 |
| Start Value | $1.44 Billion |
| Forecast Value | $2.29 Billion |
| CAGR | 4.8% |
Businesses across sectors are also recognizing the value of corrosion-resistant designs and components that offer extended durability and low maintenance requirements. As corporate sustainability commitments become more central to industrial strategies, the adoption of next-generation aerators designed for environmental efficiency and long-term cost savings is expected to increase. Additionally, growing attention to ESG benchmarks has amplified the need for water management solutions that are both economically and ecologically viable.
Within the product landscape, surface aerators held the leading position in 2024, capturing 43.6% of global revenue and projected to grow at a 5% CAGR through 2034. Their widespread adoption is linked to operational simplicity, affordability, and consistent performance in various treatment settings. These systems are often used in environments requiring reliable mixing and aeration without complex infrastructure. Their design is particularly well-suited for applications in compact or decentralized systems, where maintenance access and cost-efficiency are important considerations. The growing interest in adaptable and efficient aeration setups has contributed to the rising demand for surface-type equipment across diverse regions.
From a materials standpoint, metal-based aerators dominated the market in 2024, accounting for a 59.8% revenue share, and are set to grow at a CAGR of 5% over the forecast period. These units are favored in industrial applications that demand durability and chemical resistance. Materials like stainless steel and aluminum provide the resilience necessary to operate in harsh conditions, making them the preferred choice for high-intensity use. Their strength and longevity result in fewer replacements and minimal downtime, offering greater value over the long term despite higher upfront costs.
By application, the wastewater treatment segment led the market with USD 754.8 million in 2024 and is projected to expand at a CAGR of 4.9% through 2034. The need for efficient treatment systems is rising in tandem with global concerns over water contamination and industrial effluents. Aerators are essential to modern biological treatment processes, helping to sustain aerobic microbial activity that breaks down organic matter. Industrial and municipal operators alike continue to invest in aeration equipment to meet stricter effluent guidelines and improve treatment outcomes across facilities.
When it comes to distribution channels, the offline segment emerged as the dominant mode of sales in 2024, securing 63.6% of the market share. Purchasing decisions for aeration systems often involve detailed technical evaluations and in-person consultations, which makes offline channels preferable. Industrial buyers frequently rely on established vendor relationships, especially for product demonstrations, installations, and service contracts. Local distributor networks also play a crucial role in ensuring the timely delivery of parts and support services, further reinforcing the significance of offline procurement for large-scale and customized orders.
Geographically, the United States emerged as the top-performing country in the global industrial aerators market, generating USD 222.60 million in revenue in 2024. The country accounted for 72% of the North American market, underscoring its strong position in industrial water treatment infrastructure. Government regulations mandating sustainable wastewater management practices have compelled facilities to adopt efficient aeration technologies. Moreover, ongoing modernization efforts targeting outdated treatment plants continue to create a steady demand for upgraded and intelligent aeration systems in the country.
Leading players in the market include companies focused on delivering innovative and energy-conscious aeration solutions. Competitive differentiation is increasingly shaped by features such as automation readiness, digital integration, and environmental performance. As industrial end users seek to meet both performance targets and environmental goals, suppliers offering smart, sustainable technologies are likely to gain greater traction in this evolving market landscape.
Table of Contents
Chapter 1 Methodology & Scope
- 1.1 Market scope and definition
- 1.2 Research design
- 1.2.1 Research approach
- 1.2.2 Data collections methods
- 1.3 Data mining sources
- 1.3.1 Global
- 1.3.2 Regional/country
- 1.4 Base estimates and calculations
- 1.4.1 Base year calculation
- 1.4.2 Key trends for market estimation
- 1.5 Primary research and validation
- 1.5.1 Primary sources
- 1.6 Forecast model.
- 1.7 Research assumptions and limitations.
Chapter 2 Executive Summary
- 2.1 Industry 360° synopsis
- 2.2 Key market trends
- 2.2.1 Regional
- 2.2.2 Product Type
- 2.2.3 Horsepower
- 2.2.4 Material
- 2.2.5 Automation
- 2.2.6 Application
- 2.2.7 Distribution channel
- 2.3 CXO perspectives: strategic imperatives
- 2.3.1 Key decision points for industry executives
- 2.3.2 Critical success factors for market players
- 2.4 Future outlook and strategic recommendations
Chapter 3 Industry Insights
- 3.1 Industry ecosystem analysis
- 3.1.1 Supplier landscape
- 3.1.2 Profit Margin
- 3.1.3 Value addition at each stage
- 3.1.4 Factors affecting the value chain
- 3.2 Industry impact forces
- 3.2.1 Growth drivers
- 3.2.1.1 Stringent environmental regulations & wastewater treatment
- 3.2.1.2 Rising industrialization & urbanization in emerging economies
- 3.2.1.3 Technological advancements & integration of smart systems
- 3.2.2 Industry pitfalls & challenges
- 3.2.2.1 Operational inefficiencies in retrofitting older infrastructure
- 3.2.2.2 High initial capital & maintenance cost
- 3.2.3 Opportunities
- 3.2.1 Growth drivers
- 3.3 Growth potential analysis
- 3.4 Future market trends
- 3.5 Technology and innovation landscape
- 3.5.1 Current technological trends
- 3.5.2 Emerging technologies
- 3.6 Price trends
- 3.6.1 By region
- 3.6.2 By product Type
- 3.7 Regulatory framework
- 3.7.1 Standards and compliance requirements
- 3.7.2 Regional regulatory frameworks
- 3.7.3 Certification standards
- 3.8 Trade statistics (HS code 84145930)
- 3.8.1 Major importing countries
- 3.8.2 Major exporting countries
- 3.9 Porter's analysis
- 3.10 PESTEL analysis
Chapter 4 Competitive Landscape, 2024
- 4.1 Introduction
- 4.2 Company market share analysis
- 4.2.1 By region
- 4.2.1.1 North America
- 4.2.1.2 Europe
- 4.2.1.3 Asia Pacific
- 4.2.1 By region
- 4.3 Company matrix analysis
- 4.4 Competitive analysis of major market players
- 4.5 Competitive positioning matrix
- 4.6 Key developments
- 4.6.1 Merger & acquisitions
- 4.6.2 Partnership & collaborations
- 4.6.3 New product launches
- 4.6.4 Expansion plans
Chapter 5 Market Estimates & Forecast, By Product, 2021 - 2034 ($Mn) (Thousand Units)
- 5.1 Surface Aerators
- 5.2 Submerged aerators
- 5.3 Mechanical aerators
- 5.4 Floating aerators
Chapter 6 Market Estimates & Forecast, By Horsepower, 2021 - 2034 ($Mn) (Thousand Units)
- 6.1 Low horsepower (0.5 to 5HP)
- 6.2 Medium horsepower (5 to 20HP)
- 6.3 High horsepower (20+ HP)
Chapter 7 Market Estimates & Forecast, By Material, 2021 - 2034 ($Mn) (Thousand Units)
- 7.1 Metal
- 7.2 Plastic
Chapter 8 Market Estimates & Forecast, By Automation, 2021 - 2034 ($Mn) (Thousand Units)
- 8.1 Automation
- 8.2 Non-automation
Chapter 9 Market Estimates & Forecast, By Application, 2021 - 2034 ($Mn) (Thousand Units)
- 9.1 Key trends
- 9.2 Wastewater treatment
- 9.3 Aquaculture
- 9.4 Water treatment
- 9.5 Food and beverage industry
- 9.6 Mining industry
- 9.7 Pulp and paper manufacturing
- 9.8 Oil and gas.
- 9.9 Others
Chapter 10 Market Estimates & Forecast, By Distribution Channel, 2021 - 2034 ($Mn) (Thousand Units)
- 10.1 Key trends
- 10.2 Online
- 10.3 Offline
Chapter 11 Market Estimates & Forecast, By Region, 2021 - 2034 ($Mn) (Thousand Units)
- 11.1 Key trends
- 11.2 North America
- 11.2.1 U.S.
- 11.2.2 Canada
- 11.3 Europe
- 11.3.1 UK
- 11.3.2 Germany
- 11.3.3 France
- 11.3.4 Italy
- 11.3.5 Spain
- 11.3.6 Russia
- 11.4 Asia Pacific
- 11.4.1 China
- 11.4.2 India
- 11.4.3 Japan
- 11.4.4 South Korea
- 11.4.5 Australia
- 11.5 Latin America
- 11.5.1 Brazil
- 11.5.2 Mexico
- 11.5.3 Argentina
- 11.6 MEA
- 11.6.1 UAE
- 11.6.2 South Africa
- 11.6.3 Saudi Arabia
Chapter 12 Company Profiles
- 12.1 Brother Industries Ltd.
- 12.2 Canon Inc
- 12.3 Domino Printing Sciences
- 12.4 Durst Phototechnik AG
- 12.5 Epson Corporation
- 12.6 Heidelberger Druckmaschinen AG
- 12.7 HP Inc
- 12.8 Kornit Digital Ltd.
- 12.9 Konica Minolta, Inc.
- 12.10 Mutoh Holdings Co., Ltd.
- 12.11 Ricoh Company Ltd.
- 12.12 Seiko Holdings Corporation
- 12.13 Xaar plc
- 12.14 Xerox Holdings Corporation
- 12.15 Zebra Technologies Corporation
