
|
시장보고서
상품코드
1766350
자동차용 E 연료 시장 : 시장 기회, 성장 촉진요인, 산업 동향 분석, 예측(2025-2034년)Automotive E-Fuel Market Opportunity, Growth Drivers, Industry Trend Analysis, and Forecast 2025 - 2034 |
||||||
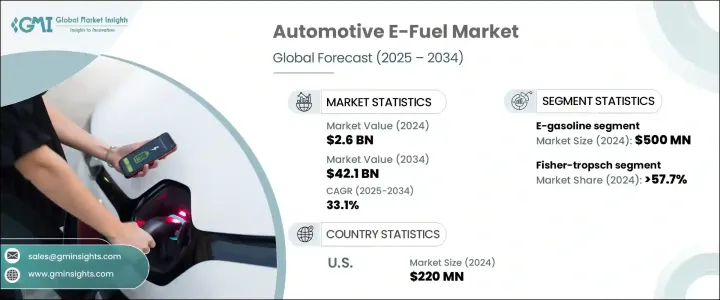
세계의 자동차용 E 연료 시장 규모는 26억 달러로 평가되었고, CAGR 33.1%로 성장할 전망이며, 2034년에는 421억 달러에 이를 것으로 추정됩니다.
이 강력한 성장의 원동력이 되고 있는 것은 이산화탄소 배출량의 삭감과 보다 지속 가능한 수송용 연료로의 시프트를 요구하는 압력 증가입니다. 세계의 정부가 배출 규제를 강화하고 있기 때문에 보다 깨끗한 대체 연료에 대한 투자가 증가하고 있습니다. E 연료는, 특히 항공, 장거리 화물, 해상 수송 등, 전기화가 곤란한 분야 전용의 유망한 솔루션으로서 부상하고 있습니다. 이들 합성 연료는 기존 내연기관(ICE) 차량에 최소한의 개조 혹은 개조 없이 사용할 수 있기 때문에 현재의 인프라를 활용하면서 탈탄소화를 진행하기 위한 매력적인 선택지가 되고 있습니다.
에너지 전환 전략이 진화하는 가운데 기존 엔진과의 호환성과 탄소 중립에 가까운 성능을 실현할 가능성에서 E 연료는 두드러지고 있습니다. 이러한 연료의 채택을 가속화하고 있는 것이 지원적인 규제의 틀입니다. 당국은 지속 가능한 연료 기술의 연구 개발을 촉진하기 위해 보조금, 감세, 자금 제공 프로그램 등의 재정적 인센티브를 전개하고 있습니다. 게다가 에너지원의 다양화와 화석 연료에의 의존도 저감을 향한 세계의 대처가, 정제업자, 자동차 제조업체, 에너지 기업에, 스케일러블한 E 연료 생산에 대한 투자를 재촉하고 있습니다. 재생 가능한 전력, 그린 수소, 회수한 이산화탄소로부터 연료를 합성하는 능력은 기존의 가솔린과 디젤을 대체하는 순환적이고 깨끗한 대체 연료를 제공합니다. 이러한 적응성에 의해, E 연료는, 현재의 화석 연료 의존과 제로 에미션의 수송 부문이라고 하는 장기적 비전과의 갭을 메우는 전략적 선택사항으로서 자리매김됩니다.
| 시장 범위 | |
|---|---|
| 시작 연도 | 2024년 |
| 예측 연도 | 2025-2034년 |
| 시작 금액 | 26억 달러 |
| 예측 금액 | 421억 달러 |
| CAGR | 33.1% |
자동차용 E 연료 시장은 E-가솔린, E-디젤, E-케로신, 에탄올, E-메탄올 등의 제품 유형으로 분류됩니다. 이 중 E-가솔린 부문은 2024년 5억 달러의 가치를 기록했습니다. E 가솔린은 기존 가솔린의 직접 대체품으로 기능하기 때문에 기술적인 개조가 필요 없이 현행 가솔린 엔진에서 사용할 수 있습니다. 인프라 추가 변경 없이 저배출 가스 대체 연료를 제공할 수 있다는 점에서 보다 깨끗한 연료로의 이행에 있어 중요한 주목 분야가 되고 있습니다. E-디젤이나 E-케로신과 같은 다른 분야도 특히 액체 연료가 필수적인 대형차나 항공 용도에서 유망한 가능성을 보여주고 있습니다.
제조 기술의 경우, 시장은 Fisher-Tropsch 법, eRWGS 법 및 기타 방법으로 구분됩니다. 2024년에는 피셔 트롭슈 기술이 시장을 선도하며 총 점유율의 57.7% 이상을 차지했습니다. 이 과정은 합성 가스로 알려진 수소와 일산화탄소의 혼합물에서 액체 탄화수소를 합성합니다. 얻어진 연료는 기존의 디젤 연료와 제트 연료를 대체하며 온실가스 배출 감소를 가능하게 합니다. 피셔 트롭슈는 고품질의 합성 연료를 제조하기 위한 확장 가능한 경로를 제공하며, 시장에서의 그 우위는 상업적인 실행 가능성과 현재의 연료 유통 네트워크와의 적합성을 뒷받침하고 있습니다.
지역적으로 미국은 여전히 자동차용 E 연료 분야의 주요 기업입니다. 2022년 시장 규모는 1억 6,000만 달러, 2023년에는 1억 7,000만 달러로 성장했고, 2024년에는 2억 2,000만 달러에 이르렀습니다. 미국 시장의 성장을 지탱하고 있는 것은, 대체 연료 기술에 대한 관민의 왕성한 투자 및 수송의 탈탄소화를 향한 적극적인 어프로치입니다. 다양한 주가 청정 에너지 정책을 실시하고, 지속 가능한 항공 연료나 화물 수송의 저탄소 솔루션에 초점을 맞춘 파일럿 프로젝트에 인센티브를 주고 있습니다. 끊임없는 기술 혁신은 기술 개발자 및 자동차 회사 간의 파트너십 네트워크의 확대와 맞물려, 미국을 세계의 전자 연료 개발에 있어서 주요한 공헌국으로서 평가하고 있습니다.
경쟁 구도는 합성 연료 생산과 상업화의 선구자인 소수의 주요 기업에 의해 형성됩니다. 이들 기업은 주로 재생에너지원 및 회수탄소를 이용한 E-휘발유와 E-메탄올 생산에 종사하고 있으며 ICE 차량의 탄소 중립 운전을 목표로 하고 있습니다. 이러한 기업의 노력은 생산 능력의 증강, 프로세스 효율의 향상, E-연료를 주류 연료 공급망에 통합하는 것을 지향하고 있습니다. 최첨단 기술에 대한 지속적인 투자와 전략적 제휴를 통해 이들 기업은 지속 가능한 자동차 연료에 대한 세계 수요 증대에 대응하기 위해 시장 확대를 지원하고 있습니다.
목차
제1장 조사 방법 및 범위
제2장 주요 요약
제3장 업계 인사이트
- 생태계 분석
- 규제 상황
- 업계에 미치는 영향요인
- 성장 가능성 분석
- Porter's Five Forces 분석
- PESTEL 분석
제4장 경쟁 구도
- 서문
- 기업의 시장 점유율 분석
- 전략적 노력
- 경쟁 벤치마킹
- 전략적 대시보드
- 혁신 및 기술의 상황
제5장 시장 규모 및 예측 : 재생 에너지원별(2021-2034년)
- 주요 동향
- 현장 태양광 발전
- 바람
제6장 시장 규모 및 예측 : 기술별(2021-2034년)
- 주요 동향
- 피셔 트롭쉬
- eRWGS
- 기타
제7장 시장 규모 및 예측 : 제품별(2021-2034년)
- 주요 동향
- E-가솔린
- E-디젤
- E-등유
- 에탄올
- E-메탄올
- 기타
제8장 시장 규모 및 예측 : 지역별(2021-2034년)
- 주요 동향
- 북미
- 미국
- 캐나다
- 유럽
- 독일
- 영국
- 프랑스
- 네덜란드
- 스페인
- 아시아태평양
- 중국
- 호주
- 인도
- 일본
- 한국
- 중동 및 아프리카
- 사우디아라비아
- 아랍에미리트(UAE)
- 남아프리카
- 라틴아메리카
- 브라질
- 아르헨티나
제9장 기업 프로파일
- Archer Daniels Midland
- Arcadia eFuels
- Ballard Power Systems
- Ceres Power Holding
- Clean Fuels Alliance America
- Climeworks
- eFuel Pacific
- Electrochaea
- ExxonMobil
- FuelCell Energy
- HIF Global
- INFRA Synthetic Fuels
- LanzaJet
- Liquid Wind
- MAN Energy Solutions
- Norsk E-Fuel
- Porsche
- Sunfire
The Global Automotive E-Fuel Market was valued at USD 2.6 billion and is estimated to grow at a CAGR of 33.1% to reach USD 42.1 billion by 2034. This robust growth is driven by mounting pressure to reduce carbon emissions and shift toward more sustainable transportation fuels. Governments worldwide are tightening emissions regulations, prompting increased investment in cleaner fuel alternatives. E-fuels are emerging as a promising solution, especially for sectors that are difficult to electrify, such as aviation, long-haul freight, and maritime transport. These synthetic fuels can be used in existing internal combustion engine (ICE) vehicles with minimal or no modification, which makes them an attractive option for decarbonization while leveraging the current infrastructure.
As energy transition strategies evolve, e-fuels stand out due to their compatibility with traditional engines and their potential to deliver near carbon-neutral performance. Supportive regulatory frameworks are accelerating the adoption of these fuels. Authorities are rolling out financial incentives such as grants, tax breaks, and funding programs to promote research and development of sustainable fuel technologies. Additionally, global efforts to diversify energy sources and reduce dependence on fossil fuels are pushing refiners, automakers, and energy firms to invest in scalable e-fuel production. The ability to synthesize fuels from renewable electricity, green hydrogen, and captured carbon dioxide offers a circular and cleaner alternative to conventional gasoline and diesel. This adaptability positions e-fuels as a strategic option to bridge the gap between current fossil fuel dependency and the long-term vision of a zero-emissions transportation sector.
| Market Scope | |
|---|---|
| Start Year | 2024 |
| Forecast Year | 2025-2034 |
| Start Value | $2.6 Billion |
| Forecast Value | $42.1 Billion |
| CAGR | 33.1% |
The automotive e-fuel market is categorized into several product types, including e-gasoline, e-diesel, e-kerosene, ethanol, and e-methanol. Among these, the e-gasoline segment recorded a value of USD 500 million in 2024. E-gasoline acts as a direct replacement for conventional petrol, which allows it to be used in current gasoline engines without the need for technical modifications. Its ability to offer a lower-emission alternative without additional infrastructure changes makes it a key focus area in the transition to cleaner fuels. Other segments like e-diesel and e-kerosene also show promising potential, especially for heavy-duty vehicles and aviation applications, respectively, where liquid fuels remain essential.
In terms of production technology, the market is segmented into Fischer-Tropsch, eRWGS, and other methods. Fischer-Tropsch technology led the market in 2024, accounting for over 57.7% of the total share. This process synthesizes liquid hydrocarbons from a mixture of hydrogen and carbon monoxide, known as synthesis gas. The resulting fuels can serve as substitutes for traditional diesel and jet fuel, enabling reductions in greenhouse gas emissions. Fischer-Tropsch offers a scalable route for producing high-quality synthetic fuels, and its dominance in the market underscores its commercial viability and compatibility with current fuel distribution networks.
Regionally, the United States remains a major player in the automotive e-fuel space. The market was valued at USD 160 million in 2022, grew to USD 170 million in 2023, and reached USD 220 million in 2024. Growth in the U.S. market is underpinned by strong public and private investment in alternative fuel technologies and a proactive approach toward decarbonizing transportation. Various states are implementing clean energy policies and incentivizing pilot projects that focus on sustainable aviation fuels and low-carbon solutions for freight mobility. Continuous innovation, coupled with a growing network of partnerships between technology developers and automotive companies, positions the U.S. as a key contributor to global e-fuel development.
The competitive landscape is shaped by a handful of leading companies that are pioneering the production and commercialization of synthetic fuels. These companies are primarily involved in producing e-gasoline and e-methanol using renewable energy sources and captured carbon, targeting the carbon-neutral operation of ICE vehicles. Their efforts are geared toward increasing production capacity, enhancing process efficiency, and integrating e-fuels into mainstream fuel supply chains. Through ongoing investment in cutting-edge technology and strategic collaborations, these players are helping scale up the market to meet the rising global demand for sustainable automotive fuels.
Table of Contents
Chapter 1 Methodology & Scope
- 1.1 Market scope & definitions
- 1.2 Market estimates & forecast parameters
- 1.3 Forecast calculation
- 1.4 Data sources
- 1.4.1 Primary
- 1.4.2 Secondary
- 1.4.2.1 Paid
- 1.4.2.2 Public
- 1.5 Market definitions
Chapter 2 Executive Summary
- 2.1 Industry synopsis, 2021 - 2034
Chapter 3 Industry Insights
- 3.1 Industry ecosystem analysis
- 3.2 Regulatory landscape
- 3.3 Industry impact forces
- 3.4 Growth potential analysis
- 3.5 Porter's analysis
- 3.5.1 Bargaining power of suppliers
- 3.5.2 Bargaining power of buyers
- 3.5.3 Threat of new entrants
- 3.5.4 Threat of substitutes
- 3.6 PESTEL analysis
Chapter 4 Competitive landscape, 2025
- 4.1 Introduction
- 4.2 Company market share analysis, 2024
- 4.3 Strategic initiative
- 4.4 Competitive benchmarking
- 4.5 Strategic dashboard
- 4.6 Innovation & technology landscape
Chapter 5 Market Size and Forecast, By Renewable Source, 2021 - 2034 (USD Billion)
- 5.1 Key trends
- 5.2 On-site solar
- 5.3 Wind
Chapter 6 Market Size and Forecast, By Technology, 2021 - 2034 (USD Billion)
- 6.1 Key trends
- 6.2 Fischer-Tropsch
- 6.3 eRWGS
- 6.4 Others
Chapter 7 Market Size and Forecast, By Product, 2021 - 2034 (USD Billion)
- 7.1 Key trends
- 7.2 E-gasoline
- 7.3 E-diesel
- 7.4 E-kerosene
- 7.5 Ethanol
- 7.6 E-methanol
- 7.7 Others
Chapter 8 Market Size and Forecast, By Region, 2021 - 2034 (USD Billion)
- 8.1 Key trends
- 8.2 North America
- 8.2.1 U.S.
- 8.2.2 Canada
- 8.3 Europe
- 8.3.1 Germany
- 8.3.2 UK
- 8.3.3 France
- 8.3.4 Netherlands
- 8.3.5 Spain
- 8.4 Asia Pacific
- 8.4.1 China
- 8.4.2 Australia
- 8.4.3 India
- 8.4.4 Japan
- 8.4.5 South Korea
- 8.5 Middle East & Africa
- 8.5.1 Saudi Arabia
- 8.5.2 UAE
- 8.5.3 South Africa
- 8.6 Latin America
- 8.6.1 Brazil
- 8.6.2 Argentina
Chapter 9 Company Profiles
- 9.1 Archer Daniels Midland
- 9.2 Arcadia eFuels
- 9.3 Ballard Power Systems
- 9.4 Ceres Power Holding
- 9.5 Clean Fuels Alliance America
- 9.6 Climeworks
- 9.7 eFuel Pacific
- 9.8 Electrochaea
- 9.9 ExxonMobil
- 9.10 FuelCell Energy
- 9.11 HIF Global
- 9.12 INFRA Synthetic Fuels
- 9.13 LanzaJet
- 9.14 Liquid Wind
- 9.15 MAN Energy Solutions
- 9.16 Norsk e-Fuel
- 9.17 Porsche
- 9.18 Sunfire
