
|
시장보고서
상품코드
1773227
반추동물 메탄 저감 시장 기회, 성장 촉진요인, 산업 동향 분석 및 예측(2025-2034년)Ruminant Methane Reduction Market Opportunity, Growth Drivers, Industry Trend Analysis, and Forecast 2025 - 2034 |
||||||
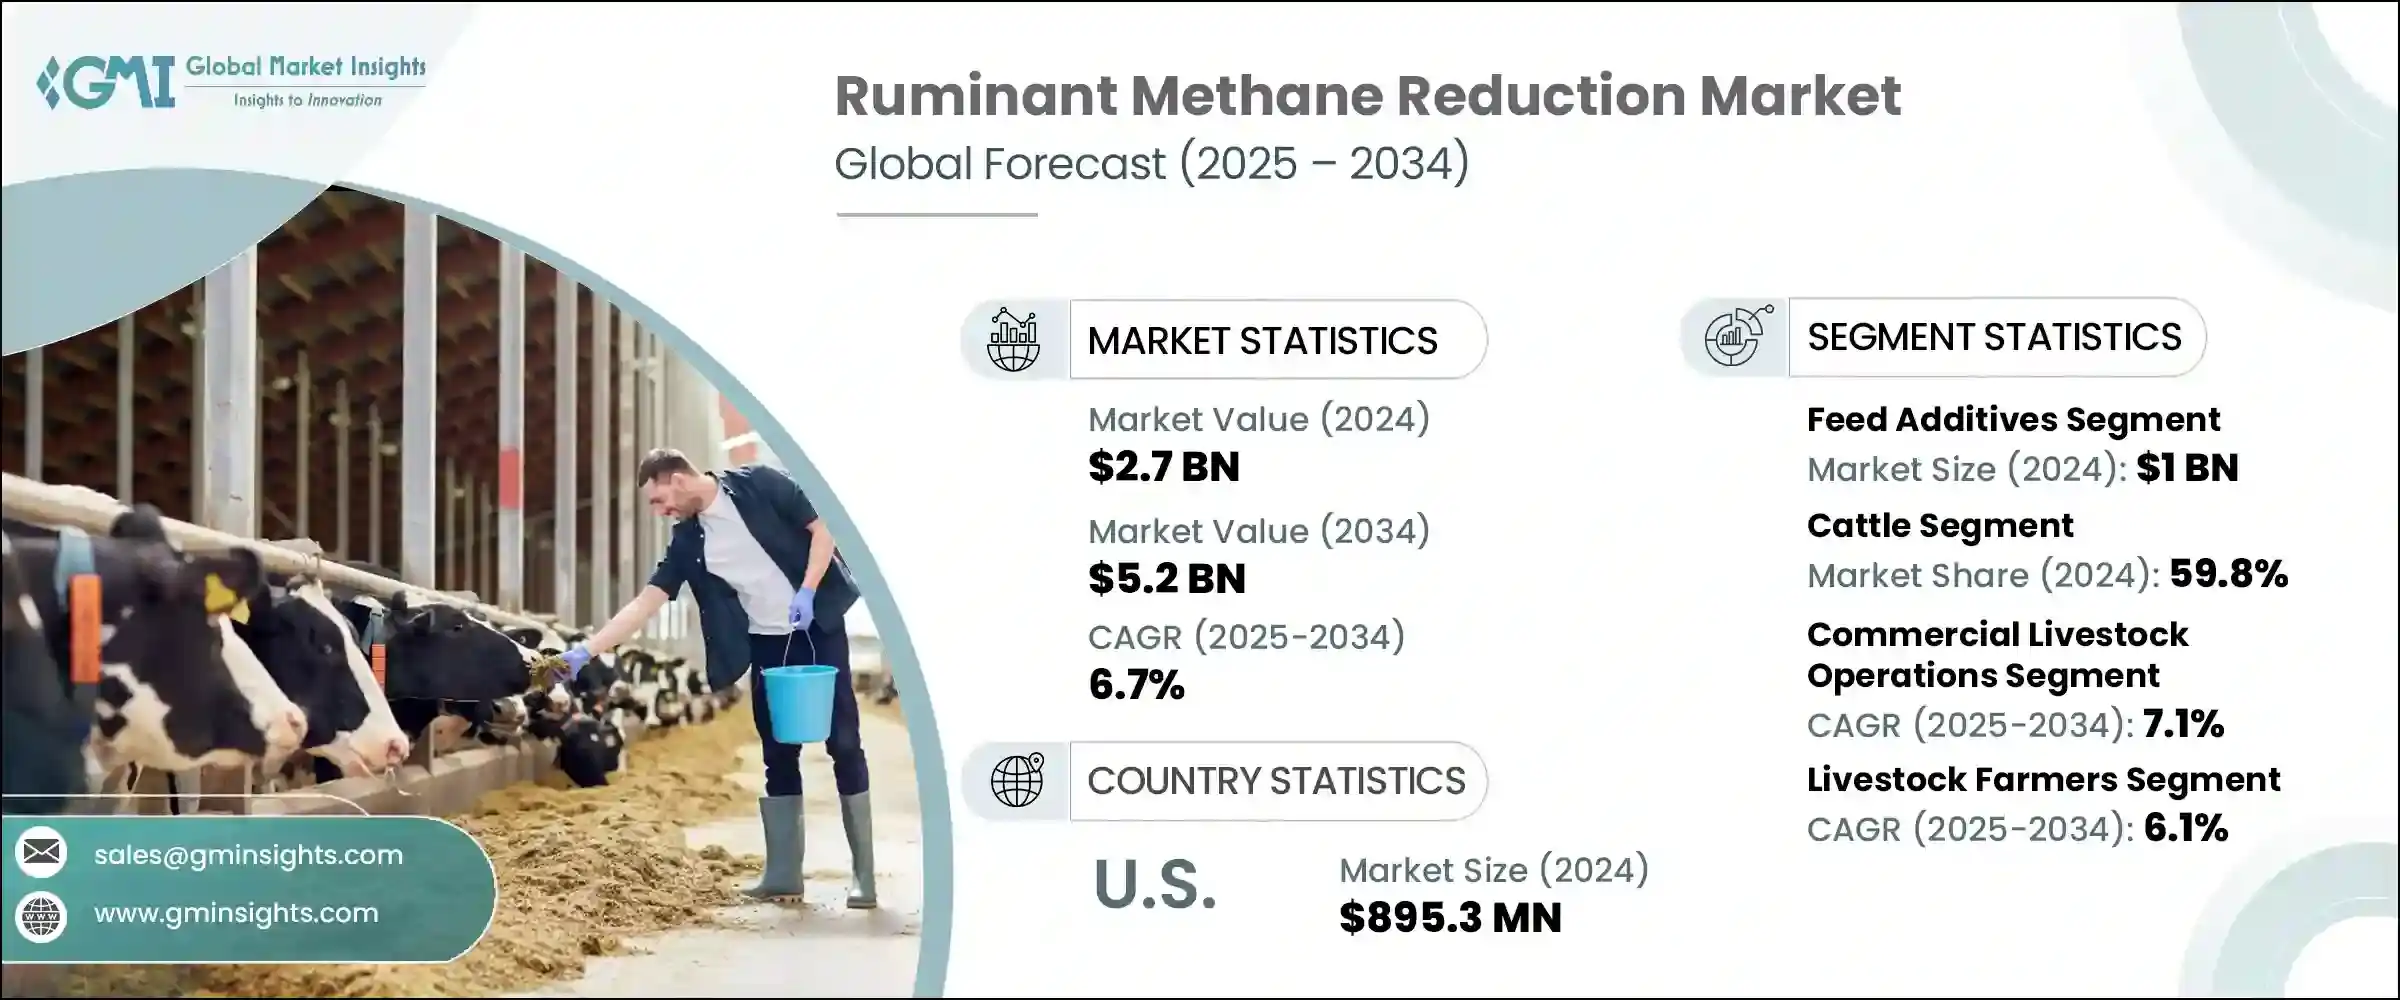
세계의 반추동물 메탄 저감 시장은 2024년에 27억 달러로 평가되었고, CAGR 6.7%로 성장하여 2034년에는 52억 달러에 이를 것으로 추정되고 있습니다.
이러한 성장은 주로 장내 발효로 인한 소, 양, 염소의 메탄 배출을 줄여야 할 필요성이 증가하고 있음을 반영합니다. 동물성 단백질에 대한 전 세계 수요가 증가함에 따라, 반추 동물의 메탄 배출을 줄이는 것은 기후 목표를 달성하고 생산 효율을 높이며 지속 가능한 농법을 지원하는 데 필수적입니다.
완화 접근법에는 사료 첨가제, 유전자 선택, 목초지 관리, 가축군 생산성 향상 등이 포함되며, 3-니트로옥시프로판올(3-NOP)이나 해조류에서 추출한 제품과 같은 사료 첨가제는 가축의 성적을 희생하지 않고도 최대 80%의 메탄 저감 효과를 나타냅니다. 국가 및 기업의 기후 변화 대응 프로그램은 보조금, 탄소배출권 제도, 정책적 프레임워크를 결합하여 도입을 촉진하고 있습니다. 확장성과 지역적 적응이라는 과제가 남아있지만, 사료 기반 전략과 분뇨 소화조와 같은 순환형 바이오경제 솔루션의 조합은 메탄 감축 노력을 더욱 강화할 수 있습니다.
| 시장 범위 | |
|---|---|
| 개시 연도 | 2024년 |
| 예측 연도 | 2025-2034년 |
| 개시 금액 | 27억 달러 |
| 예측 금액 | 52억 달러 |
| CAGR | 6.7% |
확장성과 지역적 농업 조건에 대한 적응이 계속해서 장애물이 되고 있지만, 사료 기반 전략을 보다 광범위한 순환형 바이오경제 관행과 통합하는 것이 메탄 저감 노력을 증폭시키는 데 점점 더 효과적임이 입증되고 있습니다. 메탄 억제제 및 천연 사료 첨가제를 분뇨 혐기성 소화조와 같은 시스템과 연계함으로써 농장은 장내 발효와 폐기물 분해에서 배출되는 메탄에 대응하는 폐쇄 루프 경영을 실현할 수 있습니다. 이러한 이중적 접근 방식은 전반적인 환경적 영향을 개선할 뿐만 아니라 재생에너지와 유기질 비료와 같은 부가가치를 창출할 수 있습니다.
반추동물 메탄 저감 시장의 사료 첨가제 부문은 2024년 10억 달러 규모에 달했습니다. 특히 3-니트로옥시프로판올(3-NOP) 및 브로모포름 기반 솔루션과 같이 과학적으로 입증된 화합물이 동물의 생산성을 손상시키지 않으면서 장내 배출을 감소시키는 높은 효능을 지속적으로 입증함에 따라, 이러한 사료 개입은 메탄 저감 노력의 중심이 되고 있습니다. 합성 억제제와 함께 에센셜 오일, 식물성 추출물, 탄닌과 같은 천연 대체물들이 환경 친화적인 프로파일과 루멘의 미생물 군집에 영향을 미치는 능력으로 인해 사료 내 배합이 증가하고 있습니다.
소 부문은 2024년 59.8%의 점유율을 차지했으며, 2034년까지 연평균 7.1%의 성장률을 보일 것으로 예측됩니다. 이러한 우위는 특히 젖소와 육우의 세계 사육두수 및 메탄 발생량이 많기 때문입니다. 젖소의 경우, 사료 주기가 빈번하고 사료를 효율적으로 이용하기 때문에 사료 기반 감축 전략에 특히 적합합니다. 반면 육우는 넓은 목초지에서 사육되는 경우가 많아 방목 최적화, 사료 조절, 배출량 감소를 위한 유전적 선택으로 메탄 감축의 기회를 제공합니다.
2024년 미국 반추동물 메탄 저감 시장 규모는 8억 9,530만 달러에 달했습니다. 미국의 리더십은 연방 및 주정부 정책의 발전, 기후 변화에 초점을 맞춘 기업의 의무화 증가, 배출 감소 사료 솔루션의 급속한 기술 혁신의 조합에 의해 뒷받침됩니다. 미국의 생산자, 특히 낙농 및 육류 부문은 자발적 탄소 감축 이니셔티브와 제3자 지속가능성 기준에 맞추기 위해 3-NOP, 해조류 기반 화합물, 에센셜 오일과 같은 첨가제를 빠르게 도입하고 있습니다. 환경, 사회, 거버넌스(ESG) 프레임워크에 따른 인증 추진은 이러한 첨가제의 대규모 도입 동기를 더욱 강화하고 있습니다.
이 시장의 주요 기업으로는 Evonik Industries AG, DSM Firmenich, Cargill Incorporated, Archer Daniels Midland Company(ADM), BASF SE 등이 있습니다. 시장 지위를 강화하기 위해 상위 반추 동물 메탄 저감 업체들은 여러 가지 이니셔티브를 시행하고 있습니다. 이들은 효과, 비용 효율성, 지역 적응성을 강화한 차세대 첨가제를 개발하기 위해 연구개발에 많은 투자를 하고 있습니다.
사료 제조업체, 축산 통합업체, 연구기관과의 협업을 통해 제품 검증과 스케일업을 가속화하고 있습니다. 또한, 각 회사는 전 세계 여러 지역에서 파일럿 프로그램 및 사료 공급 시험을 시작하여 성능 데이터와 규제 당국의 승인을 얻고 있습니다. 농업 협동조합 및 기후 변화에 초점을 맞춘 이니셔티브와의 전략적 파트너십을 통해 보조금 및 탄소배출권 프로그램을 통해 사료 첨가제에 대한 접근성을 확대하고 있습니다. 또한, 프로바이오틱스 매트릭스와 메탄 억제제의 조합과 같은 제품 다양화 노력은 기업이 제품을 차별화하고 축산 분야의 새로운 지속가능성 기준을 충족하는 데 도움이 되고 있습니다.
목차
제1장 조사 방법과 범위
제2장 주요 요약
제3장 업계 인사이트
- 생태계 분석
- 공급업체 상황
- 이익률
- 각 단계에서의 부가가치
- 밸류체인에 영향을 미치는 요인
- 파괴적 변화
- 업계에 대한 영향요인
- 성장 촉진요인
- 업계의 잠재적 리스크&과제
- 시장 기회
- 성장 가능성 분석
- 규제 상황
- 북미
- 유럽
- 아시아태평양
- 라틴아메리카
- 중동 및 아프리카
- Porter's Five Forces 분석
- PESTEL 분석
- 가격 동향
- 지역별
- 제품별
- 향후 시장 동향
- 기술 및 혁신 상황
- 현재 기술 동향
- 신기술
- 특허 상황
- 무역 통계(HS코드)(주 : 무역 통계는 주요 국가에 한해 제공됩니다)
- 주요 수입국
- 주요 수출국
- 지속가능성과 환경 측면
- 지속가능한 실천
- 폐기물 감축 전략
- 생산 에너지 효율
- 친환경 대처
제4장 경쟁 구도
- 서론
- 기업의 시장 점유율 분석
- 지역별
- 북미
- 유럽
- 아시아태평양
- 라틴아메리카
- 중동 및 아프리카
- 지역별
- 기업 매트릭스 분석
- 주요 시장 기업의 경쟁 분석
- 경쟁 포지셔닝 매트릭스
- 주요 발전
- 인수합병(M&A)
- 파트너십 및 협업
- 신제품 발매
- 확장 계획
제5장 시장 추산·예측 : 제품별, 2021년-2034년
- 주요 동향
- 사료첨가물
- 메탄 억제제
- 3-nitrooxypropanol (3-nop)
- Bromoform compounds
- 기타 화학 억제제
- 천연 화합물
- 에센셜 오일
- 식물 엑기스
- 해조 첨가물
- 탄닌
- 프로바이오틱스 및 프리바이오틱스
- 메탄을 줄이는 프로바이오틱스
- 프리바이오틱스 화합물
- 효소
- 기타 사료첨가물
- 메탄 억제제
- 유전학 및 육종 솔루션
- 저메탄 유전학
- 선택적 육종 프로그램
- 유전체 선택 툴
- 경영 관행
- 식생활 개선
- 고품질 사료
- 농축 사료 공급
- 정밀사료 공급 시스템
- 방목 관리
- 무리 관리 최적화
- 식생활 개선
- 바이오테크놀러지 솔루션
- 루멘 마이크로바이옴 수정
- 메탄 생성 저해
- 백신 개발
- 기타 해결책
- 대체 단백질원
- 메탄 포집 기술
- 탄소 격리법
제6장 시장 추산·예측 : 반추동물, 2021년-2034년
- 주요 동향
- 소
- 유제품
- 소고기
- 양
- 염소
- 버팔로
- 기타 반추동물
- 사슴
- 알파카 및 라마
- 기타 반추동물
제7장 시장 추산·예측 : 용도별, 2021년-2034년
- 주요 동향
- 상업 축산 사업
- 대규모 낙농장
- 대규모 소고기 생산
- 비육장
- 중소규모 농장
- 가족 경영 낙농장
- 혼합농업 경영
- 전문 축산 농장
- 목초지 기반 시스템
- 광대한 방목 시스템
- 로테이션 방목 시스템
- 삼림 목축 시스템
- 연구 개발
- 학술연구기관
- 정부 연구 프로그램
- 민간 연구개발 시설
제8장 시장 추산·예측 : 최종 용도별, 2021년-2034년
- 주요 동향
- 축산 농가
- 낙농가
- 소고기 생산자
- 양 및 염소 농가
- 사료 제조업체
- 상업 사료 생산자
- 특수 사료 업체
- 사료첨가물 제조업체
- 식품 및 음료 회사
- 유제품 가공업체
- 육류 가공업체
- 푸드서비스 기업
- 정부 및 연구기관
- 농업 부문
- 환경기관
- 연구대학
- 기타
- 탄소배출권 개발자
- 컨설팅 서비스
- 기술 통합업체
제9장 시장 추산·예측 : 지역별, 2021년-2034년
- 주요 동향
- 북미
- 미국
- 캐나다
- 유럽
- 독일
- 영국
- 프랑스
- 이탈리아
- 스페인
- 기타 유럽
- 아시아태평양
- 중국
- 인도
- 일본
- 호주
- 한국
- 기타 아시아태평양
- 라틴아메리카
- 브라질
- 멕시코
- 아르헨티나
- 기타 라틴아메리카
- 중동 및 아프리카
- 사우디아라비아
- 남아프리카공화국
- 아랍에미리트(UAE)
- 기타 중동 및 아프리카
제10장 기업 개요
- Agolin SA
- Alltech Inc.
- Archer Daniels Midland Company(ADM)
- ArkeaBio
- BASF SE
- Blue Ocean Barns
- Cargill, Incorporated
- Chr. Hansen Holding A/S
- DSM-Firmenich
- Elanco Animal Health Incorporated
- Evonik Industries AG
- FutureFeed Pty Ltd
- Kemin Industries, Inc.
- Lallemand Inc.
- Mootral SA
- Novozymes A/S
- Rumin8
- Symbrosia Inc.
- Volta Greentech
- Zelp Ltd
The Global Ruminant Methane Reduction Market was valued at USD 2.7 billion in 2024 and is estimated to grow at a CAGR of 6.7% to reach USD 5.2 billion by 2034. This growth reflects the increasing imperative to reduce methane emissions from cattle, sheep, and goats, which largely result from enteric fermentation. With global demand for animal-based proteins on the rise, tackling ruminant methane output is essential to meet climate targets, enhance production efficiency, and support sustainable farming practices.

Mitigation approaches include dietary additives, genetic selection, pasture management, and increased herd productivity. Feed additives such as 3-nitrooxypropanol (3-NOP) and seaweed-derived products have shown methane reductions of up to 80% without sacrificing animal performance. National and corporate climate programs are combining subsidies, carbon credit systems, and policy frameworks to drive adoption. While scalability and local adaptation challenges persist, coupling feed-based strategies with circular bioeconomy solutions, like manure digesters, is further enhancing methane mitigation efforts.
| Market Scope | |
|---|---|
| Start Year | 2024 |
| Forecast Year | 2025-2034 |
| Start Value | $2.7 Billion |
| Forecast Value | $5.2 Billion |
| CAGR | 6.7% |
While scalability and adaptation to local farming conditions continue to pose hurdles, the integration of feed-based strategies with broader circular bioeconomy practices is proving increasingly effective in amplifying methane reduction efforts. By aligning methane inhibitors and natural feed additives with systems such as manure anaerobic digesters, farms can create closed-loop operations that tackle emissions from both enteric fermentation and waste decomposition. This dual approach not only boosts overall environmental impact but also generates additional value streams, such as renewable energy and organic fertilizers.
The feed additives segment in the ruminant methane reduction market generated USD 1 billion in 2024. These dietary interventions are becoming central to methane mitigation efforts, especially as science-backed compounds like 3-Nitrooxypropanol (3-NOP) and bromoform-based solutions continue to demonstrate high efficacy in lowering enteric emissions without compromising animal productivity. Alongside synthetic inhibitors, there is rising momentum behind natural alternatives such as essential oils, plant-derived extracts, and tannins, which are being increasingly incorporated into feed due to their environmentally friendly profiles and ability to influence the microbial populations in the rumen.
The cattle segment held a 59.8% share in 2024 and is expected to grow at 7.1% CAGR through 2034. This dominance stems from their significant global population and high levels of methane production, particularly among dairy and beef cattle. Dairy cows, with their frequent dietary cycles and efficient feed utilization, are especially compatible with feed-based reduction strategies. Meanwhile, beef cattle, often raised in extensive pasture systems, present opportunities for methane reduction through grazing optimization, dietary tweaks, and genetic selection aimed at lowering emissions intensity.
U.S. Ruminant Methane Reduction Market generated USD 895.3 million in 2024. The country's leadership is backed by a combination of evolving federal and state policies, increasing adoption of climate-focused corporate mandates, and rapid innovation in emission-reducing feed solutions. American producers, particularly in the dairy and beef sectors, are rapidly incorporating additives like 3-NOP, seaweed-based compounds, and essential oils to align with voluntary carbon reduction initiatives and third-party sustainability standards. The push for certification under environmental, social, and governance (ESG) frameworks further motivates the large-scale deployment of these additives.
Leading companies in this market include Evonik Industries AG, DSM Firmenich, Cargill Incorporated, Archer Daniels Midland Company (ADM), and BASF SE. To strengthen their market position, top ruminant methane reduction companies are implementing multiple initiatives They are investing heavily in R& D to develop next-gen additives with enhanced efficacy, cost-effectiveness, and regional adaptability.
Collaborations with feed manufacturers, livestock integrators, and research institutions help accelerate product validation and scale-up. Firms are also launching pilot programs and feeding trials globally to generate performance data and regulatory approvals. Strategic partnerships with agricultural cooperatives and climate-focused initiatives are expanding access to feed additives through subsidies and carbon-credit programs. Additionally, efforts in product diversification-such as combining probiotic matrices with methane inhibitors-are helping companies differentiate offerings and meet emerging sustainability standards in livestock production.
Table of Contents
Chapter 1 Methodology and Scope
- 1.1 Market scope and definition
- 1.2 Research design
- 1.2.1 Research approach
- 1.2.2 Data collection methods
- 1.3 Data mining sources
- 1.3.1 Global
- 1.3.2 Regional/country
- 1.4 Base estimates and calculations
- 1.4.1 Base year calculation
- 1.4.2 Key trends for market estimation
- 1.5 Primary research and validation
- 1.5.1 Primary sources
- 1.6 Forecast model
- 1.7 Research assumptions and limitations
Chapter 2 Executive Summary
- 2.1 Industry 360° synopsis
- 2.2 Key market trends
- 2.2.1 Regional
- 2.2.2 Product
- 2.2.3 Ruminant
- 2.2.4 Application
- 2.2.5 End Use
- 2.3 TAM analysis, 2025-2034
- 2.4 Cxo perspectives: strategic imperatives
- 2.4.1 Executive decision points
- 2.4.2 Critical success factors
- 2.5 Future outlook and strategic recommendations
Chapter 3 Industry Insights
- 3.1 Industry ecosystem analysis
- 3.1.1 Supplier landscape
- 3.1.2 Profit margin
- 3.1.3 Value addition at each stage
- 3.1.4 Factor affecting the value chain
- 3.1.5 Disruptions
- 3.2 Industry impact forces
- 3.2.1 Growth drivers
- 3.2.2 Industry pitfalls and challenges
- 3.2.3 Market opportunities
- 3.3 Growth potential analysis
- 3.4 Regulatory landscape
- 3.4.1 North America
- 3.4.2 Europe
- 3.4.3 Asia Pacific
- 3.4.4 Latin America
- 3.4.5 Middle East & Africa
- 3.5 Porter's analysis
- 3.6 Pestel analysis
- 3.6.1 Technology and innovation landscape
- 3.6.2 Current technological trends
- 3.6.3 Emerging technologies
- 3.7 Price trends
- 3.7.1 By region
- 3.7.2 By product
- 3.8 Future market trends
- 3.9 Technology and innovation landscape
- 3.9.1 Current technological trends
- 3.9.2 Emerging technologies
- 3.10 Patent landscape
- 3.11 Trade statistics (HS code) (note: the trade statistics will be provided for key countries only)
- 3.11.1 Major importing countries
- 3.11.2 Major exporting countries
- 3.12 Sustainability and environmental aspects
- 3.12.1 Sustainable Practices
- 3.12.2 Waste reduction strategies
- 3.12.3 Energy efficiency in production
- 3.12.4 Eco-friendly initiatives
Chapter 4 Competitive landscape, 2024
- 4.1 Introduction
- 4.2 Company market share analysis
- 4.2.1 By Region
- 4.2.1.1 North America
- 4.2.1.2 Europe
- 4.2.1.3 Asia Pacific
- 4.2.1.4 LATAM
- 4.2.1.5 MEA
- 4.2.1 By Region
- 4.3 Company matrix analysis
- 4.4 Competitive analysis of major market players
- 4.5 Competitive positioning matrix
- 4.6 Key developments
- 4.6.1 Mergers & acquisitions
- 4.6.2 Partnerships & collaborations
- 4.6.3 New product launches
- 4.6.4 Expansion plans
Chapter 5 Market Estimates and Forecast, By Product, 2021 – 2034 (USD Billion) (Kilo Tons)
- 5.1 Key trends
- 5.2 Feed additives
- 5.2.1 Methane inhibitors
- 5.2.1.1 3-nitrooxypropanol (3-nop)
- 5.2.1.2 Bromoform compounds
- 5.2.1.3 Other chemical inhibitors
- 5.2.2 Natural compounds
- 5.2.2.1 Essential oils
- 5.2.2.2 Plant extracts
- 5.2.2.3 Seaweed-based additives
- 5.2.2.4 Tannins
- 5.2.3 Probiotics & prebiotics
- 5.2.3.1 Methane-reducing probiotics
- 5.2.3.2 Prebiotic compounds
- 5.2.4 Enzymes
- 5.2.5 Other feed additives
- 5.2.1 Methane inhibitors
- 5.3 Genetic & breeding solutions
- 5.3.1 Low-methane genetics
- 5.3.2 Selective breeding programs
- 5.3.3 Genomic selection tools
- 5.4 Management practices
- 5.4.1 Dietary modifications
- 5.4.1.1 High-quality forages
- 5.4.1.2 Concentrate feeding
- 5.4.1.3 Precision feeding systems
- 5.4.2 Grazing management
- 5.4.3 Herd management optimization
- 5.4.1 Dietary modifications
- 5.5 Biotechnology solutions
- 5.5.1 Rumen microbiome modification
- 5.5.2 Methanogen inhibition
- 5.5.3 Vaccine development
- 5.6 Other solutions
- 5.6.1 Alternative protein sources
- 5.6.2 Methane capture technologies
- 5.6.3 Carbon sequestration methods
Chapter 6 Market Estimates and Forecast, By Ruminant 2021 – 2034 (USD Billion) (Kilo Tons)
- 6.1 Key trends
- 6.2 Cattle
- 6.2.1 Dairy
- 6.2.2 Beef
- 6.3 Sheep
- 6.4 Goats
- 6.5 Buffalo
- 6.6 Other ruminants
- 6.6.1 Deer
- 6.6.2 Alpacas & llamas
- 6.6.3 Other species
Chapter 7 Market Estimates and Forecast, By Application, 2021 – 2034 (USD Billion) (Kilo Tons)
- 7.1 Key trends
- 7.2 Commercial livestock operations
- 7.2.1 Large-scale dairy farms
- 7.2.2 Large-scale beef operations
- 7.2.3 Feedlots
- 7.3 Small & medium farms
- 7.3.1 Family dairy farms
- 7.3.2 Mixed farming operations
- 7.3.3 Specialty livestock farms
- 7.4 Pasture-based systems
- 7.4.1 Extensive grazing systems
- 7.4.2 Rotational grazing systems
- 7.4.3 Silvopastoral systems
- 7.5 Research & development
- 7.5.1 Academic research institutions
- 7.5.2 Government research programs
- 7.5.3 Private R&D facilities
Chapter 8 Market Estimates and Forecast, By End Use 2021 – 2034 (USD Billion) (Kilo Tons)
- 8.1 Key trends
- 8.2 Livestock farmers
- 8.2.1 Dairy farmers
- 8.2.2 Beef producers
- 8.2.3 Sheep & goat farmers
- 8.3 Feed manufacturers
- 8.3.1 Commercial feed producers
- 8.3.2 Specialty feed companies
- 8.3.3 Feed additive manufacturers
- 8.4 Food & beverage companies
- 8.4.1 Dairy processors
- 8.4.2 Meat processors
- 8.4.3 Food service companies
- 8.5 Government & research institutions
- 8.5.1 Agricultural departments
- 8.5.2 Environmental agencies
- 8.5.3 Research universities
- 8.6 Others
- 8.6.1 Carbon credit developers
- 8.6.2 Consulting services
- 8.6.3 Technology integrators
Chapter 9 Market Estimates and Forecast, By Region, 2021 – 2034 (USD Billion) (Kilo Tons)
- 9.1 Key trends
- 9.2 North America
- 9.2.1 U.S.
- 9.2.2 Canada
- 9.3 Europe
- 9.3.1 Germany
- 9.3.2 UK
- 9.3.3 France
- 9.3.4 Italy
- 9.3.5 Spain
- 9.3.6 Rest of Europe
- 9.4 Asia Pacific
- 9.4.1 China
- 9.4.2 India
- 9.4.3 Japan
- 9.4.4 Australia
- 9.4.5 South Korea
- 9.4.6 Rest of Asia Pacific
- 9.5 Latin America
- 9.5.1 Brazil
- 9.5.2 Mexico
- 9.5.3 Argentina
- 9.5.4 Rest of Latin America
- 9.6 Middle East and Africa
- 9.6.1 Saudi Arabia
- 9.6.2 South Africa
- 9.6.3 UAE
- 9.6.4 Rest of MEA
Chapter 10 Company Profiles
- 10.1 Agolin SA
- 10.2 Alltech Inc.
- 10.3 Archer Daniels Midland Company (ADM)
- 10.4 ArkeaBio
- 10.5 BASF SE
- 10.6 Blue Ocean Barns
- 10.7 Cargill, Incorporated
- 10.8 Chr. Hansen Holding A/S
- 10.9 DSM-Firmenich
- 10.10 Elanco Animal Health Incorporated
- 10.11 Evonik Industries AG
- 10.12 FutureFeed Pty Ltd
- 10.13 Kemin Industries, Inc.
- 10.14 Lallemand Inc.
- 10.15 Mootral SA
- 10.16 Novozymes A/S
- 10.17 Rumin8
- 10.18 Symbrosia Inc.
- 10.19 Volta Greentech
- 10.20 Zelp Ltd
