
|
시장보고서
상품코드
1773343
증기 회수 장치 시장 기회, 성장 촉진요인, 산업 동향 분석 및 예측(2025-2034년)Vapor Recovery Units Market Opportunity, Growth Drivers, Industry Trend Analysis, and Forecast 2025 - 2034 |
||||||
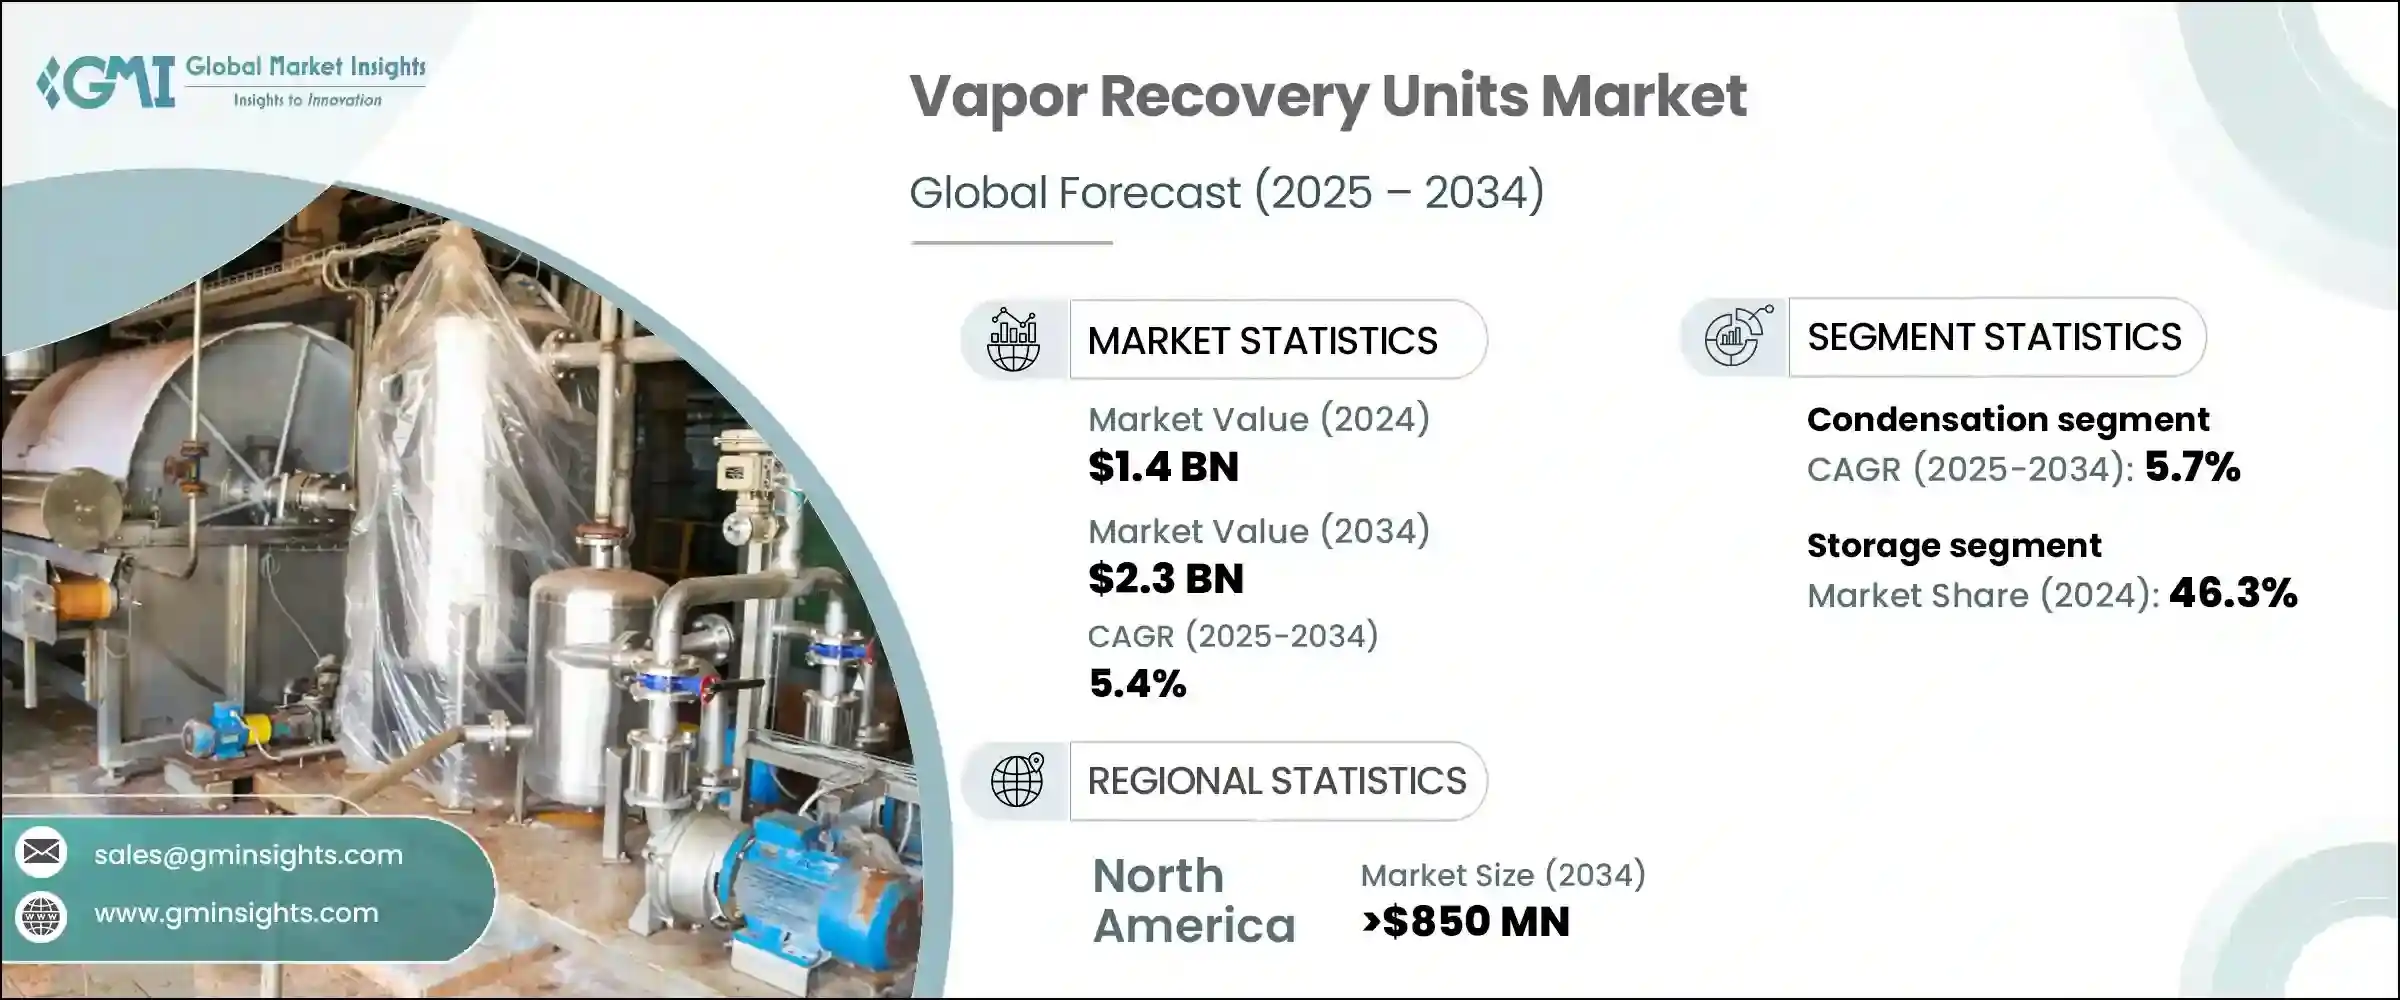
증기 회수 장치 시장 규모는 2024년에 14억 달러로 평가되었고, CAGR 5.4%를 나타내 2034년까지는 23억 달러에 이를 것으로 예측되고 있습니다. 휘발성 유기화합물(VOC)의 배출을 제어하는 환경과 규제상의 중요성에 대한 의식 증가는 시장 기세를 가속화하는데 중요한 역할을 합니다. 일부 개발도상국에서는 정부가 보다 엄격한 배출규제를 도입하고 있으며, 산업계는 규정 준수 전략의 일환으로 증기회수기술의 도입을 강요하고 있습니다. 이러한 장치는 그렇지 않으면 대기로 방출되는 탄화수소 증기를 회수하고 재사용하기위한 지속 가능한 솔루션을 제공합니다. 산업계가 기존의 배출 제어 시스템을 대체하는 환경 친화적이고 효율적인 선택을 추구하는 가운데, VRU는 실행 가능하고 선호되는 옵션으로 급속히 상승하고 있습니다.
환경에 미치는 영향을 최소화할 뿐만 아니라 운용 비용면에서도 유리한 보다 깨끗한 기술 선호가 높아지고 있다는 것이 다양한 분야에서의 VRU 채용에 박차를 가하고 있습니다. 지역에서 연료 저장 시설과 원유 터미널이 증가하고 있습니다. 이 지역의 사업자는 공해 규제의 강화에 대응하고 프로세스 전체의 효율을 향상시키기 위해 증기 회수 시스템에 투자하고 있습니다. 이 최신 시스템은 향상된 여과, 내식성 재료, 일체형 커패시터 및 셀프 클리닝 메커니즘과 같은 고급 기능을 갖추고있어 유지 보수 간격을 최소화하고 운영 신뢰성을 향상시키는 데 도움이 됩니다.
| 시장 범위 | |
|---|---|
| 시작 연도 | 2024년 |
| 예측 연도 | 2025-2034년 |
| 시작 금액 | 14억 달러 |
| 예측 금액 | 23억 달러 |
| CAGR | 5.4% |
또한 회수 연료의 재판매 가치와 규정 준수 및 검사에 필요한 노동 절감이 함께 VRU 시스템의 보급을 더욱 뒷받침하고 있습니다. 에너지 인프라가 확대되어 세계의 저장 네트워크에서 연료 처리량이 증가함에 따라 이러한 유닛에 대한 수요도 계속 증가하고 있습니다.
기술적으로 시장 세분화 시장은 응축 시스템, 흡착 시스템, 압축 시스템으로 구분됩니다. 이 중 응축 분야는 2034년까지 연평균 복합 성장률(CAGR) 5.7%를 나타낼 것으로 예측됩니다. 물 소비를 억제하고 사업의 지속가능성 프로파일을 높일 수 있습니다.회수율을 희생하지 않고 자원 사용량을 삭감하는 에코 콘셔스한 설계로의 시프트가, 응축형 VRU 부문을 크게 뒷받침하고 있습니다.
용도별로 시장은 처리, 저장, 운송으로 분류됩니다. 2024년 시점에서는 저장 용도 부문이 46.3%로 최대의 점유율을 차지했으며, 예측 기간을 통해 우위를 유지할 것으로 전망됩니다. 배출 기준이 엄격해짐에 따라 시설 운영자는 규정 준수를 유지하고 벌칙을 회피하기 위해 VRU를 터미널 인프라에 통합할 필요성이 높아지고 있습니다.
지역별 분석에서 미국의 증기 회수 장치 시장은 2022년 3억 7,360만 달러였으나 2023년 3억 8,980만 달러로 증가했으며, 2024년 4억 720만 달러에 이르렀습니다. 이 나라에서는 특히 석유 업스트림 사업과 셰일 분지에서 VRU의 강력한 도입이 계속되고 있습니다. 대기정화법에 준거할 수 있는 배출제어기술에 대한 수요가 높아지고 있습니다.
경쟁 구도는 중간 정도로 세분화되어 있으며 대규모 산업 제조업체와 전문 시스템 통합 업체가 혼합되어 있습니다. Energy, Kilburn, Zeeco를 포함한 주요 5개사는 합계로 시장 점유율의 약 40%를 차지하고 있습니다. 이들 기업은 전략적인 제품 혁신, 기술 서비스의 확대, 시스템 통합 능력의 강화에 주력해, 그 지위를 강화하고 있습니다.
목차
제1장 조사 방법과 범위
제2장 주요 요약
제3장 업계 인사이트
- 업계 생태계 분석
- 규제 상황
- 업계에 미치는 영향요인
- 성장 촉진요인
- 업계의 잠재적 리스크 및 과제
- 성장 가능성 분석
- Porter's Five Forces 분석
- PESTEL 분석
제4장 경쟁 구도
- 서론
- 기업의 시장 점유율 분석
- 전략적 대시보드
- 전략적 노력
- 경쟁 벤치마킹
- 혁신과 지속가능성의 정세
제5장 시장 규모와 예측 : 기술별(2021-2034년)
- 주요 동향
- 응결
- 흡착
- 흡수
- 압축
제6장 시장 규모와 예측 : 용도별(2021-2034년)
- 주요 동향
- 처리
- 저장
- 운송
제7장 시장 규모와 예측 : 최종 용도별(2021-2034년)
- 주요 동향
- 석유 및 가스
- 화학 및 석유 화학
- 기타
제8장 시장 규모와 예측 : 지역별(2021-2034년)
- 주요 동향
- 북미
- 미국
- 캐나다
- 유럽
- 영국
- 독일
- 프랑스
- 이탈리아
- 스페인
- 러시아
- 노르웨이
- 폴란드
- 아시아태평양
- 중국
- 인도
- 일본
- 한국
- 인도네시아
- 말레이시아
- 중동 및 아프리카
- 사우디아라비아
- 아랍에미리트(UAE)
- 카타르
- 이집트
- 오만
- 남아프리카
- 나이지리아
- 라틴아메리카
- 브라질
- 멕시코
- 아르헨티나
제9장 기업 프로파일
- ALMA Group
- BORSIG
- Cimarron Energy
- Cool Sorption
- Flogistix
- Ingersoll Rand
- KAPPA GI
- Kilburn
- Koch Engineered Solutions
- PSG
- Reynold India
- S&S Technical
- SCS Technologies
- SYMEX Technologies
- Tecam
- VOCZero
- Zeeco
The Global Vapor Recovery Units Market was valued at USD 1.4 billion in 2024 and is estimated to grow at a CAGR of 5.4% to reach USD 2.3 billion by 2034. Growing awareness regarding the environmental and regulatory importance of controlling volatile organic compound (VOC) emissions is playing a significant role in accelerating market momentum. Governments in several developing nations are rolling out stricter emissions norms, compelling industries to deploy vapor recovery technologies as part of their compliance strategy. These units offer a sustainable solution for capturing and recycling hydrocarbon vapors that would otherwise be released into the atmosphere. As industries seek eco-friendly and efficient alternatives to traditional emission control systems, VRUs are rapidly emerging as a viable and preferred choice.
The increasing preference for cleaner technologies that not only minimize environmental impact but also offer operational cost benefits is fueling VRU adoption across multiple sectors. One of the primary drivers for market expansion is the growing number of fuel storage facilities and crude oil terminals, especially in rapidly industrializing regions. Operators in these areas are investing in vapor recovery systems to align with tightening pollution norms and to improve overall process efficiency. The ability of VRUs to recover valuable fuel vapors translates into added cost savings, making them a strategic investment for operators. Moreover, the market is witnessing rising demand for compact, skid-mounted vapor recovery systems designed for space-constrained setups or mobile applications. These modern systems are being equipped with advanced features such as improved filtration, corrosion-resistant materials, integrated condensers, and self-cleaning mechanisms, which help minimize maintenance intervals and enhance operational reliability.
| Market Scope | |
|---|---|
| Start Year | 2024 |
| Forecast Year | 2025-2034 |
| Start Value | $1.4 Billion |
| Forecast Value | $2.3 Billion |
| CAGR | 5.4% |
Additionally, the resale value of recovered fuel, combined with reduced labor requirements for compliance and inspection, is further encouraging the uptake of VRU systems. As the market becomes more performance-driven, the emphasis is shifting toward high-efficiency systems that deliver consistent output while reducing operational disruptions. The demand for such units continues to rise in line with expanding energy infrastructure and increasing fuel throughput across global storage networks.
Technologically, the vapor recovery units market is segmented into condensation, adsorption, absorption, and compression systems. Among these, the condensation segment is expected to expand at a CAGR of 5.7% through 2034. This growth is largely supported by growing interest in closed-loop cooling systems, which allow operators to limit water consumption and enhance the sustainability profile of their operations. The shift toward eco-conscious designs that reduce resource use without compromising recovery rates is giving a considerable push to the condensation VRU segment. These systems are gaining traction for their ability to recover a wide range of hydrocarbons efficiently while aligning with environmental goals.
By application, the market is classified into processing, storage, and transportation. In 2024, the storage application segment held the largest share at 46.3%, and it is expected to maintain dominance throughout the forecast period. This is largely due to the regulatory emphasis on minimizing emissions from storage tanks, particularly emissions stemming from tank breathing and working losses. As emissions standards tighten, facility operators are increasingly compelled to integrate VRUs into their terminal infrastructure to stay in compliance and avoid penalties. The storage sector remains the primary area of application for these systems, with demand showing strong momentum across both large and mid-sized facilities.
In terms of regional analysis, the vapor recovery units market in the United States stood at USD 373.6 million in 2022, rose to USD 389.8 million in 2023, and reached USD 407.2 million in 2024. The country continues to witness strong adoption of VRUs, particularly across upstream oil operations and shale basins. As shale exploration activities grow, there is heightened demand for emissions control technologies capable of managing tank battery releases and complying with the Clean Air Act. Additionally, refineries and fuel distribution terminals are increasing their investment in VRUs to meet strict air quality mandates and reduce their environmental footprint. These efforts are creating new business opportunities for suppliers and driving consistent market growth in the region.
The competitive landscape of the vapor recovery units market is moderately fragmented, with a mix of large-scale industrial manufacturers and specialized system integrators. The top five players, which include Ingersoll Rand, PSG, Cimarron Energy, Kilburn, and Zeeco, collectively account for around 40% of the market share. These companies are focusing on strategic product innovation, technical service expansion, and enhanced system integration capabilities to strengthen their position. As competition intensifies, players are also investing in localized manufacturing, automation, and modular system development to cater to evolving end-user needs across diverse sectors.
Table of Contents
Chapter 1 Methodology & Scope
- 1.1 Research design
- 1.2 Market estimates & forecast parameters
- 1.3 Forecast calculation
- 1.4 Data sources
- 1.4.1 Primary
- 1.4.2 Secondary
- 1.4.2.1 Paid
- 1.4.2.2 Public
- 1.5 Market definitions
Chapter 2 Executive Summary
- 2.1 Industry synopsis, 2021 - 2034
Chapter 3 Industry Insights
- 3.1 Industry ecosystem analysis
- 3.2 Regulatory landscape
- 3.3 Industry impact forces
- 3.3.1 Growth drivers
- 3.3.2 Industry pitfalls & challenges
- 3.4 Growth potential analysis
- 3.5 Porter's analysis
- 3.5.1 Bargaining power of suppliers
- 3.5.2 Bargaining power of buyers
- 3.5.3 Threat of new entrants
- 3.5.4 Threat of substitutes
- 3.6 PESTEL analysis
Chapter 4 Competitive Landscape, 2025
- 4.1 Introduction
- 4.2 Company market share analysis, 2024
- 4.3 Strategic dashboard
- 4.4 Strategic initiatives
- 4.5 Competitive benchmarking
- 4.6 Innovation & sustainability landscape
Chapter 5 Market Size and Forecast, By Technology, 2021 - 2034 (USD Million)
- 5.1 Key trends
- 5.2 Condensation
- 5.3 Adsorption
- 5.4 Absorption
- 5.5 Compression
Chapter 6 Market Size and Forecast, By Application, 2021 - 2034 (USD Million)
- 6.1 Key trends
- 6.2 Processing
- 6.3 Storage
- 6.4 Transportation
Chapter 7 Market Size and Forecast, By End Use, 2021 - 2034 (USD Million)
- 7.1 Key trends
- 7.2 Oil & gas
- 7.3 Chemical & petrochemical
- 7.4 Others
Chapter 8 Market Size and Forecast, By Region, 2021 - 2034 (USD Million)
- 8.1 Key trends
- 8.2 North America
- 8.2.1 U.S.
- 8.2.2 Canada
- 8.3 Europe
- 8.3.1 UK
- 8.3.2 Germany
- 8.3.3 France
- 8.3.4 Italy
- 8.3.5 Spain
- 8.3.6 Russia
- 8.3.7 Norway
- 8.3.8 Poland
- 8.4 Asia Pacific
- 8.4.1 China
- 8.4.2 India
- 8.4.3 Japan
- 8.4.4 South Korea
- 8.4.5 Indonesia
- 8.4.6 Malaysia
- 8.5 Middle East & Africa
- 8.5.1 Saudi Arabia
- 8.5.2 UAE
- 8.5.3 Qatar
- 8.5.4 Egypt
- 8.5.5 Oman
- 8.5.6 South Africa
- 8.5.7 Nigeria
- 8.6 Latin America
- 8.6.1 Brazil
- 8.6.2 Mexico
- 8.6.3 Argentina
Chapter 9 Company Profiles
- 9.1 ALMA Group
- 9.2 BORSIG
- 9.3 Cimarron Energy
- 9.4 Cool Sorption
- 9.5 Flogistix
- 9.6 Ingersoll Rand
- 9.7 KAPPA GI
- 9.8 Kilburn
- 9.9 Koch Engineered Solutions
- 9.10 PSG
- 9.11 Reynold India
- 9.12 S&S Technical
- 9.13 SCS Technologies
- 9.14 SYMEX Technologies
- 9.15 Tecam
- 9.16 VOCZero
- 9.17 Zeeco

