
|
시장보고서
상품코드
1773463
식품 불내증 제품 시장 기회, 성장 촉진요인, 산업 동향 분석 및 예측(2025-2034년)Food Intolerance Products Market Opportunity, Growth Drivers, Industry Trend Analysis, and Forecast 2025 - 2034 |
||||||
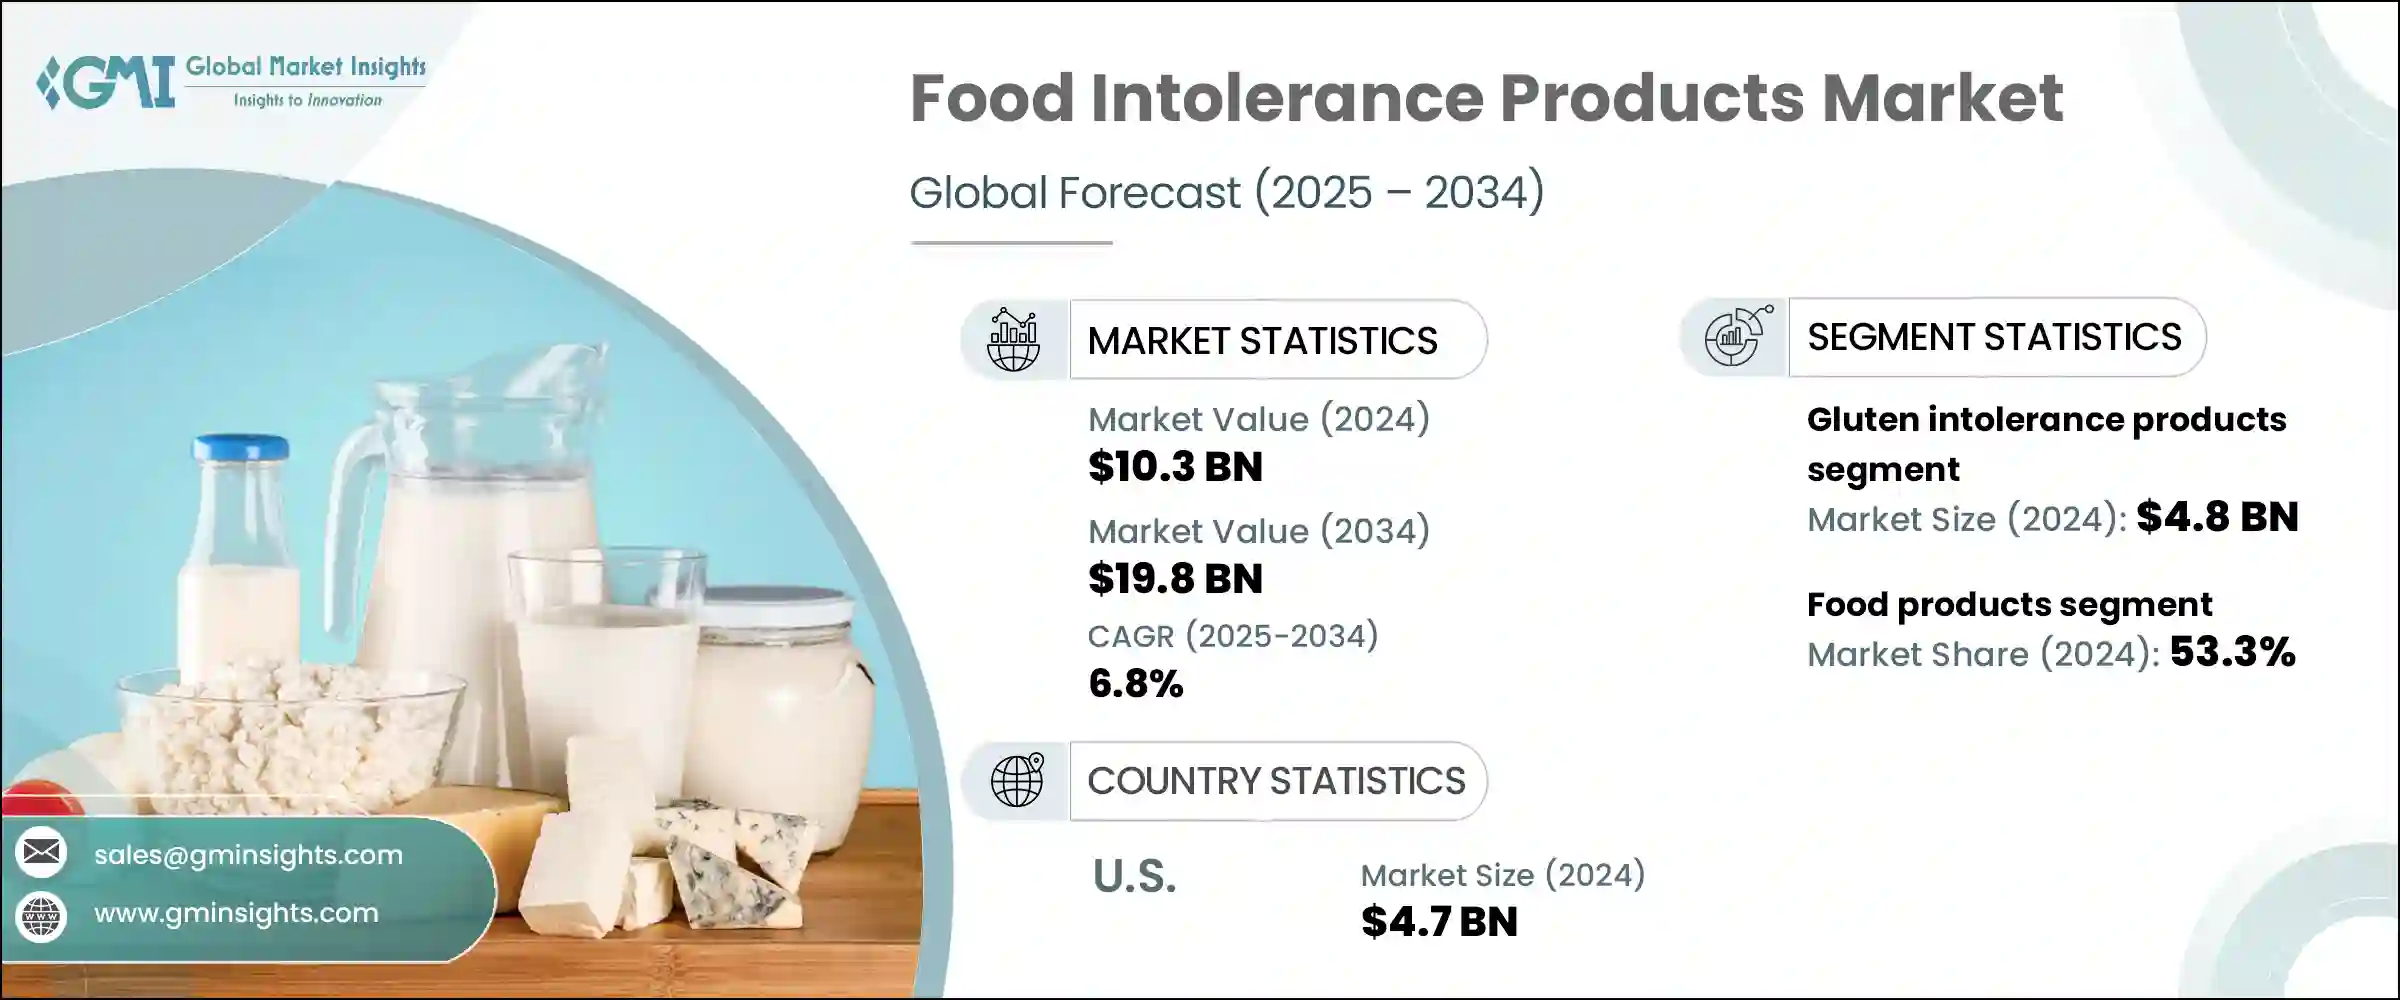
세계의 식품 불내증 제품 시장은 2024년에는 103억 달러로 평가되었으며 2034년에는 198억 달러에 이를 것으로 추정되며, CAGR 6.8%로 성장할 전망입니다.
이 시장은 식품 민감성에 대한 소비자의 인식이 높아지고 개인 맞춤형 영양에 대한 수요가 확대됨에 따라 꾸준한 성장을 보이고 있습니다. 진단 도구가 개선되고 식습관이 진화함에 따라, 더 많은 소비자들이 글루텐, 유당, FODMAP 관련 문제 등 특정 불내증에 맞는 제품으로 눈을 돌리고 있습니다. 특히 건강에 민감한 쇼핑객들이 유발 성분을 피할 뿐 아니라 웰빙 동향에 부합하는 제품을 찾게 되면서, 클린 라벨, 알레르기 유발 성분이 없는 기능성 식품으로의 전환이 결정적인 요인이 되고 있습니다. 이러한 제품은 이제 더 큰 건강식 부문에서 필수적인 부분이 되었습니다.

시장 가치의 대부분은 여전히 시리얼, 유제품 대체품, 스낵 제품, 제빵 제품 등 소매 및 식품 서비스 부문에서 수요가 높은 유형의 식품에서 발생하고 있습니다. 동시에, 아직은 작은 부문이지만, 보충제 및 소화 보조제가 더 복잡한 식품 민감성을 관리하는 소비자들의 관심을 계속 받고 있습니다. 이 부문에서는 소화가 잘 되지 않거나 잘 알려지지 않은, 또는 여러 가지 원인이 있는 불내증 환자를 위한 제품이 많이 출시되고 있습니다.
| 시장 범위 | |
|---|---|
| 시작 연도 | 2024년 |
| 예측 연도 | 2025-2034년 |
| 시작 금액 | 103억 달러 |
| 예측 금액 | 198억 달러 |
| CAGR | 6.8% |
2024년에 글루텐 불내증 제품 부문은 48억 달러로 평가되었으며, 2025년부터 2034년까지 연평균 6.6%의 성장률을 보일 것으로 예상됩니다. 이 부문이 우위를 차지하는 이유는 글루텐 관련 질환에 대한 인식과 진단이 증가하고 글루텐이 함유되지 않은 식단이 생활 방식의 일부로 자리 잡았기 때문입니다. 이 분야에서는 특히 글루텐이 함유되지 않은 스낵, 제빵 제품 및 즉석식 식사의 맛, 식감 및 영양 성분 개선을 중심으로 혁신의 물결이 일고 있으며, 이는 소비자의 장기적인 관심과 브랜드 충성도를 촉진하고 있습니다.
식품 불내증 제품 시장의 식품 부문은 2024년에 54억 달러의 매출을 올렸으며, 2034년까지 연평균 7%의 성장률을 유지하여 53.3%의 점유율을 차지할 것으로 예상됩니다. 이 부문은 식품 민감성에 대한 인식이 높아지고, 체강 질병 및 유당 불내증과 같은 식이 장애의 유병률이 증가함에 따라 계속해서 성장하고 있습니다. 브랜드들은 식물성 대체 유제품, 글루텐이 함유되지 않은 스낵, 일반적인 자극 성분이 함유되지 않은 제빵류 등 알레르기에 민감한 제품을 출시하며 제품군을 적극적으로 확대하고 있습니다. 기업들이 건강 요구와 맛의 선호도를 모두 충족하는 식품을 개발하기 위해 노력하면서 수요와 공급의 격차는 점차 줄어들고 있습니다.
미국의 식품 불내증 제품 시장은 2024년 47억 달러로 평가되었으며, 2025년부터 2034년까지 연평균 성장률(CAGR) 6.9%로 성장할 것으로 예상됩니다. 이 성장은 소비자 교육 강화, 건강 중심의 식습관, 식품 민감성을 인식하는 개인의 증가에 힘입고 있습니다. 미국 소비자들은 식습관 선택에 있어 더욱 선택적이어지고 있으며, 이는 기업들이 제품 다양화와 혁신에 투자하도록 장려하고 있습니다. 이에 따라 제조업체들은 특정 영양 요구사항을 충족시키기 위해 노력하고 있으며, 이는 전국적으로 맞춤형 식품 알레르기 제품의 공급이 확대되는 결과를 초래했습니다.
식품 불내증 제품 업계에서 사업을 전개하는 주요 기업은 Lifeway Foods, Inc., McNeil Consumer Healthcare Lactaid, General Mills, Inc., Danone SA, Nestle SA등이 있어, 이러한 브랜드들은 이 역동적인 시장에서 입지를 확대하기 위해 적극적으로 노력하고 있습니다. 식품 불내증 분야의 주요 업체들은 입지를 공고히 하기 위해 다양한 전략을 혼합하여 사용하고 있습니다. 제품 포트폴리오를 확장해 새롭게 등장하는 불내증에 대응하고, 알레르기 성분이 없는 식품의 맛과 텍스처를 개선하기 위해 연구개발(R&D)에 투자하며, 영양사 및 의료 전문가와의 협력을 통해 신뢰성을 높이고 있습니다. 기업들은 또한 클린 라벨(Clean Label) 실천을 도입하고 디지털 플랫폼을 활용해 건강에 관심이 높은 소비자와의 소통을 강화하고 있습니다. 많은 기업은 니치 브랜드를 인수하거나 전문 제품 라인을 출시해 변화하는 소비자 수요에 대응하며, 전자상거래 및 소매 매장에서의 존재감을 확대해 도달 범위와 가시성을 극대화하고 있습니다.
목차
제1장 조사 방법과 범위
제2장 주요 요약
제3장 업계 인사이트
- 생태계 분석
- 공급자의 상황
- 이익률
- 각 단계에서의 부가가치
- 밸류체인에 영향을 주는 요인
- 혁신
- 업계에 미치는 영향요인
- 성장 촉진요인
- 식품 불내증 및 알레르기 발생률 증가
- 인지도와 진단률 향상
- 무첨가 제품에 대한 수요 증가
- 제품 공급량 및 다양성 확대
- 업계의 잠재적 위험 및 과제
- 특수 제품의 프리미엄 가격
- 제형 및 맛의 과제
- 시장 기회
- 성장 촉진요인
- 성장 가능성 분석
- 규제 상황
- 북미
- 유럽
- 아시아태평양
- 라틴아메리카
- 중동 및 아프리카
- Porter's Five Forces 분석
- PESTEL 분석
- 가격 동향
- 장래 시장 동향
- 기술과 혁신의 상황
- 현재의 기술 동향
- 신흥기술
- 특허 상황
- 무역 통계(HS코드)(참고 : 무역 통계는 주요 국가에서만 제공됨)
- 주요 수입국
- 주요 수출국
- 지속가능성과 환경 측면
- 지속가능한 관행
- 폐기물 감축 전략
- 생산에 있어서의 에너지 효율
- 환경 친화적 인 노력
제4장 경쟁 구도
- 소개
- 기업의 시장 점유율 분석
- 지역별
- 북미
- 유럽
- 아시아태평양
- 라틴아메리카
- 중동 및 아프리카
- 지역별
- 기업 매트릭스 분석
- 주요 시장 기업의 경쟁 분석
- 경쟁 포지셔닝 매트릭스
- 주요 발전
- 합병과 인수
- 파트너십 및 협업
- 신제품 발매
- 확장 계획
제5장 시장 추계 및 예측 : 불내증 유형별(2021-2034년)
- 주요 동향
- 유당 불내증 제품
- 글루텐 불내증 제품
- FODMAP 불내증 제품
- 히스타민 불내증 제품
- 아황산염 불내증 제품
- 기타 불내증 제품
제6장 시장 추계 및 예측 : 상품 부문별(2021-2034년)
- 주요 동향
- 식품
- 제빵 제품 및 시리얼 제품
- 빵 및 제빵 제품
- 조식용 시리얼 및 그라놀라
- 쿠키 및 크래커
- 기타 제빵 제품
- 유제품 대체품
- 우유 대체품
- 치즈 대체품
- 요구르트 대체품
- 아이스크림 및 디저트 대체품
- 기타 유제품 대체품
- 스낵과 편의점 식품
- 칩 및 간식
- 영양 바 및 단백질 바
- 조리 식품
- 기타 스낵 제품
- 조미료, 드레싱, 소스
- 과자류 및 디저트
- 유아식 및 분유
- 기타 식품
- 제빵 제품 및 시리얼 제품
- 음료
- 식물성 우유
- 과일 & 야채 주스
- 기능성 음료
- 기타 음료
- 보충제 및 소화 촉진제
- 소화효소
- 프로바이오틱스와 프리바이오틱스
- 기타 보충
제7장 시장 추계 및 예측 : 유통 채널별(2021-2034년)
- 주요 동향
- 슈퍼마켓 및 대형 슈퍼마켓
- 전문점 및 건강식품점
- 편의점
- 온라인 소매
- 전자상거래 플랫폼
- 소비자 직접 판매 웹사이트
- 구독 서비스
- 약국 및 드럭스토어
- 푸드서비스 & HoReCa
- 기타
제8장 시장 추계 및 예측 : 지역별(2021-2034년)
- 주요 동향
- 북미
- 미국
- 캐나다
- 유럽
- 영국
- 독일
- 프랑스
- 이탈리아
- 스페인
- 네덜란드
- 기타 유럽
- 아시아태평양
- 중국
- 인도
- 일본
- 한국
- 호주
- 기타 아시아태평양
- 라틴아메리카
- 브라질
- 멕시코
- 아르헨티나
- 기타 라틴아메리카
- 중동 및 아프리카
- 남아프리카
- 사우디아라비아
- 아랍에미리트(UAE)
- 기타 중동 및 아프리카
제9장 기업 프로파일
- Alpro
- Amy's Kitchen, Inc.
- Conagra Brands, Inc.
- Daiya Foods Inc.
- Danone SA
- Dr. Schar AG/SPA
- Enjoy Life Foods(Mondelez International)
- Follow Your Heart
- Fody Food Co.
- General Mills, Inc.
- Glutino(The Glutino Food Group)
- Kellogg Company
- Lactaid(McNeil Nutritionals, LLC)
- Mondelez International, Inc.
- Nestle SA
- Oatly Group AB
- The Hain Celestial Group, Inc.
- The Kraft Heinz Company
- The Lactalis Group
- Udis Gluten Free(Boulder Brands, Inc.)
The Global Food Intolerance Products Market was valued at USD 10.3 billion in 2024 and is estimated to grow at a CAGR of 6.8% to reach USD 19.8 billion by 2034. This market has been experiencing consistent growth, fueled by increased consumer awareness of food sensitivities and a broader demand for personalized nutrition. As diagnostic tools improve and dietary preferences evolve, more consumers are turning to products tailored to specific intolerances, such as gluten, lactose, and FODMAP-related issues. The shift toward clean-label, allergen-free, and functional food is becoming a defining factor, especially as health-conscious shoppers look for items that not only avoid triggering ingredients but also align with wellness trends. These products have now become a vital part of the larger healthy eating category.
Most of the market's value still comes from tangible food items such as cereals, dairy substitutes, snack products, and baked goods, which enjoy strong demand from both retail and food service sectors. At the same time, although still a smaller segment, supplements and digestive support aids continue to gain attention from consumers managing more complex food sensitivities. These segments are witnessing increased product launches focused on improving digestion and offering relief for individuals with lesser-known or multi-faceted intolerances.
| Market Scope | |
|---|---|
| Start Year | 2024 |
| Forecast Year | 2025-2034 |
| Start Value | $10.3 Billion |
| Forecast Value | $19.8 Billion |
| CAGR | 6.8% |
In 2024, the gluten intolerance products segment was valued at USD 4.8 billion and is forecasted to grow at a CAGR of 6.6% between 2025 and 2034. This segment dominates because of the growing awareness and diagnosis of gluten-related disorders and the lifestyle adoption of gluten-free diets. There's been a wave of innovation in this space, particularly around improving taste, texture, and nutritional content in gluten-free snacks, bakery items, and ready-to-eat meals, driving long-term consumer interest and brand loyalty.
The food products segment in the food intolerance products market generated USD 5.4 billion in 2024 and is expected to maintain a 7% CAGR through 2034, accounting for a 53.3% share. This segment continues to thrive due to rising food sensitivity awareness and the increasing prevalence of dietary conditions like celiac disease and lactose intolerance. Brands are aggressively expanding their lines with allergen-conscious offerings, such as plant-based dairy alternatives, gluten-free snacks, and baked goods formulated without common irritants. The gap between demand and available options is gradually narrowing as companies step up to develop foods that meet both health needs and taste preferences.
United States Food Intolerance Products Market was valued at USD 4.7 billion in 2024 and is set to grow at a CAGR of 6.9% from 2025 to 2034. This significant growth is propelled by heightened consumer education, health-focused eating habits, and an increasing number of individuals identifying food sensitivities. American consumers are becoming more selective in their dietary choices, encouraging companies to invest in product diversification and innovation. As a result, producers must cater to specific nutritional demands, which has led to a broader offering of targeted food intolerance products throughout the country.
The leading companies operating in the Food Intolerance Products Industry include Lifeway Foods, Inc., McNeil Consumer Healthcare Lactaid, General Mills, Inc., Danone S.A., and Nestle S.A. These brands are actively engaged in expanding their footprint in this dynamic market. To solidify their presence, key players in the food intolerance space are using a mix of targeted strategies. They are expanding their product portfolios to cater to emerging intolerances, investing in R&D to improve the taste and texture of allergen-free foods, and forming collaborations with dieticians and healthcare professionals to enhance credibility. Companies are also adopting clean-label practices and leveraging digital platforms to engage with health-conscious audiences. Many are acquiring niche brands and launching specialized product lines to cater to evolving consumer demands, while also increasing their presence in e-commerce and retail shelves to maximize reach and visibility.
Table of Contents
Chapter 1 Methodology & Scope
- 1.1 Market scope and definition
- 1.2 Research design
- 1.2.1 Research approach
- 1.2.2 Data collection methods
- 1.3 Data mining sources
- 1.3.1 Global
- 1.3.2 Regional/Country
- 1.4 Base estimates and calculations
- 1.4.1 Base year calculation
- 1.4.2 Key trends for market estimation
- 1.5 Primary research and validation
- 1.5.1 Primary sources
- 1.6 Forecast model
- 1.7 Research assumptions and limitations
Chapter 2 Executive Summary
- 2.1 Industry 3600 synopsis
- 2.2 Key market trends
- 2.3 TAM analysis, 2025-2034
- 2.4 CXO perspectives: strategic imperatives
- 2.5 Executive decision points
- 2.6 Critical success factors
- 2.7 Future outlook and strategic recommendations
Chapter 3 Industry Insights
- 3.1 Industry ecosystem analysis
- 3.1.1 Supplier landscape
- 3.1.2 Profit margin
- 3.1.3 Value addition at each stage
- 3.1.4 Factor affecting the value chain
- 3.1.5 Disruptions
- 3.2 Industry impact forces
- 3.2.1 Growth drivers
- 3.2.1.1 Rising prevalence of food intolerances & allergies
- 3.2.1.2 Growing awareness & diagnosis rates
- 3.2.1.3 Increasing demand for free-from products
- 3.2.1.4 Expanding product availability & variety
- 3.2.2 Industry pitfalls and challenges
- 3.2.2.1 Premium pricing of specialty products
- 3.2.2.2 Formulation & taste challenges
- 3.2.3 Market opportunities
- 3.2.1 Growth drivers
- 3.3 Growth potential analysis
- 3.4 Regulatory landscape
- 3.4.1 North America
- 3.4.2 Europe
- 3.4.3 Asia pacific
- 3.4.4 Latin America
- 3.4.5 Middle east & Africa
- 3.5 Porter's analysis
- 3.6 Pestel analysis
- 3.7 Price trends
- 3.8 Future market trends
- 3.9 Technology and innovation landscape
- 3.9.1 Current technological trends
- 3.9.2 Emerging technologies
- 3.10 Patent landscape
- 3.11 Trade statistics (HS code) (Note: the trade statistics will be provided for key countries only)
- 3.11.1 Major importing countries
- 3.11.2 Major exporting countries
- 3.12 Sustainability and environmental aspects
- 3.12.1 Sustainable practices
- 3.12.2 Waste reduction strategies
- 3.12.3 Energy efficiency in production
- 3.12.4 Eco-friendly initiatives
Chapter 4 Competitive Landscape, 2024
- 4.1 Introduction
- 4.2 Company market share analysis
- 4.2.1 By region
- 4.2.1.1 North America
- 4.2.1.2 Europe
- 4.2.1.3 Asia Pacific
- 4.2.1.4 LATAM
- 4.2.1.5 MEA
- 4.2.1 By region
- 4.3 Company matrix analysis
- 4.4 Competitive analysis of major market players
- 4.5 Competitive positioning matrix
- 4.6 Key developments
- 4.6.1 Mergers & acquisitions
- 4.6.2 Partnerships & collaborations
- 4.6.3 New Product Launches
- 4.6.4 Expansion plans
Chapter 5 Market Estimates & Forecast, By Intolerance Type, 2021-2034 (USD Billion) (Kilo Tons)
- 5.1 Key trends
- 5.2 Lactose intolerance products
- 5.3 Gluten intolerance products
- 5.4 Fodmap intolerance products
- 5.5 Histamine intolerance products
- 5.6 Sulfite intolerance products
- 5.7 Other intolerance products
Chapter 6 Market Estimates & Forecast, By Product Category, 2021-2034 (USD Billion) (Kilo Tons)
- 6.1 Key trends
- 6.2 Food products
- 6.2.1 Bakery & cereal products
- 6.2.1.1 Bread & baked goods
- 6.2.1.2 Breakfast cereals & granola
- 6.2.1.3 Cookies & crackers
- 6.2.1.4 Other bakery products
- 6.2.2 Dairy alternatives
- 6.2.2.1 Milk alternatives
- 6.2.2.2 Cheese alternatives
- 6.2.2.3 Yogurt alternatives
- 6.2.2.4 Ice cream & dessert alternatives
- 6.2.2.5 Other dairy alternatives
- 6.2.3 Snacks & convenience foods
- 6.2.3.1 Chips & savory snacks
- 6.2.3.2 Nutrition & protein bars
- 6.2.3.3 Ready meals & prepared foods
- 6.2.3.4 Other snack products
- 6.2.4 Condiments, dressings & sauces
- 6.2.4.1 Confectionery & desserts
- 6.2.4.2 Baby food & infant formulas
- 6.2.4.3 Other food products
- 6.2.1 Bakery & cereal products
- 6.3 Beverages
- 6.3.1 Plant-based milk
- 6.3.2 Fruit & vegetable juices
- 6.3.3 Functional beverages
- 6.3.4 Other beverages
- 6.4 Supplements & digestive aids
- 6.4.1 Digestive enzymes
- 6.4.2 Probiotics & prebiotics
- 6.4.3 Other supplements
Chapter 7 Market Estimates & Forecast, By Distribution Channel, 2021-2034 (USD Billion) (Kilo Tons)
- 7.1 Key trends
- 7.2 Supermarkets & hypermarkets
- 7.3 Specialty stores & health food stores
- 7.4 Convenience stores
- 7.5 Online retail
- 7.5.1 E-commerce platforms
- 7.5.2 Direct-to-consumer websites
- 7.5.3 Subscription services
- 7.6 Pharmacies & drugstores
- 7.7 Foodservice & HoReCa
- 7.8 Others
Chapter 8 Market Estimates & Forecast, By Region, 2021-2034 (USD Billion) (Kilo Tons)
- 8.1 Key trends
- 8.2 North America
- 8.2.1 U.S.
- 8.2.2 Canada
- 8.3 Europe
- 8.3.1 UK
- 8.3.2 Germany
- 8.3.3 France
- 8.3.4 Italy
- 8.3.5 Spain
- 8.3.6 Netherlands
- 8.3.7 Rest of Europe
- 8.4 Asia Pacific
- 8.4.1 China
- 8.4.2 India
- 8.4.3 Japan
- 8.4.4 South Korea
- 8.4.5 Australia
- 8.4.6 Rest of Asia Pacific
- 8.5 Latin America
- 8.5.1 Brazil
- 8.5.2 Mexico
- 8.5.3 Argentina
- 8.5.4 Rest of Latin America
- 8.6 Middle East and Africa
- 8.6.1 South Africa
- 8.6.2 Saudi Arabia
- 8.6.3 UAE
- 8.6.4 Rest of Middle East and Africa
Chapter 9 Company Profiles
- 9.1 Alpro
- 9.2 Amy's Kitchen, Inc.
- 9.3 Conagra Brands, Inc.
- 9.4 Daiya Foods Inc.
- 9.5 Danone S.A.
- 9.6 Dr. Schar AG/SPA
- 9.7 Enjoy Life Foods (Mondelez International)
- 9.8 Follow Your Heart
- 9.9 Fody Food Co.
- 9.10 General Mills, Inc.
- 9.11 Glutino (The Glutino Food Group)
- 9.12 Kellogg Company
- 9.13 Lactaid (McNeil Nutritionals, LLC)
- 9.14 Mondelez International, Inc.
- 9.15 Nestle S.A.
- 9.16 Oatly Group AB
- 9.17 The Hain Celestial Group, Inc.
- 9.18 The Kraft Heinz Company
- 9.19 The Lactalis Group
- 9.20 Udis Gluten Free (Boulder Brands, Inc.)
