
|
시장보고서
상품코드
1797828
니들 코크스 시장 : 기회, 성장 촉진요인, 산업 동향 분석, 예측(2025-2034년)Needle Coke Market Opportunity, Growth Drivers, Industry Trend Analysis, and Forecast 2025 - 2034 |
||||||
세계의 니들 코크스 시장은 2024년에 66억 달러로 평가되었으며 CAGR 6.1%로 성장해 2034년까지 120억 달러에 이를 것으로 추정됩니다.
이 분야의 성장은 철강 생산에 널리 사용되는 전기로용 흑연 전극의 제조에 있어서 중요한 역할에 크게 영향을 받고 있습니다. 어시큘러 구조와 낮은 열팽창 계수로 알려진 이 고급 석유 코크스는 탁월한 열전도성과 전기 전도성이 필수적인 용도에 특히 적합합니다. 철강 업계에서는 기존의 고로법에 비해 에너지 효율이 높고 이산화탄소 배출량도 삭감할 수 있기 때문에 전기로 기술의 채용이 진행되고 있어 고품질 흑연 전극 수요는 계속 확대되고 있습니다. 업계의 역학은 정화 기술의 발전, 성능 향상에 대한 주목을 끌고, 전통적 및 신흥 응용 분야 모두에서 산업 요구 사항의 진화에 의해 형성됩니다.
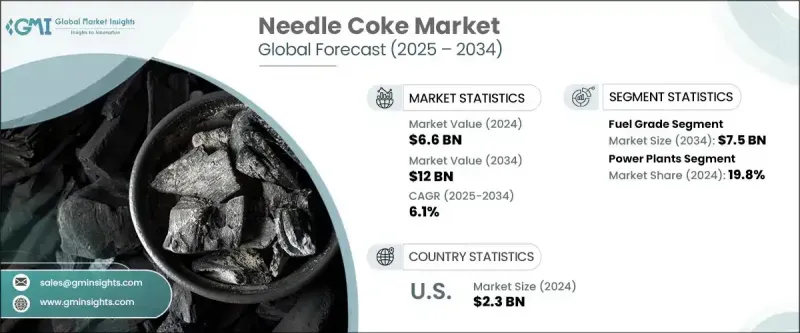
석유 코크스의 등급에 따라 시장은 연료용과 탈탄산용으로 나뉩니다. 연료 부문은 2034년까지 75억 달러 이상에 달할 것으로 예상되며 기간 중 CAGR은 6%로 예상됩니다. 이 분야의 개발은 세계 에너지 수요 동향, 정유소 조업 동향, 환경 규제 강화의 영향을 받고 있습니다. 연소효율 향상과 배출가스 억제를 목적으로 하는 새로운 기술 혁신에 의해 조달 선호의 형태가 바뀌기 시작하고 있으며, 많은 산업들이 보다 엄격한 환경기준을 준수하면서 연료 코크스의 이점을 극대화하는 솔루션을 요구하고 있습니다. 이러한 이유로 생산자는 성능과 컴플라이언스 목표를 모두 달성하기 위해 첨단 기술을 제조 공정에 통합 할 수있는 기회가 탄생했습니다.
| 시장 범위 | |
|---|---|
| 시작 연도 | 2024년 |
| 예측 연도 | 2025-2034년 |
| 시작 금액 | 66억 달러 |
| 예측 금액 | 120억 달러 |
| CAGR | 6.1% |
용도별로 보면 니들 코크스 산업은 발전소, 시멘트 제조, 철강 생산, 알루미늄 가공, 기타 산업용도로 나눌 수 있습니다. 현재 발전소 분야가 가장 큰 점유율을 차지하고 있으며, 2024년에는 시장의 19.8%를 차지했고, 2034년까지 CAGR은 6.1%로 확대될 것으로 예측되고 있습니다. 발전에서 니들 코크스의 사용은 세계 에너지 인프라가 보다 효율적이고 지속 가능한 솔루션으로 전환함에 따라 특히 고온 및 고급 에너지 저장 시스템에서 기세가 증가하고 있습니다. 이러한 개발은 에너지 정책의 변화, 산업 시스템의 현대화, 재료 성능의 기술적 진보와 밀접한 관련이 있습니다.
지역별로는 북미가 여전히 돌출한 시장이며 미국이 압도적인 지위를 차지하고 있습니다. 2024년에는 미국이 지역별 점유율의 약 94%를 차지하여 23억 달러의 매출을 기록했습니다. 이 지역 시장 확대는 산업의 업그레이드, 지속가능성 대책의 구현, 혁신적인 에너지 기술의 채택에 의해 지원됩니다. 수입 의존도 감소와 청정 에너지 시스템 도입 촉진을 목표로 한 정책 이니셔티브는 시장 전망을 더욱 밝게 만들고 있습니다. 견조한 내수와 목표로 삼은 산업 정책의 조합은 미래 성장을 위한 강력한 기반을 확립했습니다.
니들 코크스 시장에서 사업을 전개하는 기업은 그 지위를 강화하기 위해 여러 전략을 추구하고 있습니다. 지속가능한 정화와 전극 및 배터리 등급 용도를 위해 제품의 순도, 밀도 및 성능을 향상시키는 첨단 가공 기술에 중점을 둔 R&D에 많은 투자가 이루어지고 있습니다. 다운스트림 제조업체와의 제휴 및 합작사업을 포함한 전략적 제휴는 장기적으로 안정적인 수요를 확보하고 공동으로 제품 혁신을 가능하게 하기 위해 이루어지고 있습니다. 게다가 새로운 생산 시설과 유통망을 통한 고성장 신흥 시장 진출은 세계적인 존재를 다양화하고 미개척 수요 잠재력을 개척하려는 공급업체에게 중요한 우선순위가 되고 있습니다.
이러한 기술의 진보, 규제 적응, 업계의 전략적 협력의 조합이 경쟁 환경을 재구성하고 있습니다. 시장의 성장 궤도는 철강 부문 수요 증가뿐만 아니라 여러 산업에 걸쳐 다양한 고성능 응용 분야에서 니들 코크스의 역할 확대를 반영합니다.
목차
제1장 조사 방법과 범위
제2장 주요 요약
제3장 업계 인사이트
- 생태계 분석
- 규제 상황
- 제조기술 분석
- 지연 코킹 프로세스의 진보
- 공탄화 기술
- 대체 원료 개발
- 품질 향상 기술
- 새로운 생산 방법론
- 업계에 미치는 영향요인
- 성장 촉진요인
- 업계의 잠재적 위험 및 과제
- 수출입 무역 분석
- 가격 동향 분석
- 등급별
- 지역별
- 성장 가능성 분석
- Porter's Five Forces 분석
- PESTLE 분석
제4장 경쟁 구도
- 소개
- 기업의 시장 점유율 분석
- 북미
- 유럽
- 아시아태평양
- 중동 및 아프리카
- 라틴아메리카
- 전략 대시보드
- 전략적 노력
- 경쟁 벤치마킹
- 혁신과 기술의 상황
제5장 시장 규모와 예측 : 등급별, 2021-2034년
- 주요 동향
- 연료 등급
- 소성 페트콕
제6장 시장 규모와 예측 : 용도별, 2021-2034년
- 주요 동향
- 발전소
- 시멘트 산업
- 철강 업계
- 알루미늄 산업
- 기타
제7장 시장 규모와 예측 : 지역별, 2021-2034년
- 주요 동향
- 북미
- 미국
- 캐나다
- 유럽
- 스페인
- 영국
- 이탈리아
- 프랑스
- 독일
- 아시아태평양
- 중국
- 인도
- 일본
- 호주
- 중동 및 아프리카
- 튀니지
- 튀르키예
- 모로코
- 라틴아메리카
- 브라질
- 아르헨티나
- 칠레
- 멕시코
제8장 기업 프로파일
- AMINCO RESOURCES
- Bharat Petroleum Corporation Limited
- BP plc
- Cenovus Inc
- Chevron Corporation
- Cocan graphite
- Exxon Mobil Corporation
- Fangda Carbon New Materials Technology Co., Ltd.
- GrafTech International
- Graphite India Limited
- Indian Oil Corporation
- Marathon Petroleum Corporation
- Mitsubishi Chemical Group Corporation
- Oxbow Corporation
- Reliance Industries Limited
- Rain Carbon Inc.
- Saudi Arabian Oil Company(Saudi Aramco)
- Shamokin Carbons
- Shell Plc
- Valero
The Global Needle Coke Market was valued at USD 6.6 billion in 2024 and is estimated to grow at a CAGR of 6.1% to reach USD 12 billion by 2034. Growth in this sector is strongly influenced by its critical role in manufacturing graphite electrodes for electric arc furnaces, which are widely used in steel production. This premium-grade petroleum coke, known for its acicular structure and low coefficient of thermal expansion, is especially suited for applications where exceptional thermal and electrical conductivity is essential. As the steel industry increasingly adopts electric arc furnace technology due to its energy efficiency and reduced carbon footprint compared to conventional blast furnace methods, the demand for high-quality graphite electrodes continues to expand, thereby driving the market for needle coke. Industry dynamics are also shaped by advances in refining technologies, heightened focus on performance improvements, and evolving industrial requirements in both traditional and emerging applications.

Based on grade, the market is split into fuel-grade and calcinated petroleum coke segments. The fuel-grade category is forecast to exceed USD 7.5 billion by 2034, advancing at a CAGR of 6% over the same period. Developments in this segment are influenced by shifting patterns in global energy demand, operational trends within refineries, and the tightening of environmental regulations. New innovations aimed at improving combustion efficiency and controlling emissions are beginning to reshape procurement preferences, with many industries seeking solutions that maximize the benefits of fuel coke while adhering to stricter environmental standards. This has created opportunities for producers to integrate advanced technologies into manufacturing processes to meet both performance and compliance targets.
| Market Scope | |
|---|---|
| Start Year | 2024 |
| Forecast Year | 2025-2034 |
| Start Value | $6.6 Billion |
| Forecast Value | $12 Billion |
| CAGR | 6.1% |
From an application perspective, the needle coke industry is divided into power plants, cement manufacturing, steel production, aluminum processing, and other industrial uses. The power plant sector currently accounts for the largest share, representing 19.8% of the market in 2024, and is projected to expand at a CAGR of 6.1% through 2034. The use of needle coke in power generation is gaining momentum, particularly in high-temperature and advanced energy storage systems, as global energy infrastructures transition toward more efficient and sustainable solutions. These developments are closely linked to changes in energy policy, the modernization of industrial systems, and technological advancements in material performance.
Regionally, North America remains a prominent market, with the United States holding a dominant position. In 2024, the U.S. accounted for around 94% of the regional share, generating USD 2.3 billion in revenue. Market expansion here is supported by industrial upgrades, the implementation of sustainability measures, and adoption of innovative energy technologies. Policy initiatives aimed at reducing import dependency and accelerating the deployment of clean energy systems have further contributed to the positive market outlook. The combination of robust domestic demand and targeted industry policies has established a strong foundation for future growth.
Companies operating in the needle coke market are pursuing multiple strategies to strengthen their position. Significant investments are being directed toward research and development, with a focus on sustainable refining and advanced processing technologies that enhance product purity, density, and performance for both electrode and battery-grade applications. Strategic alliances, including partnerships and joint ventures with downstream manufacturers, are being formed to secure stable long-term demand and enable collaborative product innovation. Additionally, expansion into high-growth emerging markets through new production facilities and distribution networks is becoming a key priority for suppliers seeking to diversify their global presence and tap into untapped demand potential.
This combination of technological progress, regulatory adaptation, and strategic industry collaboration is reshaping the competitive environment. The market's growth trajectory reflects not only the rising demand from the steel sector but also the expanding role of needle coke in various high-performance applications across multiple industries.
Table of Contents
Chapter 1 Methodology & Scope
- 1.1 Market definitions
- 1.2 Base estimates & calculations
- 1.3 Forecast calculation
- 1.4 Data sources
- 1.4.1 Primary
- 1.4.2 Secondary
- 1.4.2.1 Paid
- 1.4.2.2 Public
Chapter 2 Executive Summary
- 2.1 Industry synopsis, 2021 - 2034
- 2.1.1 Business trends
- 2.1.2 Grade trends
- 2.1.3 Application trends
- 2.1.4 Regional trends
Chapter 3 Industry Insights
- 3.1 Industry ecosystem analysis
- 3.2 Regulatory landscape
- 3.3 Manufacturing technology analysis
- 3.3.1 Delayed coking process advancements
- 3.3.2 Co-carbonization technologies
- 3.3.3 Alternative feedstock development
- 3.3.4 Quality enhancement techniques
- 3.3.5 Emerging production methodologies
- 3.4 Industry impact forces
- 3.4.1 Growth drivers
- 3.4.2 Industry pitfalls & challenges
- 3.5 Import/export trade analysis
- 3.6 Price trend analysis
- 3.6.1 By grade
- 3.6.2 By geography
- 3.7 Growth potential analysis
- 3.8 Porter's analysis
- 3.8.1 Bargaining power of suppliers
- 3.8.2 Bargaining power of buyers
- 3.8.3 Threat of new entrants
- 3.8.4 Threat of substitutes
- 3.9 PESTEL analysis
- 3.9.1 Political factors
- 3.9.2 Economic factors
- 3.9.3 Social factors
- 3.9.4 Technological factors
- 3.9.5 Environmental factors
- 3.9.6 Legal factors
Chapter 4 Competitive Landscape, 2025
- 4.1 Introduction
- 4.2 Company market share analysis, 2024
- 4.2.1 North America
- 4.2.2 Europe
- 4.2.3 Asia Pacific
- 4.2.4 Middle East & Africa
- 4.2.5 Latin America
- 4.3 Strategy dashboard
- 4.4 Strategic initiative
- 4.5 Competitive benchmarking
- 4.6 Innovation & technology landscape
Chapter 5 Market Size and Forecast, By Grade, 2021 - 2034, (MT and USD Billion)
- 5.1 Key trends
- 5.2 Fuel grade
- 5.3 Calcinated petcoke
Chapter 6 Market Size and Forecast, By Application, 2021 - 2034, (MT and USD Billion)
- 6.1 Key trends
- 6.2 Power plants
- 6.3 Cement industry
- 6.4 Steel industry
- 6.5 Aluminum industry
- 6.6 Others
Chapter 7 Market Size and Forecast, By Region, 2021 - 2034, (MT and USD Billion)
- 7.1 Key trends
- 7.2 North America
- 7.2.1 U.S.
- 7.2.2 Canada
- 7.3 Europe
- 7.3.1 Spain
- 7.3.2 UK
- 7.3.3 Italy
- 7.3.4 France
- 7.3.5 Germany
- 7.4 Asia Pacific
- 7.4.1 China
- 7.4.2 India
- 7.4.3 Japan
- 7.4.4 Australia
- 7.5 Middle East & Africa
- 7.5.1 Tunisia
- 7.5.2 Turkey
- 7.5.3 Morocco
- 7.6 Latin America
- 7.6.1 Brazil
- 7.6.2 Argentina
- 7.6.3 Chile
- 7.6.4 Mexico
Chapter 8 Company Profiles
- 8.1 AMINCO RESOURCES
- 8.2 Bharat Petroleum Corporation Limited
- 8.3 BP plc
- 8.4 Cenovus Inc
- 8.5 Chevron Corporation
- 8.6 Cocan graphite
- 8.7 Exxon Mobil Corporation
- 8.8 Fangda Carbon New Materials Technology Co., Ltd.
- 8.9 GrafTech International
- 8.10 Graphite India Limited
- 8.11 Indian Oil Corporation
- 8.12 Marathon Petroleum Corporation
- 8.13 Mitsubishi Chemical Group Corporation
- 8.14 Oxbow Corporation
- 8.15 Reliance Industries Limited
- 8.16 Rain Carbon Inc.
- 8.17 Saudi Arabian Oil Company (Saudi Aramco)
- 8.18 Shamokin Carbons
- 8.19 Shell Plc
- 8.20 Valero

