
|
시장보고서
상품코드
1858887
모터바이크 택시 시장 : 시장 기회, 성장 촉진요인, 산업 동향 분석, 예측(2025-2034년)Motorbike Taxi Market Opportunity, Growth Drivers, Industry Trend Analysis, and Forecast 2025 - 2034 |
||||||
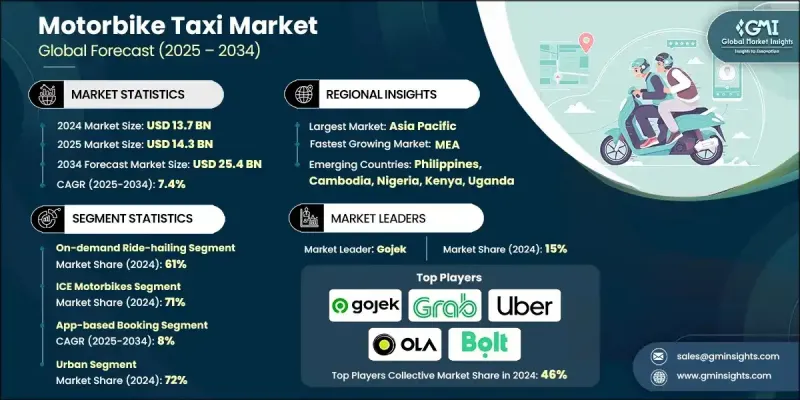
세계의 모터바이크 택시 시장 규모는 2024년에 137억 달러로 평가되었고, CAGR 7.4%로 성장할 전망이며, 2034년에는 254억 달러에 이를 것으로 예측됩니다.

도시 지역의 혼잡 격화, 연료비 상승, 보다 빠른 통근 수단에 대한 수요가 모터바이크 택시 서비스로의 이동을 가속화하고 있습니다. 이러한 이륜차 택시는 인프라가 임박한 도시에서 기존의 교통 수단을 대체할 수 있는 신뢰할 수 있는 옵션이 되고 있으며, 도어 투 도어의 신속한 이동을 가능하게 하고 있습니다. 사업자는 현재 라이더와 운전자를 효율적으로 매칭하고 요금의 투명성 및 안전성 향상을 보장하기 위해 디지털 플랫폼에 크게 의존하고 있습니다. 스마트폰의 이용과 인터넷의 보급이 진행되고, 앱 기반 예약과 디지털 결제가 표준이 되고 있습니다. AI를 탑재한 안전 툴, GPS를 이용한 루트 관리, 실시간 승차 모니터링 등 첨단 기술의 채용도 증가하고 있습니다. 플릿 소유자는 전동 자전거 옵션과 맞춤형 라이드 서비스를 제공하는 경우가 많아 환경 친화적이고 사용하기 쉬운 여행을 실현하고 있습니다. 스마트 대시보드, 모듈식 계획 및 성능 추적 도구는 도시와 도시 인근 지역 모두에서 업무를 간소화하고 서비스 품질을 향상시키기 위해 도입되었습니다.
| 시장 범위 | |
|---|---|
| 시작 연도 | 2024년 |
| 예측 연도 | 2025-2034년 |
| 시장 규모 | 137억 달러 |
| 예측 금액 | 254억 달러 |
| CAGR | 7.4% |
2024년 온디맨드 라이드 헤일링 분야는 61%의 점유율을 차지했으며, 2034년까지 연평균 복합 성장률(CAGR) 7%로 성장할 것으로 예측됩니다. 유연성, 즉각적인 가용성, 경쟁력 있는 가격 체계로 혼잡한 도심을 빠르고 저렴한 가격으로 이동하고 싶은 통근객에게 선호되는 옵션이 되고 있습니다. 이 부문의 성장은 앱 사용자 증가 및 모빌리티 플랫폼 존재감의 확대에 의해 강화되고 있습니다.
내연 엔진(ICE) 이륜차 부문은 2024년에 71%의 점유율을 차지했으며, 2025-2034년 연평균 복합 성장률(CAGR) 7.5%로 성장할 것으로 예측됩니다. ICE 이륜차에 대한 선호도는 합리적인 가격, 기존 연료 보급 네트워크, 널리 보급되어 있기 때문에 아시아와 아프리카 등 지역에서 여전히 강합니다. 운영자는 입증된 성능, 쉬운 유지 보수 및 초기 비용이 낮기 때문에 내연 기관차로 기울입니다. 그러나 세계 시장은 규제 프레임워크 변화, 정부 지원, 신흥국 전체의 EV충전 인프라 확대 등을 배경으로 서서히 전동 모델로 이동하고 있습니다.
아시아태평양 시장은 58%의 점유율을 차지하며, 2024년에는 79억 달러를 창출했습니다. 이 지역의 도시 인구 급증, 강력한 모바일 보급, 디지털 플랫폼의 신속한 통합이 주요 성장 요인이 되었습니다. 앱 기반 운송, 마일리지 연결 솔루션, 현금이 없는 경제의 확대가 이 지역에서 이륜차 택시의 인기를 끌고 있습니다. 유연하고 경제적인 기술을 지원하는 이동 수단에 대한 수요가 증가함에 따라 이 지역의 국가는 모터바이크 택시 산업의 중요한 개발 기지가 되고 있습니다.
세계의 모터바이크 택시 시장에서 사업을 전개하는 주요 기업으로는 Rapido, Angkas, Bolt, Safeboda, Uber, InDriver, Ola Bike, JOYRIDE, Gojek, Grab 등이 있습니다. 시장 포지션을 확보하기 위해 주요 모터바이크 택시 서비스 제공 업체는 몇 가지 전략적 접근 방식을 시행하고 있습니다. 실시간 추적, 스마트 가격 알고리즘, 안전 분석에 중점을 두고 사용자 경험을 향상시키는 기술에 적극적으로 투자하고 있습니다. 많은 사업자는 운행 비용을 낮추면서 지속 가능한 목표를 달성하기 위해 차량의 전동화에 조타를 끊고 있습니다. 또한 Fintech 기업과의 제휴를 통해 더욱 부드러운 디지털 결제 통합이 가능합니다. 또한 이러한 기업들은 전략적 파트너십, 규제 조정, 지역 통근 요구에 맞는 맞춤형 제공을 통해 지역 확대를 추진하고 있습니다.
자주 묻는 질문
목차
제1장 조사 방법
- 시장 범위 및 정의
- 조사 디자인
- 조사 접근
- 데이터 수집 방법
- 데이터 마이닝 정보원
- 세계
- 지역 및 국가
- 기본 추정 및 계산
- 기준 연도의 산출
- 시장 추계의 주요 동향
- 1차 조사 및 검증
- 1차 정보
- 예측 모델
- 조사의 전제조건 및 한계
제2장 주요 요약
제3장 업계 인사이트
- 생태계 분석
- 공급자의 상황
- 이익률 분석
- 비용 구조
- 각 단계에서의 부가가치
- 밸류체인에 영향을 주는 요인
- 혁신
- 업계에 미치는 영향요인
- 성장 촉진요인
- 도시화 진전 및 교통 정체
- 스마트폰의 보급 및 앱 기반 플랫폼
- 전동 이륜차의 플릿에 대한 채용
- 합리적인 가격 및 라스트 마일 연결에 대한 주목 증가
- 정부의 대처 및 규제 지원
- 업계의 잠재적 위험 및 과제
- 안전에 대한 우려 및 사고 위험
- 규제 및 법적 불확실성
- 시장 기회
- 신흥국에서의 라이드 헤일링 플랫폼 확대
- 전동 오토바이를 플릿에 통합
- 금융 및 보험업자와의 파트너십
- AI, GPS, 디지털 안전 기능의 채용
- 성장 촉진요인
- 성장 가능성 분석
- 규제 상황
- 수송 서비스의 면허 요건
- 운전면허 및 신원 조사 기준
- 자동차 안전 및 보험 규제
- 디지털 플랫폼 규제 대응
- 국경을 넘은 업무 요건
- Porter's Five Forces 분석
- PESTEL 분석
- 기술 및 혁신의 전망
- 현재의 기술 동향
- 모바일 애플리케이션 플랫폼 개발
- GPS 추적 및 네비게이션 기술
- 디지털 결제 시스템의 통합
- AI를 활용한 매칭 알고리즘
- IoT 및 커넥티드 차량 기술
- 신기술
- AI를 활용한 라이드 매칭 알고리즘
- 블록체인 기반 시스템
- 현재의 기술 동향
- 가격 동향
- 지역별
- 제품별
- 생산 통계
- 생산 거점
- 소비 거점
- 수출입
- 코스트 내역 분석
- 특허 분석
- 지속가능성 및 환경면
- 지속가능한 관행
- 폐기물 감축 전략
- 생산에서의 에너지 효율
- 환경 친화적인 노력
- 탄소발자국
- 환경 내구성 기준
- 안전 및 보안 분석 프레임워크
- 드라이버의 안전 트레이닝 및 인증
- 승객의 안전 대책 및 프로토콜
- 사고 방지 및 긴급 대응
- 여성용 안전 기능 및 남녀별 서비스
- 차량 안전 기준 및 장비 요건
- 보험 및 배상 책임 관리
- 드라이버의 경제 및 수익 분석
- 운전자의 수입 구조 및 미래성
- 수수료 모델 및 수익 분배
- 드라이버의 운전 비용 분석
- 자동차 자금 조달 및 소유 모델
- 드라이버의 정착율 및 만족도 지표
- 고객 경험 및 서비스 품질
- 서비스 품질 지표 및 KPI
- 고객 만족도 및 충성도 분석
- 가격 전략 및 어포더빌리티 평가
- 서비스의 편의성 및 가용성
- 멀티 모달 운송 통합
- 시장 진출 전략의 틀
- 규제 인가 및 라이선싱 프로세스
- 지역 파트너십 및 합작 사업 모델
- 기술의 현지화 요건
- 드라이버의 채용 및 연수 프로그램
- 마케팅 및 브랜드 포지셔닝 전략
- 향후 전망 및 시장 기회
- 전기자동차 통합 및 지속가능성
- 자율주행차의 영향 평가
- 스마트 시티 통합의 기회
- 투자 기회 및 자금 조달 요건
- 비즈니스 모델의 혁신 및 파괴
- 리스크 평가 및 경감 전략
- 장기적 시장 발전 시나리오
제4장 경쟁 구도
- 서문
- 기업의 시장 점유율 분석
- 북미
- 유럽
- 아시아태평양
- 라틴아메리카
- 중동 및 아프리카
- 주요 시장 기업의 경쟁 분석
- 경쟁 포지셔닝 매트릭스
- 전략적 전망 매트릭스
- 주요 발전
- 합병 및 인수
- 파트너십 및 협업
- 신제품 발표
- 확장계획 및 자금조달
제5장 시장 추계 및 예측 : 서비스별(2021-2034년)
- 주요 동향
- 온디맨드 및 라이드 헤일링
- 예약 승차 및 사전 예약 승차
- 딜리버리 통합 서비스
제6장 시장 추계 및 예측 : 차량별(2021-2034년)
- 주요 동향
- ICE 오토바이
- 전동 오토바이
- 기타 경 EV 및 스쿠터
제7장 시장 추계 및 예측 : 예약 모드별(2021-2034년)
- 주요 동향
- 앱 기반 예약
- 오프라인 및 기존 예약
제8장 시장 추계 및 예측 : 지역별(2021-2034년)
- 주요 동향
- 도시
- 준도시 및 도시 주변부
- 농촌
제9장 시장 추계 및 예측 : 비즈니스 모델별(2021-2034년)
- 주요 동향
- 어그리게이터 모델
- 자사 보유 모델
- 하이브리드 모델
제10장 시장 추계 및 예측 : 최종 용도별(2021-2034년)
- 주요 동향
- 매일 통근자
- 오케이조널 유저
- 법인 여행자
- 배달 고객
제11장 시장 추계 및 예측 : 지역별(2021-2034년)
- 주요 동향
- 북미
- 미국
- 캐나다
- 유럽
- 독일
- 영국
- 프랑스
- 이탈리아
- 스페인
- 러시아
- 북유럽 국가
- 포르투갈
- 크로아티아
- 아시아태평양
- 중국
- 인도
- 일본
- 호주
- 한국
- 싱가포르
- 태국
- 인도네시아
- 캄보디아
- 필리핀
- 라틴아메리카
- 브라질
- 멕시코
- 아르헨티나
- 중동 및 아프리카
- 남아프리카
- 사우디아라비아
- 아랍에미리트(UAE)
- 나이지리아
- 케냐
- 우간다
제12장 기업 프로파일
- 세계 기업
- Gojek
- Grab
- Uber
- Bolt
- 지역 기업
- Angkas
- InDriver
- JOYRIDE
- Ola Bike
- Rapido
- PickMe
- 신흥 기업
- HERE
- MAX
- 기술 솔루션 제공업체
- Safeboda
- Twilio
The Global Motorbike Taxi Market was valued at USD 13.7 billion in 2024 and is estimated to grow at a CAGR of 7.4% to reach USD 25.4 billion by 2034.
Growing urban congestion, increasing fuel costs, and a demand for faster commute options are accelerating the shift toward motorbike taxi services. These two-wheeler taxis are becoming a reliable alternative to traditional transport in cities with strained infrastructure, enabling faster door-to-door mobility. Operators now rely heavily on digital platforms to match riders and drivers efficiently, ensuring pricing transparency and improved safety. With rising smartphone use and internet penetration, app-based bookings and digital payments have become standard. Advanced technology adoption is also on the rise, featuring AI-powered safety tools, GPS-based route management, and real-time ride monitoring. Fleet owners are increasingly offering electric bike options and customizable ride services, making travel eco-friendlier and more accessible. Smart dashboards, modular plans, and performance tracking tools are also being implemented to streamline operations and boost service quality in both urban and peri-urban zones.
| Market Scope | |
|---|---|
| Start Year | 2024 |
| Forecast Year | 2025-2034 |
| Start Value | $13.7 Billion |
| Forecast Value | $25.4 Billion |
| CAGR | 7.4% |
In 2024, the on-demand ride-hailing segment held a 61% share and is set to grow at a CAGR of 7% through 2034. Its flexibility, instant availability, and competitive pricing structure make it the preferred option for commuters seeking fast and affordable rides across busy urban centers. The segment's growth is reinforced by the rising number of app users and the expanding presence of mobility platforms.
The internal combustion engine (ICE) motorbikes segment has a 71% share in 2024 and is projected to grow at a CAGR of 7.5% between 2025 and 2034. The preference for ICE motorbikes remains strong in regions like Asia and Africa due to their affordability, existing refueling networks, and widespread availability. Operators lean toward ICE vehicles for their proven performance, easy maintenance, and low initial costs. However, the global market is gradually shifting toward electric models, driven by changing regulatory frameworks, government support, and the expansion of EV charging infrastructure across emerging economies.
Asia Pacific Motorbike Taxi Market held a 58% share, generating USD 7.9 billion in 2024. The region's booming urban population, strong mobile adoption, and fast integration of digital platforms are key growth enablers. App-based transport, last-mile connectivity solutions, and expanding cashless economies have propelled the popularity of two-wheeler taxis in the region. As demand rises for flexible, affordable, and tech-enabled mobility options, countries across the region are becoming key development hubs for the motorbike taxi industry.
Key companies operating in the Global Motorbike Taxi Market include Rapido, Angkas, Bolt, Safeboda, Uber, InDriver, Ola Bike, JOYRIDE, Gojek, and Grab. To secure their market position, leading motorbike taxi service providers are implementing several strategic approaches. Businesses are aggressively investing in technology to enhance user experience, focusing on real-time tracking, smart pricing algorithms, and safety analytics. Many players are pivoting toward fleet electrification to meet sustainability targets while lowering operational costs. Collaborations with fintech companies are also enabling smoother digital payment integrations. Additionally, these firms are expanding regionally through strategic partnerships, regulatory alignment, and customized offerings to match local commuting needs.
Table of Contents
Chapter 1 Methodology
- 1.1 Market scope and definition
- 1.2 Research design
- 1.2.1 Research approach
- 1.2.2 Data collection methods
- 1.3 Data mining sources
- 1.3.1 Global
- 1.3.2 Regional/Country
- 1.4 Base estimates and calculations
- 1.4.1 Base year calculation
- 1.4.2 Key trends for market estimation
- 1.5 Primary research and validation
- 1.5.1 Primary sources
- 1.6 Forecast model
- 1.7 Research assumptions and limitations
Chapter 2 Executive Summary
- 2.1 Industry 3600 synopsis, 2021 - 2034
- 2.2 Key market trends
- 2.2.1 Regional
- 2.2.2 Services
- 2.2.3 Vehicles
- 2.2.4 Booking Mode
- 2.2.5 Area of Operation
- 2.2.6 Business Model
- 2.2.7 End Use
- 2.3 TAM Analysis, 2025-2034
- 2.4 CXO perspectives: Strategic imperatives
- 2.4.1 Executive decision points
- 2.4.2 Critical success factors
- 2.5 Future outlook and strategic recommendations
Chapter 3 Industry Insights
- 3.1 Industry ecosystem analysis
- 3.1.1 Supplier landscape
- 3.1.2 Profit margin analysis
- 3.1.3 Cost structure
- 3.1.4 Value addition at each stage
- 3.1.5 Factor affecting the value chain
- 3.1.6 Disruptions
- 3.2 Industry impact forces
- 3.2.1 Growth drivers
- 3.2.1.1 Rising urbanization and traffic congestion
- 3.2.1.2 Growing smartphone penetration and app-based platforms
- 3.2.1.3 Adoption of electric two-wheelers in fleets
- 3.2.1.4 Increasing focus on affordability and last-mile connectivity
- 3.2.1.5 Government initiatives and regulatory support
- 3.2.2 Industry pitfalls and challenges
- 3.2.2.1 Safety concerns and accident risks
- 3.2.2.2 Regulatory and legal uncertainties
- 3.2.3 Market opportunities
- 3.2.3.1 Expansion of ride-hailing platforms in emerging economies
- 3.2.3.2 Integration of electric motorbikes into fleets
- 3.2.3.3 Partnerships with financial and insurance providers
- 3.2.3.4 Adoption of AI, GPS, and digital safety features
- 3.2.1 Growth drivers
- 3.3 Growth potential analysis
- 3.4 Regulatory landscape
- 3.4.1 Transportation service licensing requirements
- 3.4.2 Driver licensing & background check standards
- 3.4.3 Vehicle safety & insurance regulations
- 3.4.4 Digital platform regulatory compliance
- 3.4.5 Cross-border operational requirements
- 3.5 Porter's analysis
- 3.6 PESTEL analysis
- 3.7 Technology and innovation landscape
- 3.7.1 Current technological trends
- 3.7.1.1 Mobile application platform development
- 3.7.1.2 GPS tracking & navigation technology
- 3.7.1.3 Digital payment system integration
- 3.7.1.4 AI-powered matching algorithms
- 3.7.1.5 IoT & connected vehicle technology
- 3.7.2 Emerging technologies
- 3.7.2.1 AI-powered ride-matching algorithms
- 3.7.2.2 Blockchain-based systems
- 3.7.1 Current technological trends
- 3.8 Price trends
- 3.8.1 By region
- 3.8.2 By product
- 3.9 Production statistics
- 3.9.1 Production hubs
- 3.9.2 Consumption hubs
- 3.9.3 Export and import
- 3.10 Cost breakdown analysis
- 3.11 Patent analysis
- 3.12 Sustainability and environmental aspects
- 3.12.1 Sustainable practices
- 3.12.2 Waste reduction strategies
- 3.12.3 Energy efficiency in production
- 3.12.4 Eco-friendly Initiatives
- 3.12.5 Carbon footprint considerations
- 3.12.6 Environmental durability standards
- 3.13 Safety & Security Analysis Framework
- 3.13.1 Driver safety training & certification
- 3.13.2 Passenger safety measures & protocols
- 3.13.3 Accident prevention & emergency response
- 3.13.4 Women's safety features & gender-specific services
- 3.13.5 Vehicle safety standards & equipment requirements
- 3.13.6 Insurance coverage & liability management
- 3.14 Driver economics & earnings analysis
- 3.14.1 Driver income structure & earning potential
- 3.14.2 Commission models & revenue sharing
- 3.14.3 Operating cost analysis for drivers
- 3.14.4 Vehicle financing & ownership models
- 3.14.5 Driver retention & satisfaction metrics
- 3.15 Customer experience & service quality
- 3.15.1 Service quality metrics & KPIs
- 3.15.2 Customer satisfaction & loyalty analysis
- 3.15.3 Pricing strategy & affordability assessment
- 3.15.4 Service accessibility & availability
- 3.15.5 Multi-modal transportation integration
- 3.16 Market entry strategy framework
- 3.16.1 Regulatory approval & licensing process
- 3.16.2 Local partnership & joint venture models
- 3.16.3 Technology localization requirements
- 3.16.4 Driver recruitment & training programs
- 3.16.5 Marketing & brand positioning strategies
- 3.17 Future outlook & market opportunities
- 3.17.1 Electric vehicle integration & sustainability
- 3.17.2 Autonomous vehicle impact assessment
- 3.17.3 Smart city integration opportunities
- 3.17.4 Investment opportunities & funding requirements
- 3.17.5 Business model innovation & disruption
- 3.17.6 Risk assessment & mitigation strategies
- 3.17.7 Long-term market evolution scenarios
Chapter 4 Competitive Landscape, 2024
- 4.1 Introduction
- 4.2 Company market share analysis
- 4.2.1 North America
- 4.2.2 Europe
- 4.2.3 Asia Pacific
- 4.2.4 LATAM
- 4.2.5 MEA
- 4.3 Competitive analysis of major market players
- 4.4 Competitive positioning matrix
- 4.5 Strategic outlook matrix
- 4.6 Key developments
- 4.6.1 Mergers & acquisitions
- 4.6.2 Partnerships & collaborations
- 4.6.3 New Product Launches
- 4.6.4 Expansion Plans and funding
Chapter 5 Market Estimates & Forecast, By Service, 2021 - 2034 ($Mn, Units)
- 5.1 Key trends
- 5.2 On-demand ride-hailing
- 5.3 Scheduled/pre-booked rides
- 5.4 Delivery-integrated services
Chapter 6 Market Estimates & Forecast, By Vehicle, 2021 - 2034 ($Mn, Units)
- 6.1 Key trends
- 6.2 ICE motorbikes
- 6.3 Electric motorbikes
- 6.4 Other light EVs / scooters
Chapter 7 Market Estimates & Forecast, By Booking Mode, 2021 - 2034 ($Mn, Units)
- 7.1 Key trends
- 7.2 App-based booking
- 7.3 Offline/traditional booking
Chapter 8 Market Estimates & Forecast, By Area of Operation, 2021 - 2034 ($Mn, Units)
- 8.1 Key trends
- 8.2 Urban
- 8.3 Semi-urban / peri-urban
- 8.4 Rural
Chapter 9 Market Estimates & Forecast, By Business Model, 2021 - 2034 ($Mn, Units)
- 9.1 Key trends
- 9.2 Aggregator model
- 9.3 Owned fleet model
- 9.4 Hybrid model
Chapter 10 Market Estimates & Forecast, By End Use, 2021 - 2034 ($Mn, Units)
- 10.1 Key trends
- 10.2 Daily commuters
- 10.3 Occasional users
- 10.4 Corporate travelers
- 10.5 Delivery clients
Chapter 11 Market Estimates & Forecast, By Region, 2021 - 2034 ($Mn, Units)
- 11.1 Key trends
- 11.2 North America
- 11.2.1 US
- 11.2.2 Canada
- 11.3 Europe
- 11.3.1 Germany
- 11.3.2 UK
- 11.3.3 France
- 11.3.4 Italy
- 11.3.5 Spain
- 11.3.6 Russia
- 11.3.7 Nordics
- 11.3.8 Portugal
- 11.3.9 Croatia
- 11.4 Asia Pacific
- 11.4.1 China
- 11.4.2 India
- 11.4.3 Japan
- 11.4.4 Australia
- 11.4.5 South Korea
- 11.4.6 Singapore
- 11.4.7 Thailand
- 11.4.8 Indonesia
- 11.4.9 Cambodia
- 11.4.10 Philippines
- 11.5 Latin America
- 11.5.1 Brazil
- 11.5.2 Mexico
- 11.5.3 Argentina
- 11.6 MEA
- 11.6.1 South Africa
- 11.6.2 Saudi Arabia
- 11.6.3 UAE
- 11.6.4 Nigeria
- 11.6.5 Kenya
- 11.6.6 Uganda
Chapter 12 Company Profiles
- 12.1 Global Players
- 12.1.1 Gojek
- 12.1.2 Grab
- 12.1.3 Uber
- 12.1.4 Bolt
- 12.2 Regional Players
- 12.2.1 Angkas
- 12.2.2 InDriver
- 12.2.3 JOYRIDE
- 12.2.4 Ola Bike
- 12.2.5 Rapido
- 12.2.6 PickMe
- 12.3 Emerging Players
- 12.3.1 HERE
- 12.3.2 MAX
- 12.4 Technology Solution Providers
- 12.4.1 Safeboda
- 12.4.2 Twilio
