|
시장보고서
상품코드
1892692
전기 버스 시스템 시장 기회, 성장요인, 업계 동향 분석 및 예측(2025-2034년)Electric Bus System Market Opportunity, Growth Drivers, Industry Trend Analysis, and Forecast 2025 - 2034 |
||||||
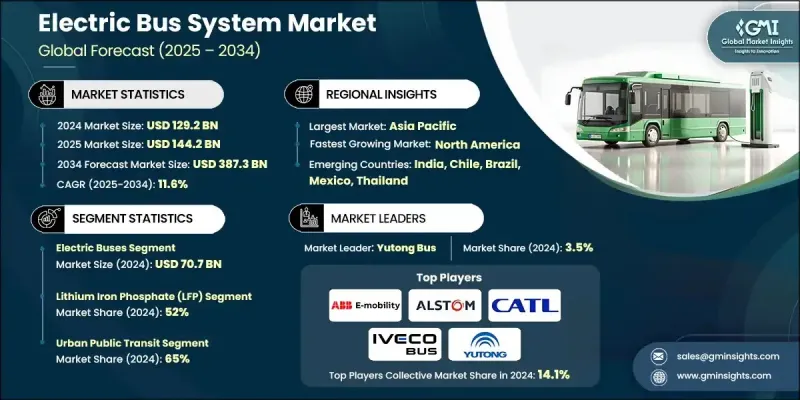
세계의 전기 버스 시스템 시장은 2024년에 1,292억 달러로 평가되었고, 2034년까지 연평균 복합 성장률(CAGR) 11.6%로 성장하여 3,873억 달러에 이를 것으로 예측됩니다.

이러한 시장 성장은 무공해 대중교통을 추진하는 세계 각국의 정부 정책에 의해 주도되고 있습니다. 보조금, 세제 혜택, 보조금 등의 정책으로 지자체와 교통기관은 기존 차량을 전기버스로 교체하는 한편, 필요한 충전 인프라를 확충하고 있습니다. 리튬 이온 배터리의 비용 절감과 에너지 밀도 향상으로 차량 비용이 절감되고 항속거리가 연장됨에 따라 전기버스는 디젤 버스와의 경쟁력을 더욱 효과적으로 높일 수 있게 되었습니다. 전기버스 전용차로, 버스전용차로(BRT), 차고지 인프라 확대 추세는 도시화, 지속가능성 목표, 대기질 개선 정책에 의해 촉진되고 있습니다. 협력적 도입 전략을 통해 교통기관은 환경 목표를 달성하면서 효율성을 극대화할 수 있으며, 시장의 추가 확장을 지원할 수 있습니다.
| 시장 범위 | |
|---|---|
| 개시 연도 | 2024년 |
| 예측 연도 | 2025-2034년 |
| 개시 연도 시장 규모 | 1,292억 달러 |
| 예측 금액 | 3,873억 달러 |
| CAGR | 11.6% |
전기버스 부문은 2024년 707억 달러 시장 규모를 형성했으며, 2025년부터 2034년까지 연평균 9.7%의 성장률을 보일 것으로 전망됩니다. 배터리 전기버스의 보급 확대는 배터리 비용 하락, 항속거리 연장, 정부 인센티브에 의해 추진되고 있습니다. 교통은 급속 충전을 위한 대용량 배터리와 스마트 그리드 시스템과의 통합을 필요로 하는 차량의 전기화에 점점 더 집중하고 있습니다.
리튬 인산철(LFP) 배터리 부문은 2024년 52%의 점유율을 차지했으며, 2025년부터 2034년까지 연평균 복합 성장률(CAGR) 12.7%를 보일 것으로 예측됩니다. LFP 배터리는 긴 수명주기, 열 안정성, 높은 비용 효율성으로 인해 선호되고 있습니다. 아시아 및 유럽을 중심으로 많은 제조업체들이 표준형과 연결형을 포함한 모든 버스 차종에 LFP 배터리를 탑재하고 있습니다. 셀-투-팩(CTP) 구조 등의 기술 혁신으로 에너지 밀도, 안전성, 수명 성능이 향상되어 대규모 대중교통 사업에 적합합니다.
미국 전기버스 시스템 시장은 2034년까지 86%의 점유율로 성장할 것으로 예측됩니다. 초당적 인프라법, 저공해 및 무공해 버스 프로그램과 같은 연방 정부 정책은 차량 전환을 가속화하고 있습니다. 교통 기관이 차량 기지 개조, 직원 교육, 신형 전기 버스에 대한 투자를 진행하면서 미국 제조업체는 "미국산 구매" 조항의 혜택을 받아 배터리, 충전기, 전력 전자제품의 국내 공급망을 강화하고 있습니다.
자주 묻는 질문
목차
제1장 조사 방법
- 시장 범위와 정의
- 조사 설계
- 조사 접근
- 데이터 수집 방법
- 데이터 마이닝 정보원
- 세계
- 지역별/국가별
- 기본 추정치와 계산
- 기준연도 계산
- 시장 추정 주요 동향
- 1차 조사와 검증
- 1차 정보
- 예측
- 조사의 전제조건과 제한 사항
제2장 주요 요약
제3장 업계 인사이트
- 생태계 분석
- 공급업체 상황
- 이익률 분석
- 비용 구조
- 각 단계별 부가가치
- 밸류체인에 영향을 미치는 요인
- 파괴적 변화
- 업계에 대한 영향요인
- 성장 촉진요인
- 업계의 잠재적 리스크&과제
- 시장 기회
- 성장 가능성 분석
- 규제 상황
- Porter's Five Forces 분석
- PESTEL 분석
- 기술과 혁신 동향
- 현행 기술
- 신기술
- 특허 분석
- 가격 분석
- 지역별
- 제품별
- 비용 내역 분석
- 배터리 공급망 취약성 및 광물 조달
- 세계의 배터리 셀 공급 체인 구조
- 중요 광물에의 의존도
- 공급망 혼란 시나리오
- 공급망 리스크 경감 전략
- 물류와 리드타임
- 총 소유비용(TCO) 모델링과 자금조달 메커니즘
- Tco 프레임워크와 조사 방법
- 총 소유비용 비교 : 전기 버스대 디젤/CNG 버스
- 배터리 팩 비용 추이
- 충전 인프라 경제성
- 자금조달 메커니즘과 자본 구성
- 충전 인프라 도입 경제성과 상호운용성
- 충전 전략별 인프라 투자 요건
- 계통 연계 및 전력회사 비용
- 충전 상호운용성 과제
- 스마트 충전과 부하 관리 경제성
- 충전 네트워크 비즈니스 모델
- 배터리 열화, 보증 관리 및 수명주기 경제성
- 실세계의 열화 데이터와 성능
- 배터리 보증 구조와 조건
- 배터리 교환 경제성
- 고객 도입 장벽과 조달 모델 혁신
- 기술적 도입 장벽
- 경제적 도입 장벽
- 조직적/운영상 장벽
- 인프라 및 전력계통상 장벽
- 장벽을 극복하기 위한 조달 모델 혁신
- 리스크 경감 전략
제4장 경쟁 구도
- 서론
- 기업의 시장 점유율 분석
- 북미
- 유럽
- 아시아태평양
- 라틴아메리카
- 중동 및 아프리카
- 주요 시장 기업의 경쟁 분석
- 경쟁 포지셔닝 매트릭스
- 전략적 전망 매트릭스
- 주요 뉴스와 이니셔티브
- 인수합병(M&A)
- 제휴 및 협업
- 신제품 발매
- 사업 확대 계획과 자금조달
제5장 시장 추산 및 예측 : 컴포넌트별, 2021-2034
- 주요 동향
- 전기 버스
- 배터리 전기 버스(BEB)
- 플러그인 하이브리드 전기 버스(PHEV)
- 연료전지 전기 버스(FCEB)
- 트롤리 버스
- 충전 방식
- 창고 충전
- 기회 충전
- 팬터그래프 충전
- 에너지 공급과 계통 연계
- 플릿 및 운영 관리
- 유지보수 및 지원 시스템
제6장 시장 추산 및 예측 : 배터리 화학별, 2021-2034
- 주요 동향
- 인산 철 리튬(LFP)
- 니켈 망간 코발트(NMC)
- 니켈 코발트 알루미늄(NCA)
- 티타늄산 리튬(LTO)
- 고체 배터리
- 기타
제7장 시장 추산 및 예측 : 용도별, 2021-2034
- 주요 동향
- 도시 대중교통
- 도시간/지역간 운송
- 캠퍼스 및 공항 셔틀 버스
- 법인 및 산업용 셔틀
- 기타
제8장 시장 추산 및 예측 : 지역별, 2021-2034
- 주요 동향
- 북미
- 미국
- 캐나다
- 유럽
- 독일
- 영국
- 프랑스
- 이탈리아
- 스페인
- 북유럽 국가
- 네덜란드
- 러시아
- 아시아태평양
- 중국
- 인도
- 일본
- ANZ
- 싱가포르
- 태국
- 베트남
- 한국
- 라틴아메리카
- 브라질
- 멕시코
- 아르헨티나
- 중동 및 아프리카
- 남아프리카공화국
- 사우디아라비아
- 아랍에미리트(UAE)
제9장 기업 개요
- 세계 기업
- ABB E-Mobility
- Alstom
- BYD Company
- CATL(Contemporary Amperex Technology)
- Daimler Buses(Mercedes-Benz/Thomas Built Buses)
- IVECO Bus
- NFI Group(New Flyer Industries)
- Proterra
- Scania(TRATON)
- Siemens Smart Infrastructure
- Volvo Buses(Volvo)
- Yutong Bus
- 지역 제조업체
- Blue Bird
- Gillig
- Karsan
- King Long United Automotive Industry
- Lion Electric Company
- Motor Coach Industries(MCI)
- Solaris Bus &Coach
- Tata Motors
- VDL Bus &Coach
- Zhongtong Bus
- 신규 기업 및 디스럽터
- Arrival
- CaetanoBus
- Ebusco
- Forsee Power
- GreenPower Motor Company
- Lightning eMotors
- Microvast
- Phoenix Motor
- RIDE
- Vicinity Motor
The Global Electric Bus System Market was valued at USD 129.2 billion in 2024 and is estimated to grow at a CAGR of 11.6% to reach USD 387.3 billion by 2034.
The market growth is driven by global government initiatives promoting zero-emission public transit. Policies such as grants, tax incentives, and subsidies are encouraging local governments and transit agencies to upgrade their existing fleets to electric buses while expanding the necessary charging infrastructure. Falling lithium-ion battery costs and improved energy density are reducing vehicle expenses and increasing operational range, allowing electric buses to compete more effectively with diesel alternatives. The growing trend toward electrified bus corridors, bus rapid transit (BRT) systems, and depot infrastructure is fueled by urbanization, sustainability goals, and air quality initiatives. Coordinated deployment strategies help transit authorities maximize efficiency while meeting environmental targets, further supporting market expansion.
| Market Scope | |
|---|---|
| Start Year | 2024 |
| Forecast Year | 2025-2034 |
| Start Value | $129.2 Billion |
| Forecast Value | $387.3 Billion |
| CAGR | 11.6% |
The electric buses segment generated USD 70.7 billion in 2024 and is expected to grow at a CAGR of 9.7% from 2025 to 2034. The widespread adoption of battery-electric buses is being driven by declining battery costs, extended driving ranges, and government incentives. Transit agencies are increasingly focusing on fleet electrification, which necessitates higher-capacity batteries and integration with smart grid systems for rapid charging.
The lithium iron phosphate (LFP) batteries segment held a 52% share in 2024 and is projected to grow at a CAGR of 12.7% from 2025 to 2034. LFP batteries are favored for their long lifecycle, thermal stability, and cost efficiency. Many manufacturers, especially in Asia and Europe, are equipping all bus types, including standard and articulated models, with LFP batteries. Innovations such as cell-to-pack (CTP) structures enhance energy density, safety, and lifecycle performance, making them ideal for large-scale transit operations.
U.S. Electric Bus System Market will grow at an 86% share by 2034. Federal programs, including the Bipartisan Infrastructure Law and Low-No Emission Bus Program, are accelerating fleet transitions. As transit agencies invest in depot upgrades, workforce training, and new electric buses, U.S. manufacturers benefit from the "Buy America" provisions, strengthening domestic supply chains for batteries, chargers, and power electronics.
Key players in the Global Electric Bus System Market include ABB E-Mobility, Alstom, CATL, Forsee Power, IVECO Bus, NFI, RIDE, Siemens Smart Infrastructure, Solaris Bus & Coach, and Yutong Bus. Companies in the Global Electric Bus System Market are employing several strategies to reinforce their market position. They are investing heavily in R&D to enhance battery efficiency, increase vehicle range, and integrate smart charging solutions. Strategic partnerships with local transit authorities and global suppliers enable faster deployment of electric fleets and infrastructure. Manufacturers are focusing on modular and scalable designs to accommodate various city sizes and route requirements. Expansion into emerging markets and establishing regional production facilities reduces costs and improves delivery timelines. Companies are also leveraging government incentives and aligning with sustainability goals to strengthen brand credibility, while advanced maintenance and service programs ensure long-term operational efficiency and customer retention.
Table of Contents
Chapter 1 Methodology
- 1.1 Market scope and definition
- 1.2 Research design
- 1.2.1 Research approach
- 1.2.2 Data collection methods
- 1.3 Data mining sources
- 1.3.1 Global
- 1.3.2 Regional/Country
- 1.4 Base estimates and calculations
- 1.4.1 Base year calculation
- 1.4.2 Key trends for market estimation
- 1.5 Primary research and validation
- 1.5.1 Primary sources
- 1.6 Forecast
- 1.7 Research assumptions and limitations
Chapter 2 Executive Summary
- 2.1 Industry 360° synopsis, 2021 - 2034
- 2.2 Key market trends
- 2.2.1 Component
- 2.2.2 Battery Chemistry
- 2.2.3 Application
- 2.2.4 Region
- 2.3 TAM Analysis, 2026-2034
- 2.4 CXO perspectives: Strategic imperatives
- 2.4.1 Executive decision points
- 2.4.2 Critical success factors
- 2.5 Future outlook and strategic recommendations
Chapter 3 Industry Insights
- 3.1 Industry ecosystem analysis
- 3.1.1 Supplier landscape
- 3.1.2 Profit margin analysis
- 3.1.3 Cost structure
- 3.1.4 Value addition at each stage
- 3.1.5 Factor affecting the value chain
- 3.1.6 Disruptions
- 3.2 Industry impact forces
- 3.2.1 Growth drivers
- 3.2.1.1 Government fleet electrification mandates
- 3.2.1.2 Falling battery costs & improved energy density
- 3.2.1.3 Expansion of urban transit electrification programs
- 3.2.1.4 Growth of hydrogen infrastructure for fuel cell buses
- 3.2.1.5 OEM & technology innovations
- 3.2.2 Industry pitfalls and challenges
- 3.2.2.1 High upfront vehicle & infrastructure costs
- 3.2.2.2 Grid capacity & infrastructure limitations
- 3.2.3 Market opportunities
- 3.2.3.1 Integration of smart charging & energy management
- 3.2.3.2 Battery second-life & recycling programs
- 3.2.3.3 Expansion into intercity & coach services
- 3.2.3.4 Public-private partnerships & international funding
- 3.2.1 Growth drivers
- 3.3 Growth potential analysis
- 3.4 Regulatory landscape
- 3.4.1 North America
- 3.4.2 Europe
- 3.4.3 Asia Pacific
- 3.4.4 Latin America
- 3.4.5 Middle east and Africa
- 3.5 Porter's analysis
- 3.6 PESTEL analysis
- 3.7 Technology and Innovation landscape
- 3.7.1 Current technology
- 3.7.2 Emerging technology
- 3.8 Patent analysis
- 3.9 Pricing analysis
- 3.9.1 By region
- 3.9.2 By product
- 3.10 Cost breakdown analysis
- 3.11 Battery supply chain vulnerabilities & mineral sourcing
- 3.11.1 Global battery cell supply chain structure
- 3.11.2 Critical mineral dependencies
- 3.11.3 Supply chain disruption scenarios
- 3.11.4 Supply chain mitigation strategies
- 3.11.5 Logistics & lead times
- 3.12 Total cost of ownership (tco) modeling & financing mechanisms
- 3.12.1 Tco framework & methodology
- 3.12.2 Tco comparison: electric vs diesel/cng buses
- 3.12.3 Battery pack cost trajectory
- 3.12.4 Charging infrastructure economics
- 3.12.5 Financing mechanisms & capital structures
- 3.13 Charging infrastructure deployment economics & interoperability
- 3.13.1 Infrastructure investment requirements by charging strategy
- 3.13.2 Grid connection & utility costs
- 3.13.3 Charging interoperability challenges
- 3.13.4 Smart charging & load management economics
- 3.13.5 Charging network business models
- 3.14 Battery degradation, warranty management & lifecycle economics
- 3.14.1 Real-world degradation data & performance
- 3.14.2 Battery warranty structures & terms
- 3.14.3 Battery replacement economics
- 3.15 Customer adoption barriers & procurement model innovation
- 3.15.1 Technical adoption barriers
- 3.15.2 Economic adoption barriers
- 3.15.3 Organizational & operational barriers
- 3.15.4 Infrastructure & grid barriers
- 3.15.5 Procurement model innovations to overcome barriers
- 3.15.6 Risk mitigation strategies
Chapter 4 Competitive Landscape, 2024
- 4.1 Introduction
- 4.2 Company market share analysis
- 4.2.1 North America
- 4.2.2 Europe
- 4.2.3 Asia Pacific
- 4.2.4 LATAM
- 4.2.5 MEA
- 4.3 Competitive analysis of major market players
- 4.4 Competitive positioning matrix
- 4.5 Strategic outlook matrix
- 4.6 Key news and initiatives
- 4.6.1 Mergers & acquisitions
- 4.6.2 Partnerships & collaborations
- 4.6.3 New Product Launches
- 4.6.4 Expansion Plans and funding
Chapter 5 Market Estimates & Forecast, By Component, 2021 - 2034 ($Bn, Units)
- 5.1 Key trends
- 5.2 Electric Buses
- 5.2.1 Battery Electric Buses (BEBs)
- 5.2.2 Plug-in Hybrid Electric Buses (PHEVs)
- 5.2.3 Fuel Cell Electric Buses (FCEBs)
- 5.2.4 Trolleybuses
- 5.3 Charging Method
- 5.3.1 Depot Charging
- 5.3.2 Opportunity Charging
- 5.3.3 Pantograph Charging
- 5.4 Energy Supply & Grid Integration
- 5.5 Fleet & Operations Management
- 5.6 Maintenance & Support System
Chapter 6 Market Estimates & Forecast, By Battery Chemistry, 2021 - 2034 ($Bn, Units)
- 6.1 Key trends
- 6.2 Lithium Iron Phosphate (LFP)
- 6.3 Nickel Manganese Cobalt (NMC)
- 6.4 Nickel Cobalt Aluminum (NCA)
- 6.5 Lithium Titanate (LTO)
- 6.6 Solid-State Batteries
- 6.7 Others
Chapter 7 Market Estimates & Forecast, By Application, 2021 - 2034 ($Bn, Units)
- 7.1 Key trends
- 7.2 Urban Public Transit
- 7.3 Intercity & Regional Transport
- 7.4 Campus & Airport Shuttles
- 7.5 Corporate & Industrial Shuttles
- 7.6 Others
Chapter 8 Market Estimates & Forecast, By Region, 2021 - 2034 ($Bn, Units)
- 8.1 Key trends
- 8.2 North America
- 8.2.1 US
- 8.2.2 Canada
- 8.3 Europe
- 8.3.1 Germany
- 8.3.2 UK
- 8.3.3 France
- 8.3.4 Italy
- 8.3.5 Spain
- 8.3.6 Nordics
- 8.3.7 Netherlands
- 8.3.8 Russia
- 8.4 Asia Pacific
- 8.4.1 China
- 8.4.2 India
- 8.4.3 Japan
- 8.4.4 ANZ
- 8.4.5 Singapore
- 8.4.6 Thailand
- 8.4.7 Vietnam
- 8.4.8 South Korea
- 8.5 Latin America
- 8.5.1 Brazil
- 8.5.2 Mexico
- 8.5.3 Argentina
- 8.6 MEA
- 8.6.1 South Africa
- 8.6.2 Saudi Arabia
- 8.6.3 UAE
Chapter 9 Company Profiles
- 9.1 Global Players
- 9.1.1 ABB E-Mobility
- 9.1.2 Alstom
- 9.1.3 BYD Company
- 9.1.4 CATL (Contemporary Amperex Technology)
- 9.1.5 Daimler Buses (Mercedes-Benz / Thomas Built Buses)
- 9.1.6 IVECO Bus
- 9.1.7 NFI Group (New Flyer Industries)
- 9.1.8 Proterra
- 9.1.9 Scania (TRATON)
- 9.1.10 Siemens Smart Infrastructure
- 9.1.11 Volvo Buses (Volvo)
- 9.1.12 Yutong Bus
- 9.2 Regional Players
- 9.2.1 Blue Bird
- 9.2.2 Gillig
- 9.2.3 Karsan
- 9.2.4 King Long United Automotive Industry
- 9.2.5 Lion Electric Company
- 9.2.6 Motor Coach Industries (MCI)
- 9.2.7 Solaris Bus & Coach
- 9.2.8 Tata Motors
- 9.2.9 VDL Bus & Coach
- 9.2.10 Zhongtong Bus
- 9.3 Emerging players and disruptors
- 9.3.1 Arrival
- 9.3.2 CaetanoBus
- 9.3.3 Ebusco
- 9.3.4 Forsee Power
- 9.3.5 GreenPower Motor Company
- 9.3.6 Lightning eMotors
- 9.3.7 Microvast
- 9.3.8 Phoenix Motor
- 9.3.9 RIDE
- 9.3.10 Vicinity Motor