
|
시장보고서
상품코드
1928929
저속 차량 시장 기회, 성장요인, 업계 동향 분석 및 예측(2026-2035년)Low Speed Vehicle Market Opportunity, Growth Drivers, Industry Trend Analysis, and Forecast 2026 - 2035 |
||||||
세계의 저속 차량 시장은 2025년에 104억 달러로 평가되었고, 2035년까지 연평균 복합 성장률(CAGR) 7.8%로 성장하여 218억 달러에 이를 것으로 예측됩니다.

세계적으로 도시화가 진행됨에 따라 교통체증, 대기오염, 소음 문제가 심각해지면서 지속 가능하고 효율적인 대체 교통수단에 대한 수요가 급증하고 있습니다. 저속 차량(LSV)은 인구 밀집 도시 지역, 게이트가 있는 커뮤니티, 리조트, 캠퍼스, 산업 시설에서 단거리 이동을 위한 실용적인 솔루션으로 부상하고 있습니다. 전기 또는 대체 연료로 구동되는 이들 차량은 배출가스가 매우 적어 대기 정화 및 환경 부하 감소에 기여합니다. 컴팩트한 디자인과 속도 제한으로 혼잡한 환경에서도 안전하고 기동성이 뛰어납니다. EV 배터리 기술의 발전(고에너지 밀도화, 급속 충전, 장수명화 등)으로 LSV의 효율성과 매력이 크게 향상되었습니다. 이러한 개선으로 운영 비용이 절감되고 성능이 향상됨에 따라 개인 이동수단, 상업 물류, 산업 분야에서 LSV에 대한 수요가 증가하고 있습니다. 코로나19 팬데믹이 시장에 미치는 복잡한 영향,저배출 및 비용 효율적인 운송 솔루션에 대한 수요는 전 세계적으로 계속 확대되고 있습니다.
| 시장 범위 | |
|---|---|
| 개시 연도 | 2025년 |
| 예측 연도 | 2026-2035년 |
| 개시 연도 가치 | 104억 달러 |
| 예측 금액 | 218억 달러 |
| CAGR | 7.8% |
산업용 유틸리티 차량 부문은 2025년 43%의 점유율을 차지할 것으로 예상되며, 2026년부터 2035년까지 연평균 복합 성장률(CAGR) 8.9%로 성장할 것으로 전망됩니다. 산업용 저속차량(LSV)은 견고한 설계, 긴 작동 주기, 1,500-2,500파운드의 적재 능력으로 인해 제조, 건설, 물류 및 기타 상업적 용도에 필수적인 역할을 합니다.
내연기관(ICE) 차량 부문은 2025년 61%의 점유율을 차지할 것으로 예상되며, 2035년까지 연평균 복합 성장률(CAGR) 7.1%를 나타낼 것으로 예측됩니다. ICE LSV는 운행 범위의 우위, 급유 용이성, 특정 용도에 대한 적합성 등으로 인해 여전히 중요한 시장 입지를 유지하고 있습니다. 보통 3-10마력의 엔진을 탑재하고 자동변속기 또는 무단변속기(CVT)를 장착합니다.
미국 저속 차량 시장은 2025년 38억 달러 규모에 달했습니다. 수요는 문이 있는 커뮤니티, 레크리에이션 시설, 캠퍼스, 산업 시설의 보급 확대, 특정 공공도로에서의 LSV 주행 허용 규제, 물류 및 자재 운반 업무의 전동화 진전에 의해 주도되고 있습니다.
자주 묻는 질문
목차
제1장 조사 방법과 범위
제2장 주요 요약
제3장 업계 인사이트
- 생태계 분석
- 공급업체 상황
- 원재료 공급업체
- 부품 공급업체
- 제조업체
- 기술 제공 기업
- 유통 채널
- 최종 용도
- 비용 구조
- 이익률
- 각 단계 부가가치
- 수직통합 동향
- 디스럽터(시장 변혁자)
- 공급업체 상황
- 영향요인
- 성장 촉진요인
- 게이트 /관리 구역내 도시 모빌리티
- 관광·호스피탈리티 및 레저 분야 사업 확대
- 전동화 추진과 지속가능성 의무화
- 운영 비용 절감
- 업계의 잠재적 리스크&과제
- 항속거리와 성능 제약
- 도로 액세스 제한과 규제 부정 궁합
- 시장 기회
- 리튬 이온 배터리에 의한 납축전지 대체
- 커넥티드/텔레매틱스 대응 저속 차량 플릿
- 커스터마이즈와 모듈러식 유틸리티 보디
- 주택용 프리미엄·라이프스타일 저속 차량(LSV)
- 성장 촉진요인
- 기술 동향과 혁신·에코시스템
- 현행 기술
- 신기술
- 성장 가능성 분석
- 규제 상황
- 북미
- 미국 NHTSA 저속 차량(LSV) 기준(FMVSS 500)
- 미국 각주 공도 주행 가능한 저속 차량(LSV) 규제
- 캐나다 운송 성 LSV 규제
- 유럽
- EU사륜 경자동차 카테고리 L6e/L7e
- 유엔 유럽 경제 위원회(UNECE) 차량 안전 규제
- EU 배터리 규제
- EU폐차 지침
- 아시아태평양
- 중국 신에너지 차(NEV) 및 저속 차량(LSV) GB규격
- 인도 전기자동차용 CMVR 규칙
- 국토 교통성(MLIT) 마이크로모빌리티 규제
- 라틴아메리카
- 브라질 CONTRAN 기준
- 아르헨티나 IRAM 규격
- 멕시코 NOM 차량 기준
- 중동 및 아프리카
- 사우디아라비아 SASO 규격
- 아랍에미리트(UAE) ESMA 규제
- GSO 전기자동차용 만안 기준
- 남아프리카공화국 SANS 규제
- 북미
- Porter의 Five Forces 분석
- PESTEL 분석
- 가격 동향
- 지역별
- 제품별
- 특허 분석
- 생산 통계
- 생산 거점
- 소비 거점
- 수출과 수입
- 지속가능성과 환경면
- 지속가능한 실천
- 폐기물 감축 전략
- 생산 에너지 효율
- 친환경 이니셔티브
- 탄소발자국에 관한 고려사항
- 차량 아키텍처와 플랫폼 전략
- 섀시 및 스케이트보드 플랫폼
- 모듈러 보디 및 유틸리티 어태치먼트 전략
- 용도 횡단적인 플랫폼 재이용
- OEM 대지역조립 제조업체 동향
- 현지 조립 업자와 브랜드 OEM 제조업체 비교
- 화이트 라벨/자체브랜드 제조
- CKD/SKD 조립 동향
- 플릿 소유 형태와 구매 행동 분석
- 플릿 구입자대 개인 구입자
- 구입 vs리스 vs관리형 플릿 모델
- 갱신 사이클과 가동률
- 저속 차량 실현 가능성과 도입에 관한 평가
- 총소유 비용(TCO) 벤치마크
- 배터리, 충전 시스템 및 파워트레인 실용성
- 공도 주행 인가와 컴플라이언스 경제성
- 용도 레벨에서의 투자수익률(ROI)과 회수기간
- 인프라 정비 상황과 운영 리스크
- 유통 및 시장 참여 모델
제4장 경쟁 구도
- 서론
- 기업의 시장 점유율 분석
- 북미
- 유럽
- 아시아태평양
- 라틴아메리카
- 중동 및 아프리카
- 경쟁 포지셔닝 매트릭스
- 전략적 전망 매트릭스
- 주요 발전
- 인수합병(M&A)
- 제휴·협력 관계
- 신제품 발매
- 사업 확대 계획과 자금조달
제5장 시장 추산·예측 : 차량별, 2022-2035
- 골프 카트
- 상용 유틸리티 차량
- 산업용 유틸리티 비클
- 퍼스널 모빌리티 차량
제6장 시장 추산·예측 : 추진력별, 2022-2035
- 내연기관(ICE)
- 전기식
제7장 시장 추산·예측 : 출력별, 2022-2035
- >15kW
- 6-15kW
- <15kW
제8장 시장 추산·예측 : 속도 클래스별, 2022-2035
- 시속 15마일 이하
- 15-25마일/시
- 시속 25마일 이상
제9장 시장 추산·예측 : 용도별, 2022-2035
- 골프장
- 호텔·리조트
- 공항
- 산업시설
- 기타
제10장 시장 추산·예측 : 지역별, 2022-2035
- 북미
- 미국
- 캐나다
- 유럽
- 영국
- 독일
- 프랑스
- 이탈리아
- 스페인
- 벨기에
- 네덜란드
- 스웨덴
- 러시아
- 아시아태평양
- 중국
- 인도
- 일본
- 호주
- 싱가포르
- 한국
- 베트남
- 인도네시아
- 라틴아메리카
- 브라질
- 멕시코
- 아르헨티나
- 중동 및 아프리카
- 남아프리카공화국
- 사우디아라비아
- 아랍에미리트(UAE)
제11장 기업 개요
- 세계 기업
- Columbia Vehicle
- Deere &Company
- Garia
- ICON Electric Vehicles
- Kandi Technologies
- KUBOTA
- Polaris GEM
- Star EV
- Textron
- The Toro Company
- Tomberlin
- Yamaha Motor
- 지역 기업
- American Landmaster
- Bradshaw EV
- Moto Electric Vehicles
- Motrec International
- Suzhou Eagle Electric Vehicle Manufacturing
- EVolution Electric Vehicles
- Melex
- Bintelli
- 신규 기업
- Stealth
- Tropos Motors
- Marshell
- Durable EV
- Eco Vehicle brands
The Global Low Speed Vehicle Market was valued at USD 10.4 billion in 2025 and is estimated to grow at a CAGR of 7.8% to reach USD 21.8 billion by 2035.
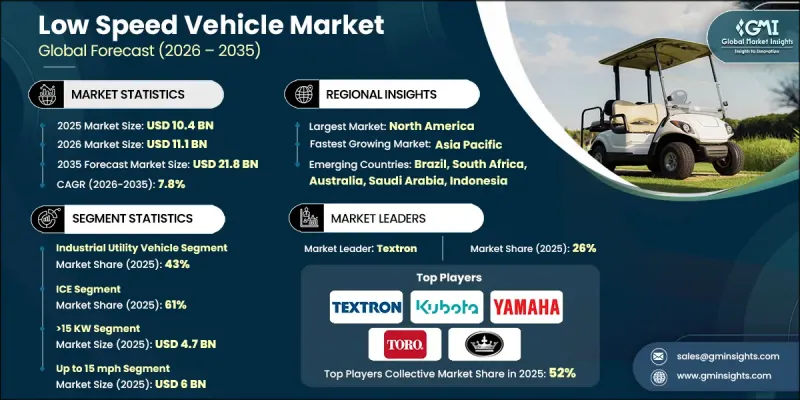
Rising urbanization worldwide is intensifying traffic congestion, air pollution, and noise, creating an urgent demand for sustainable, efficient transportation alternatives. LSVs are emerging as a practical solution for short-distance travel in densely populated urban areas, gated communities, resorts, campuses, and industrial facilities. These vehicles, powered by electricity or alternative fuels, produce minimal emissions, supporting cleaner air and reduced environmental impact. Their compact design and speed limitations make them safe and maneuverable in crowded settings. Advances in EV battery technology, including higher energy density, faster charging, and longer lifecycle, have significantly increased LSV efficiency and appeal. These improvements lower operating costs and enhance performance, making LSVs attractive for personal mobility, commercial logistics, and industrial applications. While the COVID-19 pandemic created mixed market effects, demand for low-emission and cost-effective transportation solutions continues to grow globally.
| Market Scope | |
|---|---|
| Start Year | 2025 |
| Forecast Year | 2026-2035 |
| Start Value | $10.4 Billion |
| Forecast Value | $21.8 Billion |
| CAGR | 7.8% |
The industrial utility vehicle segment held a 43% share in 2025 and is projected to grow at a CAGR of 8.9% from 2026 to 2035. Industrial LSVs are essential in manufacturing, construction, logistics, and other commercial applications due to their rugged design, extended duty cycles, and payload capacities of 1,500-2,500 lbs.
The internal Combustion Engine (ICE) vehicles segment held a 61% share in 2025, expected to grow at a CAGR of 7.1% through 2035. ICE LSVs retain a significant market presence because of operational range advantages, ease of refueling, and suitability for specific applications, typically powered by 3-10 horsepower engines with automated or continuously variable transmissions.
United States Low Speed Vehicle Market generated USD 3.8 billion in 2025. The demand is driven by widespread adoption in gated communities, recreational spaces, campuses, and industrial facilities, supported by regulations permitting LSVs on select public roads and increasing electrification efforts in logistics and materials handling operations.
Key players in the Global Low Speed Vehicle Market include Bradshaw EV, Columbia Vehicle, Polaris GEM, EVolution Electric Vehicles, Yamaha Motor, Textron, Deere & Company, Star EV, The Toro Company, and KUBOTA. Companies in the Global Low Speed Vehicle Market are strengthening their positions through continuous innovation in battery technology, enhancing vehicle efficiency, and extending lifecycle performance. Manufacturers are expanding product lines to target industrial, commercial, and personal mobility sectors. Strategic partnerships, acquisitions, and collaborations enable faster market penetration and global reach. Firms are also investing in digital marketing, e-commerce channels, and localized distribution to increase brand visibility. Electrification initiatives, after-sales support, and customized solutions for logistics and gated communities further solidify market foothold and long-term competitiveness.
Table of Contents
Chapter 1 Methodology & Scope
- 1.1 Market scope and definition
- 1.2 Research design
- 1.2.1 Research approach
- 1.2.2 Data collection methods
- 1.3 Data mining sources
- 1.3.1 Global
- 1.3.2 Regional/Country
- 1.4 Base estimates and calculations
- 1.4.1 Base year calculation
- 1.4.2 Key trends for market estimation
- 1.5 Primary research and validation
- 1.5.1 Primary sources
- 1.6 Forecast model
- 1.7 Research assumptions and limitations
Chapter 2 Executive Summary
- 2.1 Industry 3600 synopsis
- 2.2 Key market trends
- 2.2.1 Regional
- 2.2.2 Vehicle
- 2.2.3 Propulsion
- 2.2.4 Power Output
- 2.2.5 Speed Class
- 2.2.6 Application
- 2.3 TAM Analysis, 2026-2035
- 2.4 CXO perspectives: Strategic imperatives
- 2.4.1 Key decision points for industry executives
- 2.4.2 Critical success factors for market players
- 2.5 Future outlook and strategic recommendations
Chapter 3 Industry Insights
- 3.1 Industry ecosystem analysis
- 3.1.1 Supplier landscape
- 3.1.1.1 Raw material suppliers
- 3.1.1.2 Component suppliers
- 3.1.1.3 Manufacturers
- 3.1.1.4 Technology providers
- 3.1.1.5 Distribution channel
- 3.1.1.6 End Use
- 3.1.2 Cost structure
- 3.1.3 Profit margin
- 3.1.4 Value addition at each stage
- 3.1.5 Vertical integration trends
- 3.1.6 Disruptors
- 3.1.1 Supplier landscape
- 3.2 Impact on forces
- 3.2.1 Growth drivers
- 3.2.1.1 Urban mobility inside gated/controlled areas
- 3.2.1.2 Tourism, hospitality & leisure expansion
- 3.2.1.3 Electrification push & sustainability mandates
- 3.2.1.4 Operational cost savings
- 3.2.2 Industry pitfalls & challenges
- 3.2.2.1 Range & performance limitations
- 3.2.2.2 Limited road access & regulatory inconsistencies
- 3.2.3 Market opportunities
- 3.2.3.1 Lithium-ion replacing lead-acid
- 3.2.3.2 Connected / telematics-enabled LSV fleets
- 3.2.3.3 Customization & modular utility bodies
- 3.2.3.4 Premium & lifestyle LSVs for residential use
- 3.2.1 Growth drivers
- 3.3 Technology trends & innovation ecosystem
- 3.3.1 Current technologies
- 3.3.2 Emerging technologies
- 3.4 Growth potential analysis
- 3.5 Regulatory landscape
- 3.5.1 North America
- 3.5.1.1 U.S. NHTSA Low-Speed Vehicle (LSV) Standards (FMVSS 500)
- 3.5.1.2 U.S. State-Level Street-Legal LSV Rules
- 3.5.1.3 Canada Transport Canada LSV Regulations
- 3.5.2 Europe
- 3.5.2.1 EU Quadricycle Category L6e / L7e
- 3.5.2.2 UNECE Vehicle Safety Regulations
- 3.5.2.3 EU Battery Regulation
- 3.5.2.4 EU End-of-Life Vehicle Directive
- 3.5.3 Asia-Pacific
- 3.5.3.1 China GB Standards for NEVs and LSVs
- 3.5.3.2 India CMVR Rules for Electric Vehicles
- 3.5.3.3 Japan MLIT Micro-Mobility Regulations
- 3.5.4 Latin America
- 3.5.4.1 Brazil CONTRAN Standards
- 3.5.4.2 Argentina IRAM Standards
- 3.5.4.3 Mexico NOM Vehicle Standards
- 3.5.5 Middle East & Africa
- 3.5.5.1 Saudi Arabia SASO Standards
- 3.5.5.2 UAE ESMA Regulations
- 3.5.5.3 GSO Gulf Standards for Electric Vehicles
- 3.5.5.4 South Africa SANS Regulations
- 3.5.1 North America
- 3.6 Porter';s analysis
- 3.7 PESTEL analysis
- 3.8 Price trends
- 3.8.1 By region
- 3.8.2 By product
- 3.9 Patent analysis
- 3.10 Production statistics
- 3.10.1 Production hubs
- 3.10.2 Consumption hubs
- 3.10.3 Export and import
- 3.11 Sustainability and environmental aspects
- 3.11.1 Sustainable practices
- 3.11.2 Waste reduction strategies
- 3.11.3 Energy efficiency in production
- 3.11.4 Eco-friendly initiatives
- 3.11.5 Carbon footprint considerations
- 3.12 Vehicle Architecture & Platform Strategy
- 3.12.1 Chassis & skateboard platforms
- 3.12.2 Modular body & utility attachment strategy
- 3.12.3 Platform reuse across applications
- 3.13 OEM vs Regional Assembler Landscape
- 3.13.1 Local assemblers vs branded OEMs
- 3.13.2 White-label / private-label manufacturing
- 3.13.3 CKD/SKD assembly trends
- 3.14 Fleet Ownership & Buying Behavior Analysis
- 3.14.1 Fleet buyers vs individual buyers
- 3.14.2 Purchase vs lease vs managed fleet models
- 3.14.3 Replacement cycles and utilization rates
- 3.15 Feasibility & adoption of low-speed vehicles assessment
- 3.15.1 Total Cost of Ownership (TCO) benchmarking
- 3.15.2 Battery, charging & powertrain viability
- 3.15.3 Street-legality & compliance economics
- 3.15.4 Application-level ROI & payback
- 3.15.5 Infrastructure readiness & operating risk
- 3.16 Distribution & Go-To-Market Models
Chapter 4 Competitive Landscape, 2025
- 4.1 Introduction
- 4.2 Company market share analysis
- 4.2.1 North America
- 4.2.2 Europe
- 4.2.3 Asia-Pacific
- 4.2.4 Latin America
- 4.2.5 Middle East & Africa
- 4.3 Competitive positioning matrix
- 4.4 Strategic outlook matrix
- 4.5 Key developments
- 4.5.1 Mergers & acquisitions
- 4.5.2 Partnerships & collaborations
- 4.5.3 New product launches
- 4.5.4 Expansion plans and funding
Chapter 5 Market Estimates & Forecast, By Vehicle, 2022 - 2035 ($Bn, Units)
- 5.1 Key trends
- 5.2 Golf Cart
- 5.3 Commercial utility vehicle
- 5.4 Industrial utility vehicle
- 5.5 Personal mobility vehicle
Chapter 6 Market Estimates & Forecast, By Propulsion, 2022 - 2035 ($Bn, units)
- 6.1 Key trends
- 6.2 ICE
- 6.3 Electric
Chapter 7 Market Estimates & Forecast, By Power Output, 2022 - 2035 ($Bn, Units)
- 7.1 Key trends
- 7.2 >15 KW
- 7.3 6-15KW
- 7.4 <15KW
Chapter 8 Market Estimates & Forecast, By Speed Class, 2022 - 2035 ($Bn, Units)
- 8.1 Key trends
- 8.2 Up to 15 mph
- 8.3 15-25 mph
- 8.4 Above 25 mph
Chapter 9 Market Estimates & Forecast, By Application, 2022 - 2035 ($Bn, Units)
- 9.1 Key trends
- 9.2 Golf courses
- 9.3 Hotels & resorts
- 9.4 Airports
- 9.5 Industrial facilities
- 9.6 Others
Chapter 10 Market Estimates & Forecast, By Region, 2022 - 2035 ($Bn, Units)
- 10.1 North America
- 10.1.1 US
- 10.1.2 Canada
- 10.2 Europe
- 10.2.1 UK
- 10.2.2 Germany
- 10.2.3 France
- 10.2.4 Italy
- 10.2.5 Spain
- 10.2.6 Belgium
- 10.2.7 Netherlands
- 10.2.8 Sweden
- 10.2.9 Russia
- 10.3 Asia Pacific
- 10.3.1 China
- 10.3.2 India
- 10.3.3 Japan
- 10.3.4 Australia
- 10.3.5 Singapore
- 10.3.6 South Korea
- 10.3.7 Vietnam
- 10.3.8 Indonesia
- 10.4 Latin America
- 10.4.1 Brazil
- 10.4.2 Mexico
- 10.4.3 Argentina
- 10.5 MEA
- 10.5.1 South Africa
- 10.5.2 Saudi Arabia
- 10.5.3 UAE
Chapter 11 Company Profiles
- 11.1 Global players
- 11.1.1 Columbia Vehicle
- 11.1.2 Deere & Company
- 11.1.3 Garia
- 11.1.4 ICON Electric Vehicles
- 11.1.5 Kandi Technologies
- 11.1.6 KUBOTA
- 11.1.7 Polaris GEM
- 11.1.8 Star EV
- 11.1.9 Textron
- 11.1.10 The Toro Company
- 11.1.11 Tomberlin
- 11.1.12 Yamaha Motor
- 11.2 Regional players
- 11.2.1 American Landmaster
- 11.2.2 Bradshaw EV
- 11.2.3 Moto Electric Vehicles
- 11.2.4 Motrec International
- 11.2.5 Suzhou Eagle Electric Vehicle Manufacturing
- 11.2.6 EVolution Electric Vehicles
- 11.2.7 Melex
- 11.2.8 Bintelli
- 11.3 Emerging players
- 11.3.1 Stealth
- 11.3.2 Tropos Motors
- 11.3.3 Marshell
- 11.3.4 Durable EV
- 11.3.5 Eco Vehicle brands
