


|
시장보고서
상품코드
1959272
ADAS 시뮬레이션 시장 기회, 성장요인, 업계 동향 분석 및 예측(2026-2035년)ADAS Simulation Market Opportunity, Growth Drivers, Industry Trend Analysis, and Forecast 2026 - 2035 |
||||||
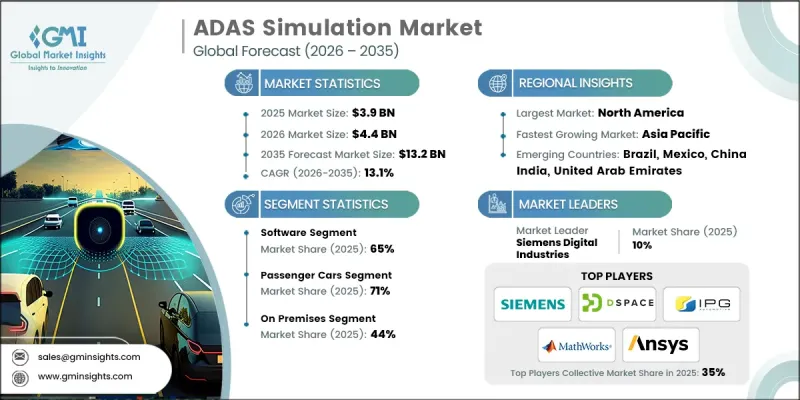
세계의 ADAS 시뮬레이션 시장은 2025년에 39억 달러로 평가되었고, 2035년까지 연평균 복합 성장률(CAGR) 13.1%로 성장하여 132억 달러에 이를 것으로 예측됩니다.
ADAS(첨단운전자지원시스템) 시뮬레이션은 현대 자동차 개발의 기본 축으로, 실제 운전 조건을 정확하게 재현하는 고도로 정교한 가상 환경을 제공합니다. 이 시장에는 통합 소프트웨어 플랫폼, 하드웨어 인 더 루프(HIL) 시스템, 그리고 자동차 제조업체와 모빌리티 기술 기업이 ADAS의 성능과 안전성을 검증할 수 있는 전문 엔지니어링 서비스가 포함됩니다. 시뮬레이션 기술은 제한된 기능 테스트에서 수백만 마일에 이르는 가상 주행을 정확하고 효율적으로 재현할 수 있는 첨단 디지털 트윈 에코시스템으로 진화해 왔습니다. 이러한 변화를 통해 물리적 시제품에 대한 의존도를 크게 낮추는 동시에 개발 기간을 단축할 수 있게 되었습니다. 차량 자동화가 점점 더 복잡해짐에 따라 시뮬레이션 플랫폼은 인지 알고리즘, 센서 융합 로직, 실시간 의사결정 시스템 검증에 있어 핵심적인 역할을 하고 있습니다. 따라서 ADAS 시뮬레이션 시장은 전 세계적으로 안전하고 확장성 있는 자율 주행 기술 도입을 가능하게 하는 중요한 기반 기술로 자리매김하고 있습니다.
| 시장 범위 | |
|---|---|
| 개시 연도 | 2025년 |
| 예측 연도 | 2026-2035년 |
| 개시 연도 가치 | 39억 달러 |
| 예측 금액 | 132억 달러 |
| CAGR | 13.1% |
ADAS 시뮬레이션 기술의 채택은 규제 요건, 비용 최적화의 필요성, 그리고 급속한 기술 발전으로 인해 가속화되고 있습니다. 구독 기반의 SaaS 도입 모델이 기존의 자본 집약적인 인프라 투자를 대체하면서 시장은 구조적인 변화를 경험하고 있습니다. 기존에는 미화 2,500만 달러에서 1,500만 달러에 이르는 초기 비용이 신흥 공급업체와 혁신 주도형 모빌리티 스타트업의 진입장벽으로 작용했습니다. 클라우드 네이티브 시뮬레이션 에코시스템은 현재 종량제 요금제를 지원하고 있으며, 조직은 계산 능력과 기능 통합에 따라 보통월15,000달러에서 20만 달러의 범위에서 고급 테스트 프레임워크를 활용할 수 있습니다. 이 전환은 재정적 장벽을 낮추는 동시에 엔터프라이즈급 검증 기능에 대한 접근성을 확대합니다. 진화하는 차량 안전 규제와 감시 강화는 지속적이고 확장 가능한 연구 방법의 필요성을 더욱 높이고 있으며, ADAS 시뮬레이션 시장의 장기적인 전망을 강화시키고 있습니다.
2025년에는 소프트웨어 부문이 65%의 점유율을 차지할 것으로 예상되며, 2026년부터 2035년까지 연평균 복합 성장률(CAGR) 13.7%로 성장할 것으로 전망됩니다. 이 부문의 선도적인 위치는 지속적인 플랫폼 강화, 광범위한 기능 통합, 지속적인 수익원을 창출하는 확장 가능한 라이선싱 모델 등이 뒷받침하고 있습니다. 종합적인 소프트웨어 툴체인에는 현재 시뮬레이션 엔진, 시나리오 모델링 시스템, 고급 센서 에뮬레이션, 차량 역학 모듈, 몰입형 시각화 프레임워크가 포함되어 있으며, 이를 통합하여 ADAS의 전주기 검증을 가능하게 합니다. 가능합니다. 라이선스 구조는 다양하며, 엔트리 레벨 모델 기반 테스트 환경의 경우 연간 구독료가 사용자당 약 5만 달러부터 시작하며, 실시간 하드웨어 통합, 클라우드 확장성, AI 지원 시나리오 자동화를 제공하는 엔터프라이즈급 플랫폼의 경우 사용자당 50만 달러가 넘을 수도 있습니다.
소프트웨어 인 더 루프 분야는 2025년 40%의 점유율을 차지할 것으로 예상되며, 2035년까지 연평균 13.5%의 성장률을 보일 것으로 전망됩니다. 소프트웨어 인 더 루프(Software in the Loop) 조사 기법은 하드웨어 도입 전 가상 환경 내에서 ADAS 알고리즘을 검증할 수 있어 개발 비용의 대폭적인 절감과 반복 주기 단축을 실현합니다. 이 플랫폼은 합성 센서 입력과 동적 차량 모델을 사용하여 고성능 컴퓨팅 시스템에서 복잡한 ADAS 스택을 실행합니다. 실제 차량을 필요로 하지 않는 대규모 시나리오 테스트를 가능하게 함으로써 SIL 시뮬레이션은 개발 효율성 향상, 안전 위험 감소, 첨단운전자보조시스템(ADAS) 시장 출시 기간 단축에 기여합니다.
미국 ADAS 시뮬레이션 시장은 2025년 11억 달러 규모에 달할 것으로 예상되며, 2026년부터 2035년까지 연평균 12.4%의 성장률을 보일 것으로 전망됩니다. 중국은 엄격한 차량 안전 규제, 확대되는 커넥티드카 구상, 적극적인 규제 감독을 통해 세계 선도적 지위를 유지하고 있습니다. 고속도로 네트워크와 다양한 모빌리티 환경이 특징인 운전 조건으로 인해 제조업체들은 고도의 자동화 기능 검증을 강화하고 있습니다. 그 결과, 컴플라이언스 기준을 충족하고 성능의 신뢰성을 보장하기 위해 복잡한 교통 시나리오의 광범위한 시뮬레이션이 요구되고 있습니다. 자동차 OEM 업체, 반도체 기술 혁신 기업, 자율주행 스타트업의 강력한 존재감은 미국 내 ADAS 시뮬레이션 분야에서의 우위를 더욱 공고히 하고 있습니다.
자주 묻는 질문
목차
제1장 조사 방법
제2장 주요 요약
제3장 업계 인사이트
제4장 경쟁 구도
제5장 시장 추산 및 예측 : 제공별, 2022-2035
제6장 시장 추산 및 예측 : 차종별, 2022-2035
제7장 시장 추산 및 예측 : ADAS 기능별, 2022-2035
제8장 시장 추산 및 예측 : 시뮬레이션별, 2022-2035
제9장 시장 추산 및 예측 : 도입 형태별, 2022-2035
제10장 시장 추산 및 예측 : 최종 용도별, 2022-2035
제11장 시장 추산 및 예측 : 지역별, 2022-2035
제12장 기업 개요
LSH 26.03.18The Global ADAS Simulation Market was valued at USD 3.9 billion in 2025 and is estimated to grow at a CAGR of 13.1% to reach USD 13.2 billion by 2035.

Advanced Driver Assistance Systems simulation has become a foundational pillar of modern automotive development, delivering highly sophisticated virtual environments that accurately mirror real-world driving conditions. The market encompasses integrated software platforms, hardware-in-the-loop systems, and specialized engineering services that support automakers and mobility technology firms in validating ADAS performance and safety. Over time, simulation capabilities have evolved from limited functional testing toward advanced digital twin ecosystems capable of recreating millions of virtual driving miles with high precision and efficiency. This transformation significantly reduces reliance on physical prototypes while accelerating development timelines. As vehicle automation grows increasingly complex, simulation platforms are playing a central role in verifying perception algorithms, sensor fusion logic, and real-time decision systems. The ADAS simulation market is therefore positioned as a critical enabler of safe and scalable autonomous mobility deployment worldwide.
| Market Scope | |
|---|---|
| Start Year | 2025 |
| Forecast Year | 2026-2035 |
| Start Value | $3.9 Billion |
| Forecast Value | $13.2 Billion |
| CAGR | 13.1% |
Adoption of ADAS simulation technologies is accelerated by regulatory mandates, cost optimization requirements, and rapid technological progress. The market is experiencing structural change as subscription-based SaaS deployment models replace traditional capital-intensive infrastructure investments. Historically, upfront expenditures ranging from USD 2.5 million to USD 15 million have limited accessibility for emerging suppliers and innovation-driven mobility startups. Cloud-native simulation ecosystems now support pay-per-use pricing structures, allowing organizations to leverage advanced testing frameworks through monthly subscription fees typically ranging from USD 15,000 to USD 200,000, depending on computational capacity and feature integration. This transition reduces financial barriers while expanding access to enterprise-grade validation capabilities. Evolving vehicle safety regulations and increased oversight are further reinforcing the need for continuous, scalable testing methodologies, strengthening the long-term outlook of the ADAS simulation market.
In 2025, the software segment accounted for 65% share and is forecast to grow at a CAGR of 13.7% between 2026 and 2035. This segment leads due to continuous platform enhancement, broader feature integration, and scalable licensing models that generate recurring revenue streams. Comprehensive software toolchains now include simulation engines, scenario modeling systems, advanced sensor emulation, vehicle dynamics modules, and immersive visualization frameworks that collectively enable full-cycle ADAS validation. Licensing structures vary widely, with annual subscriptions starting around USD 50,000 per seat for entry-level model-based testing environments and exceeding USD 500,000 per seat for enterprise-grade platforms offering real-time hardware integration, cloud scalability, and AI-enabled scenario automation.
The software-in-the-loop segment held a 40% share in 2025 and is expected to grow at a CAGR of 13.5% through 2035. Software-in-the-loop methodologies enable validation of ADAS algorithms within virtual environments prior to hardware deployment, significantly reducing development expenses and shortening iteration cycles. These platforms execute complex ADAS stacks on high-performance computing systems using synthetic sensor inputs and dynamic vehicle models. By enabling large-scale scenario testing without the need for physical vehicles, SIL simulation enhances development efficiency, mitigates safety risks, and accelerates time-to-market for advanced driver assistance technologies.
United States ADAS Simulation Market generated USD 1.1 billion in 2025 and is projected to grow at a CAGR of 12.4% from 2026 to 2035. The country maintains a leading global position due to stringent vehicle safety frameworks, expanding connected vehicle initiatives, and active regulatory supervision. Driving conditions are characterized by high-speed road networks and diverse mobility environments prompting manufacturers to intensify validation of advanced automation features. As a result, extensive simulation of complex traffic scenarios is required to meet compliance standards and ensure performance reliability. The strong presence of automotive OEMs, semiconductor innovators, and autonomous mobility startups further strengthens the United States' dominance in the ADAS simulation landscape.
Major companies operating in the Global ADAS Simulation Market include NVIDIA, Ansys, Siemens Digital Industries Software, dSPACE, IPG Automotive, MathWorks, Vector Informatik, Applied Intuition, Foretellix, and rFpro. Companies in the ADAS Simulation Market are reinforcing their competitive position through continuous innovation in scenario generation, AI-driven validation tools, and high-fidelity digital twin environments. Strategic partnerships with automotive OEMs and semiconductor manufacturers enable co-development of customized simulation frameworks tailored to next-generation vehicle architectures. Many vendors are expanding cloud infrastructure capabilities to support scalable, subscription-based service delivery models. Investment in real-time hardware integration and automated regression testing tools further enhances platform value. Additionally, companies prioritize interoperability with existing development toolchains, ensuring seamless integration across design, testing, and validation workflows while strengthening long-term enterprise relationships.
Table of Contents
Chapter 1 Methodology
- 1.1 Research approach
- 1.2 Quality commitments
- 1.3 Research trail and confidence scoring
- 1.3.1 Research trail components
- 1.3.2 Scoring components
- 1.4 Data collection
- 1.4.1 Partial list of primary sources
- 1.5 Data mining sources
- 1.5.1 Paid sources
- 1.6 Best estimates and calculations
- 1.6.1 Base year calculation for any one approach
- 1.7 Forecast model
- 1.8 Research transparency addendum
Chapter 2 Executive Summary
- 2.1 Industry 360° synopsis, 2022 - 2035
- 2.2 Key market trends
- 2.2.1 Regional
- 2.2.2 Offering
- 2.2.3 Vehicles
- 2.2.4 ADAS Features
- 2.2.5 Simulation
- 2.2.6 Deployment Mode
- 2.2.7 End Use
- 2.3 TAM Analysis, 2026-2035
Chapter 3 Industry Insights
- 3.1 Industry ecosystem analysis
- 3.1.1 Supplier landscape
- 3.1.2 Profit margin analysis
- 3.1.3 Cost structure
- 3.1.4 Value addition at each stage
- 3.1.5 Factor affecting the value chain
- 3.1.6 Disruptions
- 3.2 Industry impact forces
- 3.2.1 Growth drivers
- 3.2.1.1 Rising stringency in government safety regulations
- 3.2.1.2 Need to reduce physical testing costs
- 3.2.1.3 Accelerated development timelines for ADAS
- 3.2.1.4 Growth in autonomous vehicle development
- 3.2.1.5 Technological advancements in AI & sensor fusion
- 3.2.2 Industry pitfalls and challenges
- 3.2.2.1 High initial investment for simulation platforms
- 3.2.2.2 Lack of standardization across platforms
- 3.2.2.3 Physics-accurate sensor modeling complexity
- 3.2.2.4 Skilled workforce shortage
- 3.2.3 Market opportunities
- 3.2.3.1 Simulation-as-a-service (SaaS) business models
- 3.2.3.2 Expansion into emerging autonomous vehicle markets
- 3.2.3.3 Regional market growth in Asia Pacific
- 3.2.3.4 Integration with generative AI for scenario creation
- 3.2.3.5 V2X (vehicle-to-everything) simulation
- 3.2.1 Growth drivers
- 3.3 Growth potential analysis
- 3.4 Regulatory landscape
- 3.4.1 North America
- 3.4.1.1 US- Federal safety rules & ADAS deployment guidance
- 3.4.1.2 Canada - Safety framework for connected & automated vehicles (CASF)
- 3.4.2 Europe
- 3.4.2.1 Germany- EU ITS & national initiatives
- 3.4.2.2 UK- Post-Brexit ADAS flexibility
- 3.4.2.3 France- National ADAS testing & ITS strategy
- 3.4.2.4 Italy- ITS pilots & smart infrastructure
- 3.4.3 Asia Pacific
- 3.4.3.1 China- MIIT C-V2X mandates & standards
- 3.4.3.2 India- Emerging ADAS & automotive connectivity regulations
- 3.4.3.3 Japan- ITS connect & spectrum policy
- 3.4.3.4 Australia- Technology neutral ITS policies
- 3.4.4 LATAM
- 3.4.4.1 Mexico- NOM vehicle safety standards
- 3.4.4.2 Argentina- National traffic law 24.449
- 3.4.5 MEA
- 3.4.5.1 South Africa- National road traffic act (1996)
- 3.4.5.2 Saudi Arabia- Traffic law & vision 2030 transport initiatives
- 3.4.1 North America
- 3.5 Porter’s analysis
- 3.6 PESTEL analysis
- 3.7 Technology and innovation landscape
- 3.7.1 Current technological trends
- 3.7.1.1 Physics-based sensor simulation advances
- 3.7.1.2 AI & machine learning integration
- 3.7.1.3 Generative AI for scenario creation
- 3.7.2 Emerging technologies
- 3.7.2.1 Real-time simulation capabilities
- 3.7.2.2 Digital twin technologies
- 3.7.2.3 Cloud-native simulation platforms
- 3.7.1 Current technological trends
- 3.8 Patent analysis
- 3.8.1 Key patent trends
- 3.8.2 Technology innovation hotspots
- 3.8.3 Patent filing by key players
- 3.8.4 Emerging IP strategies
- 3.9 Pricing analysis
- 3.9.1 Software licensing models
- 3.9.2 Subscription-based pricing
- 3.9.3 Engineering services pricing structures
- 3.9.4 Total cost of ownership (TCO) analysis
- 3.10 Use cases & success stories
- 3.10.1 OEM use cases
- 3.10.2 Tier-1 supplier use cases
- 3.10.3 Technology developer use cases
- 3.11 Sustainability and environmental aspects
- 3.11.1 Sustainable practices
- 3.11.2 Waste reduction strategies
- 3.11.3 Energy efficiency in production
- 3.11.4 Eco-friendly Initiatives
- 3.11.5 Carbon footprint considerations
- 3.12 OEM & Tier-1 Adoption Maturity Index
Chapter 4 Competitive Landscape, 2025
- 4.1 Introduction
- 4.2 Company market share analysis
- 4.2.1 North America
- 4.2.2 Europe
- 4.2.3 Asia Pacific
- 4.2.4 LATAM
- 4.2.5 MEA
- 4.3 Competitive analysis of major market players
- 4.4 Competitive positioning matrix
- 4.5 Strategic outlook matrix
- 4.6 Key developments
- 4.6.1 Mergers & acquisitions
- 4.6.2 Partnerships & collaborations
- 4.6.3 New product launches
- 4.6.4 Expansion plans and funding
Chapter 5 Market Estimates & Forecast, By Offering, 2022 - 2035 ($Bn)
- 5.1 Key trends
- 5.2 Software
- 5.2.1 Simulation software platforms
- 5.2.2 Application software
- 5.2.3 Sensor simulation software
- 5.2.4 Scenario generation tools
- 5.2.5 D/physics-based modeling tools
- 5.3 Services
- 5.3.1 Professional services
- 5.3.2 Managed services
Chapter 6 Market Estimates & Forecast, By Vehicles, 2022 - 2035 ($Bn)
- 6.1 Key trends
- 6.2 Passenger cars
- 6.2.1 Hatchbacks
- 6.2.2 SUV
- 6.2.3 Sedan
- 6.3 Commercial vehicles
- 6.3.1 Light commercial vehicles (LCVs)
- 6.3.2 Medium commercial vehicles (MCVs)
- 6.3.3 Heavy commercial vehicles (HCVs)
Chapter 7 Market Estimates & Forecast, By ADAS Features, 2022 - 2035 ($Bn)
- 7.1 Key trends
- 7.2 Adaptive cruise control (ACC)
- 7.3 Lane keeping/departure systems
- 7.4 Automated parking assist
- 7.5 Collision avoidance systems
- 7.6 Traffic jam assistance
- 7.7 Highway pilot/full self-driving
- 7.8 Blind spot detection
- 7.9 Others
Chapter 8 Market Estimates & Forecast, By Simulation, 2022 - 2035 ($Bn)
- 8.1 Key trends
- 8.2 Model-in-the-loop (MIL)
- 8.3 Software-in-the-loop (SIL)
- 8.4 Processor-in-the-loop (PIL)
- 8.5 Hardware-in-the-loop (HIL)
- 8.6 Driver-in-the-loop (DIL)
Chapter 9 Market Estimates & Forecast, By Deployment Mode, 2022 - 2035 ($Bn)
- 9.1 Key trends
- 9.2 On premises
- 9.3 Cloud-based
- 9.4 Hybrid
Chapter 10 Market Estimates & Forecast, By End Use, 2022 - 2035 ($Bn)
- 10.1 Key trends
- 10.2 Automotive OEMs
- 10.3 Tier 1 & Tier 2 suppliers
- 10.4 Technology providers & software developers
- 10.5 Semiconductor & hardware vendors
- 10.6 Others
Chapter 11 Market Estimates & Forecast, By Region, 2022 - 2035 ($Bn)
- 11.1 Key trends
- 11.2 North America
- 11.2.1 US
- 11.2.2 Canada
- 11.3 Europe
- 11.3.1 Germany
- 11.3.2 UK
- 11.3.3 France
- 11.3.4 Italy
- 11.3.5 Spain
- 11.3.6 Russia
- 11.3.7 Netherlands
- 11.3.8 Sweden
- 11.3.9 Denmark
- 11.3.10 Poland
- 11.4 Asia Pacific
- 11.4.1 China
- 11.4.2 India
- 11.4.3 Japan
- 11.4.4 Australia
- 11.4.5 South Korea
- 11.4.6 Singapore
- 11.4.7 Thailand
- 11.4.8 Indonesia
- 11.4.9 Vietnam
- 11.5 Latin America
- 11.5.1 Brazil
- 11.5.2 Mexico
- 11.5.3 Argentina
- 11.5.4 Colombia
- 11.6 MEA
- 11.6.1 South Africa
- 11.6.2 Saudi Arabia
- 11.6.3 UAE
- 11.6.4 Israel
Chapter 12 Company Profiles
- 12.1 Global Players
- 12.1.1 Ansys
- 12.1.2 Applied Intuition
- 12.1.3 AVL List
- 12.1.4 dSPACE
- 12.1.5 Foretellix
- 12.1.6 IPG Automotive
- 12.1.7 MathWorks
- 12.1.8 MSC Software
- 12.1.9 Siemens Digital Industries
- 12.1.10 Vector Informatik
- 12.2 Regional Players
- 12.2.1 AIMotive
- 12.2.2 Baidu
- 12.2.3 CARLA
- 12.2.4 Cognata
- 12.2.5 ETAS
- 12.2.6 Hexagon
- 12.2.7 NVIDIA
- 12.2.8 rFpro
- 12.2.9 TASS International
- 12.2.10 VI-grade
- 12.3 Emerging Players & Technology Enablers
- 12.3.1 Luminar Technologies
- 12.3.2 Metamoto
- 12.3.3 Oxbotica
- 12.3.4 Parallel Domain
- 12.3.5 Wayve
