
|
시장보고서
상품코드
1959572
자율주행 버스 소프트웨어 시장 기회, 성장요인, 업계 동향 분석 및 예측(2026-2035년)Autonomous Bus Software Market Opportunity, Growth Drivers, Industry Trend Analysis, and Forecast 2026 - 2035 |
||||||
세계의 자율주행 버스 소프트웨어 시장은 2025년에 10억 4,000만 달러로 평가되었고, 2035년까지 연평균 복합 성장률(CAGR) 24.7%로 성장하여 92억 3,000만 달러에 이를 것으로 예측됩니다.

이러한 시장 성장은 지속 가능하고 효율적이며 지능적인 도시 모빌리티 솔루션에 대한 전 세계적인 관심 증가에 의해 주도되고 있습니다. 전 세계 도시들은 교통 체증을 완화하고, 배출가스를 줄이고, 승객의 전반적인 경험을 개선하기 위한 기술에 투자하고 있습니다. 첨단 소프트웨어가 탑재된 자율주행 버스는 이러한 전략의 중요한 구성요소가 되고 있습니다. AI, 머신러닝, 첨단 센서, 클라우드 분석의 통합을 통해 버스는 실시간 항해, 경로 최적화, 승객 및 보행자 안전을 향상시킬 수 있습니다. 정부, 교통기관, 기술 제공업체들은 특히 스마트시티 구상 중 지능형 교통 시스템이 자율주행 버스와 인프라, 다른 차량, 교통 관리 시스템과의 연계를 가능하게 하는 분야에서 지능형 교통 시스템 도입을 가속화하기 위해 협력하고 있습니다. 이러한 협력은 운영 효율성 향상뿐만 아니라 환경 목표 달성에도 기여하며, 자율주행 버스를 도시 대중교통의 미래 핵심으로 자리매김하고 있습니다.
| 시장 범위 | |
|---|---|
| 개시 연도 | 2025년 |
| 예측 연도 | 2026-2035년 |
| 개시 연도 가치 | 10억 4,000만 달러 |
| 예측 금액 | 92억 3,000만 달러 |
| CAGR | 24.7% |
자율주행 분야는 2025년 36.08%의 점유율을 차지할 것으로 예상되며, 2035년까지 연평균 26.1%의 성장률을 보일 것으로 전망됩니다. 이러한 성장은 운영 효율성 향상과 안전성 강화를 위한 차량 관리 소프트웨어의 도입 확대에 의해 촉진되고 있습니다. 사업자는 버스를 실시간으로 원격으로 모니터링하고, 기술적 문제를 추적하고, 지연이나 고장에 즉시 대응할 수 있습니다. IoT 기반 예지보전은 문제가 심각해지기 전에 잠재적인 문제를 예측하여 다운타임과 수리 비용을 절감할 수 있습니다. 이 소프트웨어는 경로 최적화 및 연료 소비량 추적 기능도 포함하고 있어 운영 비용 절감과 효율적인 차량 관리에 기여합니다. 이러한 요소들로 인해 자율주행 소프트웨어는 승객의 안전을 보장하고 신뢰성과 수익성을 향상시키려는 교통 사업자들에게 필수적인 도구가 되고 있습니다.
레벨4 자율주행 버스 시장은 2025년 6억 7,160만 달러 규모에 달할 것으로 예측됩니다. 이 버스는 비즈니스 지구, 캠퍼스, 스마트시티의 회랑 등 미리 정의된 구역 내에서 자율적으로 운행하도록 설계되어 있습니다. AI를 활용한 예측 분석, 실시간 교통정보, 머신러닝을 통해 복잡한 도시 환경을 효율적으로 주행합니다. 레벨4 자율주행 버스는 교통 패턴과 승객 수요에 지속적으로 적응하여 최적화된 성능을 제공합니다. 규제 프레임워크와 인프라의 제약으로 인해 공공 도로에서의 광범위한 도입이 제한되어 있지만, 각 도시에서 실시되고 있는 통제된 테스트와 파일럿 프로그램은 이러한 시스템의 개선과 향후 주류화를 가속화하고 있습니다.
중국의 자율주행 버스 소프트웨어 시장은 2026년부터 2035년까지 연평균 복합 성장률(CAGR) 27.1%로 확대될 것으로 예측됩니다. 급속한 도시화, 대규모 대중교통의 업그레이드, 스마트시티 구상이 수요를 주도하고 있습니다. 자율주행 기술, AI, 지능형 교통 시스템(ITS)에 대한 정부 지원이 자율주행 버스 소프트웨어 솔루션에 대한 투자를 가속화하고 있습니다. 중국은 교통 체증과 환경 오염을 줄이는 데 중점을 두고 있으며, 탄탄한 기술 생태계와 함께 자율주행 버스 소프트웨어 도입과 혁신의 주요 시장으로 부상하고 있습니다. 기타 아시아태평양 국가들도 도시 지역이 스마트 모빌리티 솔루션을 도입함에 따라 지역 전체의 성장에 기여하고 있습니다.
자주 묻는 질문
목차
제1장 조사 방법과 범위
제2장 주요 요약
제3장 업계 인사이트
제4장 경쟁 구도
제5장 시장 추산 및 예측 : 기능별, 2022-2035
제6장 시장 추산 및 예측 : 자동화 레벨별, 2022-2035
제7장 시장 추산 및 예측 : 도입 형태별, 2022-2035
제8장 시장 추산 및 예측 : 용도별, 2022-2035
제9장 시장 추산 및 예측 : 최종 용도별, 2022-2035
제10장 시장 추산 및 예측 : 지역별, 2022-2035
제11장 기업 개요
LSH 26.03.18The Global Autonomous Bus Software Market was valued at USD 1.04 billion in 2025 and is estimated to grow at a CAGR of 24.7% to reach USD 9.23 billion by 2035.
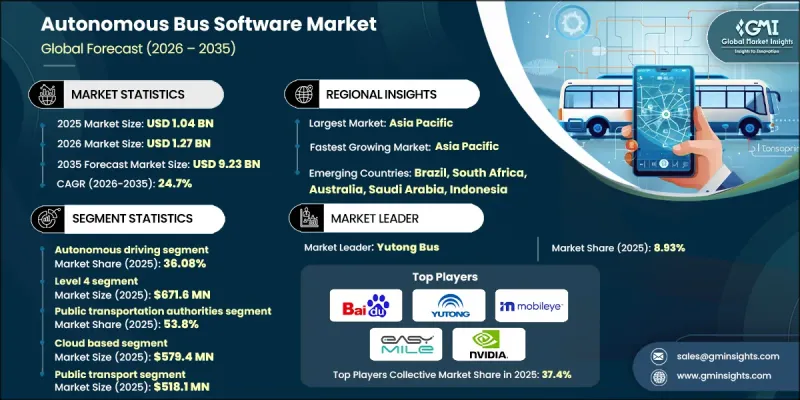
The market growth is driven by an increasing global emphasis on sustainable, efficient, and intelligent urban mobility solutions. Cities worldwide are investing in technologies that reduce congestion, lower emissions, and improve the overall passenger experience. Autonomous buses, powered by advanced software, are becoming a critical component of these strategies. The integration of AI, machine learning, sophisticated sensors, and cloud analytics allows buses to navigate in real time, optimize routes, and enhance safety for passengers and pedestrians. Governments, transit authorities, and technology providers are collaborating to accelerate adoption, particularly in smart city initiatives where intelligent transportation systems enable autonomous buses to communicate with infrastructure, other vehicles, and traffic management systems. These partnerships are not only advancing operational efficiency but also helping meet environmental targets, positioning autonomous buses as central to the future of urban public transportation.
| Market Scope | |
|---|---|
| Start Year | 2025 |
| Forecast Year | 2026-2035 |
| Start Value | $1.04 Billion |
| Forecast Value | $9.23 Billion |
| CAGR | 24.7% |
The autonomous driving segment accounted for 36.08% share in 2025 and is projected to grow at a CAGR of 26.1% through 2035. Growth is fueled by the rising adoption of fleet management software that improves operational efficiency and enhances safety. Operators can remotely monitor buses in real time, track technical issues, and respond immediately to delays or malfunctions. IoT-based predictive maintenance helps forecast potential problems before they escalate, reducing downtime and repair costs. The software also includes route optimization and fuel consumption tracking, which contribute to lower operating costs and more efficient fleet management. These factors make autonomous driving software a vital tool for transit operators seeking to enhance reliability and profitability while ensuring passenger safety.
The level 4 autonomous buses segment accounted for USD 671.6 million in 2025. These buses are designed to operate independently within predefined zones, including business districts, campuses, and smart city corridors. AI-powered predictive analytics, real-time traffic updates, and machine learning allow them to navigate complex urban environments efficiently. By continuously adapting to traffic patterns and passenger demand, Level 4 autonomous buses deliver optimized performance. Although regulatory frameworks and infrastructure limitations restrict their widespread deployment on public roads, controlled trials and pilot programs in various cities are helping to refine these systems and accelerate eventual mainstream adoption.
China Autonomous Bus Software Market is expected to register a CAGR of 27.1% from 2026 to 2035. Rapid urbanization, large-scale public transportation upgrades, and smart city initiatives are driving strong demand. Government support for autonomous driving technologies, AI, and intelligent transportation systems is accelerating investment in autonomous bus software solutions. China's emphasis on reducing traffic congestion and environmental pollution, combined with its robust technology ecosystem, makes it a leading market for adoption and innovation in autonomous bus software. Other Asia-Pacific nations are also contributing to regional growth as urban centers embrace smart mobility solutions.
Major companies operating in the Global Autonomous Bus Software Market include Baidu, Waymo, NVIDIA, Aurora Innovation, Mobileye, Easy Mile, Volvo, Yutong Bus, May Mobility, and WeRide. Companies in the autonomous bus software market are employing multiple strategies to strengthen their position and expand market share. They are heavily investing in research and development to enhance AI algorithms, machine learning models, and sensor technologies for safer, more efficient autonomous driving. Strategic partnerships with automotive manufacturers, transit authorities, and city governments are helping companies scale pilot programs and accelerate commercial deployment. Expanding software capabilities to include fleet management, predictive maintenance, and route optimization increases value for operators. Additionally, firms are focusing on global expansion, regulatory compliance, and smart city integration to secure contracts and long-term adoption.
Table of Contents
Chapter 1 Methodology & Scope
- 1.1 Research approach
- 1.2 Quality commitments
- 1.2.1 GMI AI policy & data integrity commitment
- 1.3 Research trail & confidence scoring
- 1.3.1 Research trail components
- 1.3.2 Scoring components
- 1.4 Data collection
- 1.4.1 Partial list of primary sources
- 1.5 Data mining sources
- 1.5.1 Paid sources
- 1.6 Base estimates and calculations
- 1.6.1 Base year calculation
- 1.7 Forecast model
- 1.8 Research transparency addendum
Chapter 2 Executive Summary
- 2.1 Industry 360° synopsis
- 2.2 Key market trends
- 2.2.1 Regional
- 2.2.2 Functionality
- 2.2.3 Level of automation
- 2.2.4 Deployment model
- 2.2.5 Application
- 2.2.6 End Use
- 2.3 TAM Analysis, 2026-2035
- 2.4 CXO perspectives: Strategic imperatives
- 2.4.1 Key decision points for industry executives
- 2.4.2 Critical success factors for market players
- 2.5 Future outlook and strategic recommendations
Chapter 3 Industry Insights
- 3.1 Industry ecosystem analysis
- 3.1.1 Supplier landscape
- 3.1.2 Cost structure
- 3.1.3 Profit margin
- 3.1.4 Value addition at each stage
- 3.1.5 Vertical integration trends
- 3.1.6 Disruptors
- 3.2 Impact on forces
- 3.2.1 Growth drivers
- 3.2.1.1 Rising Demand for Shared Mobility and On-Demand Transport
- 3.2.1.2 Improved Safety and Traffic Management
- 3.2.1.3 Growing Public Awareness and Acceptance
- 3.2.1.4 Rising Interest in Autonomous Vehicles
- 3.2.2 Industry pitfalls & challenges
- 3.2.2.1 Regulatory and Legal Challenges
- 3.2.2.2 High Development and Operational Costs
- 3.2.3 Market opportunities
- 3.2.3.1 AI-driven APM & predictive analytics
- 3.2.3.2 Collaborations and Partnerships with Cities and Transport Operators
- 3.2.1 Growth drivers
- 3.3 Technology trends & innovation ecosystem
- 3.3.1 Current technologies
- 3.3.2 Emerging technologies
- 3.4 Growth potential analysis
- 3.5 Regulatory landscape
- 3.5.1 North America
- 3.5.1.1 U.S. Federal & State Cybersecurity Regulations
- 3.5.1.2 Canada PIPEDA & Provincial Privacy Regulations
- 3.5.2 Europe
- 3.5.2.1 General Data Protection Regulation
- 3.5.2.2 Digital Operational Resilience Act
- 3.5.2.3 NIS2 & Cybersecurity Directives
- 3.5.3 Asia-Pacific
- 3.5.3.1 China Cybersecurity Law & PIPL
- 3.5.3.2 India Digital Personal Data Protection Act
- 3.5.3.3 Japan APPI & MLIT ICT Guidelines
- 3.5.3.4 ASEAN Data Protection & Cybersecurity Frameworks
- 3.5.4 Latin America
- 3.5.4.1 Brazil LGPD (General Data Protection Law)
- 3.5.4.2 Argentina Personal Data Protection Act
- 3.5.4.3 Mexico Federal Data Protection Law & Privacy Regulations
- 3.5.5 Middle East & Africa
- 3.5.5.1 Saudi Arabia National Cybersecurity Authority (NCA) Regulations
- 3.5.5.2 South Africa POPIA (Protection of Personal Information Act)
- 3.5.5.3 UAE Data Protection & ESMA Cybersecurity Standards
- 3.5.1 North America
- 3.6 Porter's analysis
- 3.7 PESTEL analysis
- 3.8 Price trends
- 3.8.1 By region
- 3.8.2 By product
- 3.9 Cost breakdown analysis
- 3.10 Patent analysis
- 3.11 Sustainability and environmental aspects
- 3.11.1 Carbon footprint of navigation systems
- 3.11.2 Circular economic strategies
- 3.11.3 Sustainable navigation features
- 3.11.4 Corporate sustainability initiatives
- 3.11.5 Climate change impact on navigation
- 3.12 Case studies
- 3.13 Operational Readiness & Regional Deployment Feasibility
- 3.14 Safety Validation, Certification & Liability Framework
- 3.15 Infrastructure Dependency & Smart City Integration
Chapter 4 Competitive Landscape, 2025
- 4.1 Introduction
- 4.2 Company market share analysis
- 4.2.1 North America
- 4.2.2 Europe
- 4.2.3 Asia Pacific
- 4.2.4 LATAM
- 4.2.5 MEA
- 4.3 Competitive analysis of major market players
- 4.4 Competitive positioning matrix
- 4.5 Strategic outlook matrix
- 4.6 Key developments
- 4.6.1 Mergers & acquisitions
- 4.6.2 Partnerships & collaborations
- 4.6.3 New product launches
- 4.6.4 Expansion plans and funding
Chapter 5 Market Estimates & Forecast, By Functionality, 2022 - 2035 ($Bn, Units)
- 5.1 Key trends
- 5.2 Fleet management software
- 5.3 Autonomous driving
- 5.4 Traffic management
- 5.5 Passenger management
- 5.6 Safety & security
- 5.7 Bus route design
Chapter 6 Market Estimates & Forecast, By Level of Automation, 2022 - 2035 ($Bn, Units)
- 6.1 Key trends
- 6.2 Level 3
- 6.3 Level 4
- 6.4 Level 5
Chapter 7 Market Estimates & Forecast, By Deployment model, 2022 - 2035 ($Bn, Units)
- 7.1 Key trends
- 7.2 On premises
- 7.3 Cloud-based
- 7.4 Hybrid
Chapter 8 Market Estimates & Forecast, By Application, 2022 - 2035 ($Bn, Units)
- 8.1 Key trends
- 8.2 Public transport
- 8.3 Campus and corporate shuttles
- 8.4 Airport shuttles
- 8.5 Others
Chapter 9 Market Estimates & Forecast, By End Use, 2022 - 2035 ($Bn, Units)
- 9.1 Key trends
- 9.2 Public transportation authorities
- 9.3 Private transport operators
- 9.4 Corporate fleets
Chapter 10 Market Estimates & Forecast, By Region, 2022 - 2035 ($Bn, Units)
- 10.1 North America
- 10.1.1 US
- 10.1.2 Canada
- 10.2 Europe
- 10.2.1 UK
- 10.2.2 Germany
- 10.2.3 France
- 10.2.4 Italy
- 10.2.5 Spain
- 10.2.6 Belgium
- 10.2.7 Netherlands
- 10.2.8 Sweden
- 10.2.9 Russia
- 10.3 Asia Pacific
- 10.3.1 China
- 10.3.2 India
- 10.3.3 Japan
- 10.3.4 Australia
- 10.3.5 Singapore
- 10.3.6 South Korea
- 10.3.7 Vietnam
- 10.3.8 Indonesia
- 10.4 Latin America
- 10.4.1 Brazil
- 10.4.2 Mexico
- 10.4.3 Argentina
- 10.5 MEA
- 10.5.1 South Africa
- 10.5.2 Saudi Arabia
- 10.5.3 UAE
Chapter 11 Company Profiles
- 11.1 Global players
- 11.1.1 Baidu
- 11.1.2 EasyMile
- 11.1.3 Mobileye
- 11.1.4 NVIDIA
- 11.1.5 Yutong Bus
- 11.1.6 Volvo
- 11.1.7 Navya
- 11.1.8 Mercedes-Benz
- 11.1.9 BYD
- 11.1.10 Transdev
- 11.2 Region players
- 11.2.1 Karsan Otomotiv Sanayi
- 11.2.2 Scania
- 11.2.3 Continental
- 11.2.4 Aptiv
- 11.2.5 ZF Friedrichshafen
- 11.2.6 NFI
- 11.2.7 Keolis
- 11.2.8 New Flyer
- 11.2.9 Aurrigo International
- 11.2.10 Lilee Technology
- 11.3 Emerging players
- 11.3.1 WeRide
- 11.3.2 May Mobility
- 11.3.3 Local Motors
- 11.3.4 Sensible 4
- 11.3.5 Mozee
