
|
시장보고서
상품코드
1998785
상업용 냉각 계량기 시장 기회, 성장 촉진요인, 업계 동향 분석 및 예측(2026-2035년)Commercial Cooling Meters Market Opportunity, Growth Drivers, Industry Trend Analysis, and Forecast 2026 - 2035 |
||||||
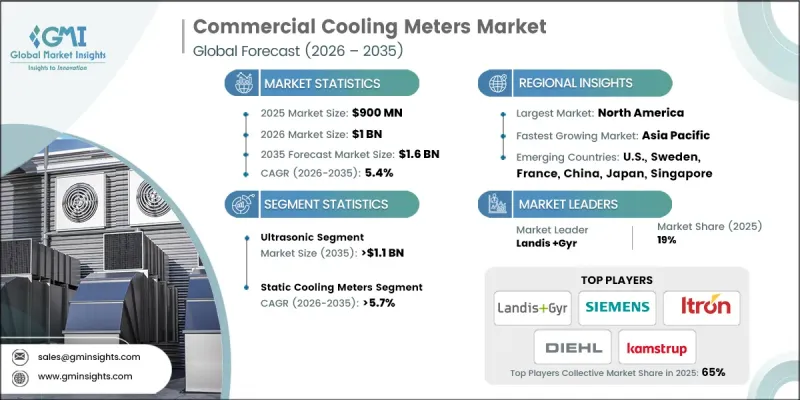
세계의 상업용 냉각 계량기 시장은 2025년에 9억 달러로 평가되었고, CAGR5.4%로 성장하여 2035년까지 16억 달러에 달할 것으로 예측됩니다.

이러한 성장은 오피스 단지, 리테일 공간, 숙박시설, 공공시설 등 상업용 부동산의 급속한 확장에 힘입어 에너지 관리 솔루션의 도입이 증가하고 있습니다. 시설 운영자는 상업용 냉각 계량기를 활용하여 에너지 소비량을 정확하게 파악하고, 냉각 배분을 최적화하며, 비효율적인 부분을 파악하여 시스템 성능을 개선할 수 있습니다. 이 미터는 냉수 및 기타 냉각 매체를 포함한 HVAC 시스템에서 냉각에 소비되는 에너지를 측정하여 다중 테넌트 과금 및 지역 냉방 네트워크에 필수적인 정확한 정량화를 제공합니다. 오래된 건물의 스마트화 및 개조 공사 트렌드와 더불어 규제 압력 및 에너지 효율화로의 전환이 결합되어 시장 보급을 더욱 촉진하고 있습니다. 최신 스마트 미터는 장기적인 정확성, 내구성 및 원활한 통합을 통해 현대의 상업용 에너지 관리 전략에 필수적인 요소로 자리 잡고 있습니다.
| 시장 범위 | |
|---|---|
| 개시 연도 | 2025년 |
| 예측 기간 | 2026-2035년 |
| 개시 금액 | 9억 달러 |
| 예측 금액 | 16억 달러 |
| CAGR | 5.4% |
초음파 냉각계 시장은 2035년까지 11억 달러에 달할 것으로 예측됩니다. 이 미터는 신뢰성, 고정밀 측정, 비침습적 설치로 인기를 끌고 있으며, 냉각 사용량에 대한 상세한 가시성을 제공하면서 가동 중단 없이 운영할 수 있다는 장점이 있습니다. 안정적인 성능으로 실시간 모니터링과 데이터 기반 에너지 최적화가 필요한 상업용 건물에 적합합니다.
정적 냉각 계량기 시장은 2035년까지 연평균 복합 성장률(CAGR) 5.7%를 나타낼 것으로 예측됩니다. 이 미터는 유량과 에너지 사용량을 정확하게 측정하고, 디지털 냉각 네트워크의 자동 제어 전략과 실시간 모니터링을 지원합니다. 이러한 상세한 데이터를 통해 시설 관리자는 시스템의 효율성을 최적화할 수 있으며, 현대식 상업시설의 도입 확대에 기여하고 있습니다.
미국의 상업용 냉각 계량기 시장은 2035년까지 6억 4,120만 달러에 달할 것으로 예측됩니다. 이러한 성장은 스마트 빌딩, 자동화된 성능 모니터링, 데이터 기반 에너지 관리 등의 노력에 의해 주도되고 있습니다. 건축 기준과 에너지 효율 규제가 강화되면서 정확한 계측 솔루션에 대한 수요가 증가하고 있습니다. IoT 지원 인프라와의 통합은 시스템 인텔리전스 및 운영 효율성을 향상시켜 시장 경쟁력을 강화하는 동시에 상업용 냉각 기술에 대한 추가 투자를 촉진하고 있습니다.
자주 묻는 질문
목차
제1장 조사 방법과 범위
제2장 주요 요약
제3장 업계 인사이트
제4장 경쟁 구도
제5장 시장 규모와 예측 : 제품별, 2022년-2035년
제6장 시장 규모와 예측 : 기술별, 2022년-2035년
제7장 시장 규모와 예측 : 용도별, 2022년-2035년
제8장 시장 규모와 예측 : 지역별, 2022년-2035년
제9장 기업 개요
LSH 26.04.23The Global Commercial Cooling Meters Market was valued at USD 900 million in 2025 and is estimated to grow at a CAGR of 5.4% to reach USD 1.6 billion by 2035.
The growth is fueled by the rapid expansion of commercial real estate, including office complexes, retail spaces, hospitality projects, and institutional buildings, which are increasingly adopting energy management solutions. Facility operators are leveraging commercial cooling meters to gain precise insights into energy consumption, optimize cooling distribution, identify inefficiencies, and enhance system performance. These meters measure energy used for cooling within HVAC systems, including chilled water and other cooling media, providing accurate quantification critical for multi-tenant billing and district cooling networks. The trend toward smart and retrofit installations in older buildings, combined with regulatory pressures and the shift toward energy efficiency, is further driving market adoption. Modern smart meters also enable long-term precision, durability, and seamless integration, making them indispensable for contemporary commercial energy management strategies.
| Market Scope | |
|---|---|
| Start Year | 2025 |
| Forecast Year | 2026-2035 |
| Start Value | $900 Million |
| Forecast Value | $1.6 Billion |
| CAGR | 5.4% |
The ultrasonic cooling meter segment is expected to reach USD 1.1 billion by 2035. These meters are gaining popularity due to their reliability, high-precision readings, and non-intrusive installation, allowing uninterrupted operation while providing detailed visibility into cooling usage. Their consistent performance makes them ideal for commercial buildings requiring real-time monitoring and data-driven energy optimization.
The static cooling meters segment is projected to grow at a CAGR of 5.7% by 2035. They provide precise measurements of flow and energy usage, supporting automated control strategies and real-time monitoring in digital cooling networks. This granular data enables facility managers to optimize system efficiency, contributing to broader adoption across modern commercial developments.
U.S. Commercial Cooling Meters Market is anticipated to reach USD 641.2 million by 2035. The growth is driven by smart building initiatives, automated performance monitoring, and data-driven energy management. Stricter enforcement of building codes and energy efficiency regulations is increasing demand for accurate metering solutions. Integration with IoT-enabled infrastructure enhances system intelligence and operational efficiency, strengthening the competitiveness of the market while encouraging further investment in commercial cooling technologies.
Key players operating in the Global Commercial Cooling Meters Market include Danfoss, Siemens, Honeywell International, Kamstrup, Schneider Electric, Apator Group, Sensus, Landis+Gyr, Qundis, ista Energy Solutions, BMETERS, Secure Meters, Axioma Metering, Techem, Sontex, Badger Meter, Diehl Stiftung & Co. KG, Itron, and Integra Metering. Key strategies adopted by companies in the Global Commercial Cooling Meters Market include focusing on R&D to develop high-accuracy, durable, and IoT-compatible meters. Manufacturers are investing in smart meter technologies that integrate with building management systems for real-time monitoring and energy optimization. Strategic partnerships with commercial developers and energy service providers expand distribution networks and adoption in retrofit projects. Companies are emphasizing compliance with evolving energy regulations and sustainability standards to gain market trust. Offering scalable solutions, predictive maintenance features, and value-added services strengthens customer loyalty while differentiating products from competitors in a highly competitive landscape.
Table of Contents
Chapter 1 Methodology & Scope
- 1.1 Research design
- 1.2 Quality commitment
- 1.2.1 GMI AI policy & data integrity commitment
- 1.2.1.1 Source consistency protocol
- 1.2.1 GMI AI policy & data integrity commitment
- 1.3 Research trail & Confidence Scoring
- 1.3.1 Research trail components
- 1.3.2 Scoring components
- 1.4 Data Collection
- 1.4.1 Partial list of primary sources
- 1.5 Data mining sources
- 1.5.1 Paid sources
- 1.5.1.1 Sources, by region
- 1.5.1 Paid sources
- 1.6 Base estimates and calculations
- 1.6.1 Base year calculation for any one approach
- 1.7 Forecast model
- 1.8 Research transparency addendum
- 1.8.1 Source attribution framework
- 1.8.2 Quality assurance metrics
- 1.8.3 Our commitment to trust
- 1.9 Market definitions
Chapter 2 Executive Summary
- 2.1 Industry synopsis, 2022 - 2035
- 2.2 Business trends
- 2.3 Product trends
- 2.4 Technology trends
- 2.5 Application trends
- 2.6 Regional trends
Chapter 3 Industry Insights
- 3.1 Industry ecosystem
- 3.2 Regulatory landscape
- 3.3 Industry impact forces
- 3.3.1 Growth drivers
- 3.3.2 Industry pitfalls & challenges
- 3.4 Growth potential analysis
- 3.5 Porter's analysis
- 3.5.1 Bargaining power of suppliers
- 3.5.2 Bargaining power of buyers
- 3.5.3 Threat of new entrants
- 3.5.4 Threat of substitutes
- 3.6 PESTEL analysis
- 3.6.1 Political factors
- 3.6.2 Economic factors
- 3.6.3 Social factors
- 3.6.4 Technological factors
- 3.6.5 Legal factors
- 3.6.6 Environmental factors
- 3.7 Cost structure analysis
- 3.8 Price trend analysis, 2022-2035
- 3.8.1 By Product
- 3.8.2 By Region
- 3.9 Emerging opportunities & trends
- 3.9.1 Digitalization & IoT integration
- 3.10 Investment analysis & future outlook
Chapter 4 Competitive landscape, 2026
- 4.1 Introduction
- 4.2 Company market share analysis, by region, 2025
- 4.2.1 North America
- 4.2.2 Europe
- 4.2.3 Asia Pacific
- 4.2.4 Middle East
- 4.3 Competitive positioning matrix
- 4.4 Key developments
- 4.4.1 Mergers & acquisitions
- 4.4.2 Partnerships & collaborations
- 4.4.3 New product launches
- 4.4.4 Expansion plans & funding
Chapter 5 Market Size and Forecast, By Product, 2022 - 2035 (USD Million & ‘000 Units)
- 5.1 Key trends
- 5.2 Ultrasonic
- 5.3 Vortex
- 5.4 Others
Chapter 6 Market Size and Forecast, By Technology, 2022 - 2035 (USD Million & ‘000 Units)
- 6.1 Key trends
- 6.2 Mechanical
- 6.3 Static
Chapter 7 Market Size and Forecast, By Application, 2022 - 2035 (USD Million & ‘000 Units)
- 7.1 Key trends
- 7.2 College/University
- 7.3 Office building
- 7.4 Government building
- 7.5 Others
Chapter 8 Market Size and Forecast, By Region, 2022 - 2035 (USD Million & ‘000 Units)
- 8.1 Key trends
- 8.2 North America
- 8.2.1 U.S.
- 8.2.2 Canada
- 8.3 Europe
- 8.3.1 Germany
- 8.3.2 Poland
- 8.3.3 Sweden
- 8.3.4 Italy
- 8.3.5 France
- 8.3.6 Finland
- 8.3.7 Austria
- 8.3.8 Norway
- 8.4 Asia Pacific
- 8.4.1 China
- 8.4.2 Japan
- 8.4.3 South Korea
- 8.4.4 Singapore
- 8.4.5 India
- 8.5 Middle East
- 8.5.1 Saudi Arabia
- 8.5.2 UAE
- 8.5.3 Qatar
- 8.5.4 Oman
- 8.5.5 Kuwait
- 8.6 Rest of the world
Chapter 9 Company Profiles
- 9.1 Apator Group
- 9.2 Axioma Metering
- 9.3 Badger Meter
- 9.4 BMETERS
- 9.5 Danfoss
- 9.6 Diehl Stiftung & Co. KG
- 9.7 Honeywell International
- 9.8 Integra Metering
- 9.9 Itron
- 9.10 ista Energy Solutions
- 9.11 Kamstrup
- 9.12 Landis+Gyr
- 9.13 Qundis
- 9.14 Schneider Electric
- 9.15 Secure Meters
- 9.16 Sensus
- 9.17 Siemens
- 9.18 Sontex
- 9.19 Techem
- 9.20 Zenner International
