
|
시장보고서
상품코드
2019167
파워 스포츠 시장 기회, 성장요인, 업계 동향 분석 및 예측(2026-2035년)Power Sports Market Opportunity, Growth Drivers, Industry Trend Analysis, and Forecast 2026 - 2035 |
||||||
세계의 파워 스포츠 시장은 2025년에 290억 달러로 평가되었고, CAGR 4.6%로 성장하여 2035년까지 445억 달러에 이를 것으로 추정되고 있습니다.

세계적으로 아웃도어 레크리에이션과 어드벤처 지향적 활동이 지속적으로 증가함에 따라 이 산업은 꾸준히 성장하고 있습니다. 탐험형 체험과 레저용 모빌리티에 대한 소비자의 관심이 높아지면서 오프로드 및 수상 액티비티에 대한 참여가 확대되고 있습니다. 이러한 추세는 여러 부문에 걸친 파워 스포츠 차량 수요에 직접적인 영향을 미치고 있습니다. 아웃도어 라이프 스타일에 대한 관심이 높아지면서 성능 중심의 레크리에이션 장비를 찾는 소비자층이 확대되고 있습니다. 또한, 차량의 내구성과 성능의 향상으로 애호가뿐만 아니라 일반 사용자들 사이에서도 제품의 매력이 높아지고 있습니다. 또한, 레크리에이션용 모빌리티 솔루션에 대한 인식이 높아지고, 다양한 지형과 사용 목적에 맞는 다양한 차량이 출시되고 있는 것도 시장을 더욱 촉진하고 있습니다. 유통망 확대와 견조한 교체 수요도 지역을 불문하고 시장 확대를 지속하는 데 중요한 역할을 하고 있습니다.
| 시장 범위 | |
|---|---|
| 개시 연도 | 2025년 |
| 예측 기간 | 2026-2035년 |
| 개시 연도 시장 규모 | 290억 달러 |
| 예측 금액 | 445억 달러 |
| CAGR | 4.6% |
파워 스포츠 산업의 확장은 엔지니어링 및 차량 기술의 지속적인 발전에 큰 영향을 받고 있습니다. 각 제조업체들은 엔진 효율 향상, 서스펜션 시스템 개선, 첨단 안전 메커니즘의 통합에 중점을 두어 전반적인 승차감과 내구성을 향상시키기 위해 노력하고 있습니다. 다양한 지형과 운전 조건에서 성능을 최적화하기 위해 최신 구동계 시스템과 전자 제어 기능이 개발되고 있습니다. 이러한 혁신은 파워 스포츠 차량의 신뢰성과 기능성을 향상시켜 더 많은 사람들에게 매력적으로 다가갈 수 있도록 했습니다. 차량 제어의 고도화, 안정성 향상, 핸들링 성능의 개선은 보다 정교한 사용자 경험에 기여하고 있으며, 이는 장기적인 시장 성장에 기여하고 있습니다.
대형 오토바이 부문은 2025년에 50%의 점유율을 차지할 것으로 예상되며, 2026년부터 2035년까지 연평균 복합 성장률(CAGR) 4.2%를 나타낼 것으로 예측됩니다. 이 부문은 장거리 레크리에이션 주행 및 고성능 투어링 경험과의 강한 연관성으로 인해 계속해서 시장을 주도하고 있습니다. 이 카테고리의 모터사이클은 배기량, 안정성, 그리고 강력한 라이딩 경험을 제공할 수 있다는 점에서 널리 선호되고 있습니다. 소비자들은 레저 여행이나 성능에 중점을 둔 용도에서 점점 더 이러한 차량에 매력을 느끼고 있습니다. 편안함, 조작성, 내구성에 초점을 맞춘 지속적인 제품 개선이 이 부문 수요를 더욱 강화하고 있습니다. 레저 목적의 라이더와 애호가 모두의 니즈를 충족시킬 수 있다는 점이 시장에서 이 부문의 선도적 지위를 확고히 하고 있습니다.
가솔린 자동차 부문은 2025년 78%의 점유율을 차지했으며, 2035년까지 연평균 3.4%의 성장률을 보일 것으로 예측됩니다. 가솔린 자동차는 높은 출력과 빠른 가속과 같은 우수한 성능 특성으로 인해 여전히 주류의 지위를 유지하고 있습니다. 이 차량들은 신뢰성과 장거리 주행 효율성으로 인해 다양한 파워 스포츠 카테고리에서 널리 사용되고 있습니다. 소비자들은 다양한 지형과 가혹한 환경에서도 안정적인 성능을 발휘한다는 점에서 가솔린 엔진을 계속 선호하고 있습니다. 각 제조업체들은 성능 기준을 유지하면서 연비 효율을 높이기 위해 가솔린 엔진 시스템 개선에 주력하고 있으며, 이로 인해 부문 전체에서 수요가 지속될 것으로 예측됩니다.
미국 파워스포츠 시장은 85%의 점유율을 차지하며, 2025년 시장 규모는 131억 달러에 달할 것으로 예측됩니다. 이 나라 시장 성장은 아웃도어 레크리에이션에 대한 강한 문화와 레크리에이션용 차량 이용을 뒷받침하는 탄탄한 생태계에 의해 주도되고 있습니다. 소비자들은 육상 및 수상 활동에 적극적으로 참여하고 있으며, 이는 파워 스포츠 차량에 대한 안정적인 수요를 지속적으로 창출하고 있습니다. 광범위한 유통망와 다양한 제품 라인업이 시장 침투를 더욱 강화하고 있습니다. 또한, 제조업체의 강력한 존재감과 지속적인 제품 혁신이 꾸준한 성장세를 유지하는 데 기여하고 있습니다. 소비자의 관심, 접근성, 제품의 다양성 등이 결합되어 미국은 이 지역의 주요 시장으로서의 지위를 계속 유지하고 있습니다.
자주 묻는 질문
목차
제1장 조사 방법
제2장 주요 요약
제3장 업계 인사이트
제4장 경쟁 구도
제5장 시장 추산 및 예측 : 차량별, 2022-2035
제6장 시장 추산 및 예측 : 추진력별, 2022-2035
제7장 시장 추산 및 예측 : 용도별, 2022-2035
제8장 시장 추산 및 예측 : 최종사용자별, 2022-2035
제9장 시장 추산 및 예측 : 지역별, 2022-2035
제10장 기업 개요
LSH 26.05.08The Global Power Sports Market was valued at USD 29 billion in 2025 and is estimated to grow at a CAGR of 4.6% to reach USD 44.5 billion by 2035.
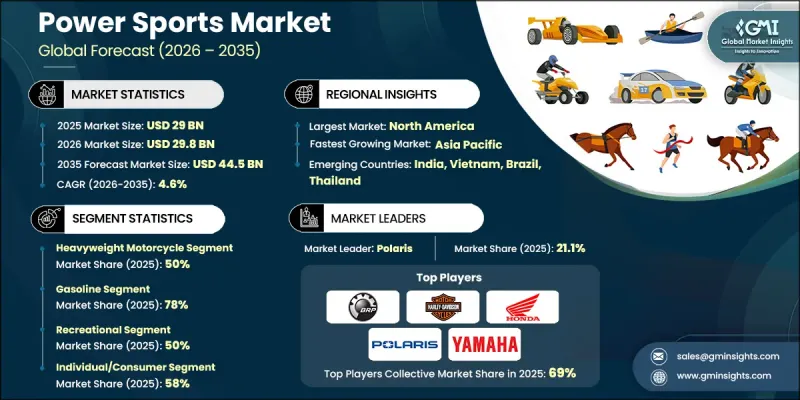
The industry is witnessing steady growth as outdoor recreation and adventure-driven activities continue to gain momentum worldwide. Rising consumer interest in exploration-based experiences and leisure mobility is encouraging greater participation in off-road and water-based activities. This trend is directly influencing the demand for power sports vehicles across multiple segments. Increasing engagement in outdoor lifestyles has also contributed to a broader consumer base seeking performance-oriented recreational equipment. In addition, improvements in vehicle durability and performance capabilities are enhancing product appeal among both enthusiasts and casual users. The market is further supported by growing awareness of recreational mobility solutions and the availability of a wide variety of vehicles tailored to different terrains and usage needs. Expanding distribution networks and strong replacement demand are also playing a key role in sustaining market expansion across regions.
| Market Scope | |
|---|---|
| Start Year | 2025 |
| Forecast Year | 2026-2035 |
| Start Value | $29 Billion |
| Forecast Value | $44.5 Billion |
| CAGR | 4.6% |
The expansion of the power sports industry is strongly influenced by continuous advancements in engineering and vehicle technology. Manufacturers are focusing on enhancing engine efficiency, refining suspension systems, and integrating advanced safety mechanisms to improve overall ride quality and durability. Modern drivetrain systems and electronic control features are being developed to optimize performance across varying terrains and operating conditions. These innovations are increasing the reliability and functionality of power sports vehicles, making them more appealing to a wider audience. Enhanced vehicle control, improved stability, and better handling capabilities are contributing to a more refined user experience, which continues to support long-term market growth.
The heavyweight motorcycle segment accounted for a share of 50% in 2025 and is expected to grow at a CAGR of 4.2% from 2026 to 2035. This segment continues to dominate due to its strong association with long-distance recreational riding and high-performance touring experiences. Motorcycles within this category are widely preferred for their engine capacity, stability, and ability to deliver a powerful riding experience. Consumers are increasingly drawn to these vehicles for leisure travel and performance-driven usage. Ongoing product enhancements focused on comfort, control, and durability are further strengthening demand within this segment. The segment's ability to cater to both recreational and enthusiast riders continues to reinforce its leading position in the market.
The gasoline segment held 78% share in 2025 and is projected to grow at a CAGR of 3.4% through 2035. Gasoline-powered vehicles remain dominant due to their strong performance characteristics, including higher power output and faster acceleration. These vehicles are widely used across different power sports categories because of their reliability and ability to operate efficiently over extended distances. Consumers continue to favor gasoline engines for their consistent performance across diverse terrains and challenging environments. Manufacturers are maintaining a strong focus on refining gasoline-powered systems to enhance fuel efficiency while preserving performance standards, ensuring sustained demand across the segment.
United States Power Sports Market accounted for 85% share, generating USD 13.1 billion in 2025. Market growth in the country is driven by a strong culture of outdoor recreation and a well-established ecosystem supporting recreational vehicle usage. Consumers actively engage in terrain-based and water-based activities, which continues to create consistent demand for power sports vehicles. The presence of an extensive dealership network and wide product availability further strengthens market penetration. Additionally, strong manufacturer presence and continuous product innovation contribute to maintaining steady growth. The combination of consumer interest, accessibility, and product diversity continues to position the United States as a leading market within the region.
Key players operating in the Global Power Sports Market include BRP, Yamaha Motor, Polaris, Honda Motor, Kawasaki Heavy, Suzuki Motor, Textron, CFMOTO, KYMCO, and Harley Davidson. Companies in the Global Power Sports Market are strengthening their position through continuous investment in product innovation and performance enhancement. They are focusing on developing advanced engine systems, improving fuel efficiency, and integrating smart technologies to deliver superior user experiences. Strategic expansion of distribution networks and dealership partnerships is helping companies increase market reach and customer accessibility. Firms are also emphasizing brand differentiation through design innovation and customization options to attract diverse consumer segments. In addition, manufacturers are prioritizing after-sales services and customer engagement initiatives to build long-term loyalty. Collaborations and partnerships aimed at technology development and supply chain optimization are further supporting competitive advantage and sustained growth.
Table of Contents
Chapter 1 Methodology
- 1.1 Research approach
- 1.2 Quality Commitments
- 1.2.1 GMI AI policy & data integrity commitment
- 1.2.1.1 Source consistency protocol
- 1.2.1 GMI AI policy & data integrity commitment
- 1.3 Research Trail & Confidence Scoring
- 1.3.1 Research Trail Components
- 1.3.2 Scoring Components
- 1.4 Data Collection
- 1.4.1 Partial list of primary sources
- 1.5 Data mining sources
- 1.5.1 Paid sources
- 1.5.1.1 Sources, by region
- 1.5.1 Paid sources
- 1.6 Base estimates and calculations
- 1.6.1 Base year calculation for any one approach
- 1.7 Forecast model
- 1.7.1 Quantified market impact analysis
- 1.7.1.1 Mathematical impact of growth parameters on forecast
- 1.7.1 Quantified market impact analysis
- 1.8 Research transparency addendum
- 1.8.1 Source attribution framework
- 1.8.2 Quality assurance metrics
- 1.8.3 Our commitment to trust
Chapter 2 Executive Summary
- 2.1 Industry 360° synopsis, 2022 - 2035
- 2.2 Key market trends
- 2.2.1 Regional
- 2.2.2 Vehicle
- 2.2.3 Propulsion
- 2.2.4 Application
- 2.2.5 End-User
- 2.3 TAM Analysis, 2026-2035
- 2.4 CXO perspectives: Strategic imperatives
Chapter 3 Industry Insights
- 3.1 Industry ecosystem analysis
- 3.1.1 Supplier landscape
- 3.1.2 Profit margin analysis
- 3.1.3 Cost structure
- 3.1.4 Value addition at each stage
- 3.1.5 Factor affecting the value chain
- 3.1.6 Disruptions
- 3.2 Industry impact forces
- 3.2.1 Growth drivers
- 3.2.1.1 Growth in outdoor recreation participation
- 3.2.1.2 Expansion of adventure tourism
- 3.2.1.3 Product innovation and vehicle performance improvements
- 3.2.1.4 Rising recreational vehicle ownership
- 3.2.2 Industry pitfalls and challenges
- 3.2.2.1 High purchase and maintenance costs
- 3.2.2.2 Safety concerns and accident risks
- 3.2.3 Market opportunities
- 3.2.3.1 Growth of electric power sports vehicles
- 3.2.3.2 Expansion of recreational tourism parks
- 3.2.3.3 Development of connected and smart vehicles
- 3.2.1 Growth drivers
- 3.3 Growth potential analysis
- 3.4 Regulatory landscape
- 3.4.1 North America
- 3.4.1.1 United States off road vehicle safety and CPSC regulations
- 3.4.1.2 Federal land access and off road vehicle management policies
- 3.4.1.3 EPA emission standards for off road engines
- 3.4.1.4 Canada off road vehicle safety and registration requirements
- 3.4.2 Europe
- 3.4.2.1 EU vehicle type approval for motorcycles and off road vehicles
- 3.4.2.2 UNECE vehicle safety and braking regulations
- 3.4.2.3 National vehicle homologation and usage restrictions
- 3.4.2.4 Environmental and noise emission standards
- 3.4.3 Asia Pacific
- 3.4.3.1 China off road vehicle manufacturing and emission regulations
- 3.4.3.2 India quadricycle and motorcycle homologation standards
- 3.4.3.3 Japan vehicle safety and mobility regulations
- 3.4.3.4 Australia off road vehicle safety standards
- 3.4.3.5 ASEAN vehicle certification frameworks
- 3.4.4 Latin America
- 3.4.4.1 Brazil off road vehicle safety and environmental regulations
- 3.4.4.2 Argentina off road vehicle registration regulations
- 3.4.4.3 Mexico vehicle manufacturing and safety standards
- 3.4.4.4 Regional recreational vehicle regulatory frameworks
- 3.4.5 Middle East & Africa
- 3.4.5.1 UAE off road vehicle licensing regulations
- 3.4.5.2 Saudi Arabia vehicle safety inspection standards
- 3.4.5.3 South Africa off road vehicle registration standards
- 3.4.1 North America
- 3.5 Porter's analysis
- 3.6 PESTEL analysis
- 3.7 Technology and innovation landscape
- 3.7.1 Current technological trends
- 3.7.2 Emerging technologies
- 3.8 Pricing Analysis (Driven by primary research)
- 3.8.1 Historical Price Trend Analysis
- 3.8.2 Pricing Strategy by Player Type
- 3.9 Trade Data Analysis (Driven by paid database)
- 3.9.1 Import/export volume & value trends
- 3.9.2 Key trade corridors & tariff impact
- 3.10 Capacity & Production Landscape (Driven by primary research)
- 3.10.1 Installed Capacity by Region & Key Producer
- 3.10.2 Capacity Utilization Rates & Expansion Pipelines
- 3.11 Cost breakdown analysis
- 3.12 Patent analysis (Driven by primary research)
- 3.13 Sustainability and environmental aspects
- 3.13.1 Sustainable practices
- 3.13.2 Waste reduction strategies
- 3.13.3 Energy efficiency in production
- 3.13.4 Eco-friendly Initiatives
- 3.13.5 Carbon footprint considerations
- 3.14 Impact of AI and Generative AI on the Market
- 3.14.1 AI Driven Disruption of Existing Business Models
- 3.14.2 GenAI Use Cases and Adoption Roadmap by Segment
- 3.14.3 Risks Limitations and Regulatory Considerations
- 3.15 Forecast assumptions & scenario analysis (Driven by primary research)
- 3.15.1 Base Case- Key Macro & Industry Variables Driving CAGR
- 3.15.2 Optimistic Scenarios- Favorable macro and industry tailwinds
- 3.15.3 Pessimistic Scenario - Macroeconomic slowdown or industry headwinds
Chapter 4 Competitive Landscape, 2025
- 4.1 Introduction
- 4.2 Company market share analysis
- 4.2.1 North America
- 4.2.2 Europe
- 4.2.3 Asia Pacific
- 4.2.4 LATAM
- 4.2.5 MEA
- 4.3 Competitive analysis of major market players
- 4.4 Competitive positioning matrix
- 4.5 Key developments
- 4.5.1 Mergers & acquisitions
- 4.5.2 Partnerships & collaborations
- 4.5.3 New Product Launches
- 4.5.4 Expansion Plans and funding
Chapter 5 Market Estimates & Forecast, By Vehicle, 2022 - 2035 (USD Mn, Units)
- 5.1 Key trends
- 5.2 Side By Side Vehicle
- 5.3 All-Terrain Vehicle
- 5.4 Heavyweight Motorcycle
- 5.5 Personal Watercrafts
- 5.6 Snowmobile
Chapter 6 Market Estimates & Forecast, By Propulsion, 2022 - 2035 (USD Mn, Units)
- 6.1 Key trends
- 6.2 Gasoline
- 6.3 Diesel
- 6.4 Electric
Chapter 7 Market Estimates & Forecast, By Application, 2022 - 2035 (USD Mn, Units)
- 7.1 Key trends
- 7.2 Recreational
- 7.3 Utility
- 7.4 Commercial
- 7.5 Sports
- 7.6 Construction
- 7.7 Defense
Chapter 8 Market Estimates & Forecast, By End-User, 2022 - 2035 (USD Mn, Units)
- 8.1 Key trends
- 8.2 Individual/Consumer
- 8.3 Commercial
- 8.4 Government/Military
- 8.5 Rental/Tour Operators
- 8.6 Others
Chapter 9 Market Estimates & Forecast, By Region, 2022 - 2035 (USD Mn, Units)
- 9.1 Key trends
- 9.2 North America
- 9.2.1 US
- 9.2.2 Canada
- 9.3 Europe
- 9.3.1 Germany
- 9.3.2 UK
- 9.3.3 France
- 9.3.4 Italy
- 9.3.5 Spain
- 9.3.6 Russia
- 9.3.7 Norway
- 9.3.8 Netherlands
- 9.3.9 Sweden
- 9.4 Asia Pacific
- 9.4.1 China
- 9.4.2 India
- 9.4.3 Japan
- 9.4.4 Australia
- 9.4.5 South Korea
- 9.4.6 Singapore
- 9.4.7 Thailand
- 9.4.8 Indonesia
- 9.4.9 Vietnam
- 9.5 Latin America
- 9.5.1 Brazil
- 9.5.2 Mexico
- 9.5.3 Argentina
- 9.6 MEA
- 9.6.1 South Africa
- 9.6.2 Saudi Arabia
- 9.6.3 UAE
- 9.6.4 Turkey
Chapter 10 Company Profiles
- 10.1 Global Players
- 10.1.1 BRP
- 10.1.2 CFMOTO
- 10.1.3 Harley Davidson
- 10.1.4 Honda Motor
- 10.1.5 Kawasaki
- 10.1.6 KYMCO
- 10.1.7 Polaris
- 10.1.8 Suzuki Motor
- 10.1.9 Textron
- 10.1.10 Yamaha Motor
- 10.2 Regional Players
- 10.2.1 Argo
- 10.2.2 Hisun Motors
- 10.2.3 Linhai
- 10.2.4 Massimo Motor
- 10.2.5 TGB Taiwan Golden Bee
- 10.2.6 Tracker Off Road
- 10.3 Emerging Players Disruptors
- 10.3.1 DRR USA
- 10.3.2 ODES Industries
- 10.3.3 Segway Powersports
- 10.3.4 Volcon
