
|
시장보고서
상품코드
2027606
식물성 쇼트닝 : 시장 기회, 성장 촉진요인, 업계 동향 분석 및 예측(2026-2035년)Vegetable Shortening Market Opportunity, Growth Drivers, Industry Trend Analysis, and Forecast 2026 - 2035 |
||||||
세계의 식물성 쇼트닝 시장은 2025년에 55억 달러로 평가되었고 CAGR 3.7%를 나타내 2035년까지 78억 달러에 이를 것으로 추정되고 있습니다.
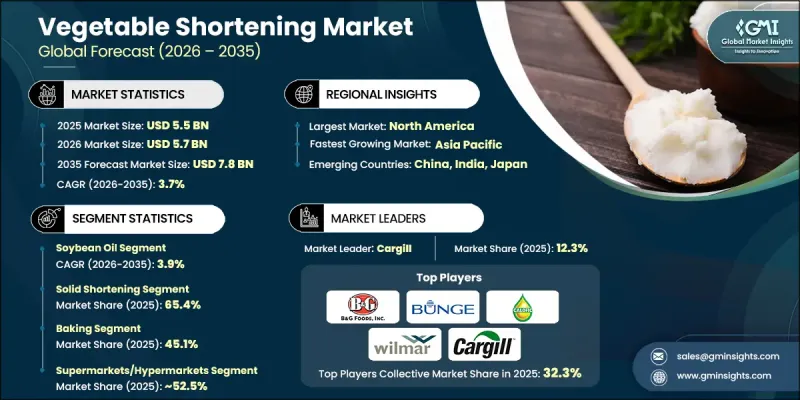
이 시장은 제빵 및 제과 산업과 외식 산업이 주도하고 있습니다. 이들 업계에서는 식물성 쇼트닝이 페이스트리, 쿠키, 케이크, 튀김 등에 부드럽고 바삭바삭한 식감을 부여하고 유통기한을 연장시켜준다는 점에서 높은 평가를 받고 있습니다. 건강과 웰빙에 대한 소비자의 인식이 높아지면서 트랜스지방산 무함유 및 비수소화 제품에 대한 수요가 증가하는 등 시장 역학에 영향을 미치고 있습니다. 식물성 및 비건 식단의 인기가 높아짐에 따라 지속 가능하고 깨끗한 라벨, 유전자 변형이 없는 쇼트닝 제품에 대한 수요가 가속화되고 있습니다. 제품 배합의 혁신과 식품 가공에서의 용도 확대가 지속적인 성장을 뒷받침하고 있습니다. 시장 확대는 주로 두 가지 요인에 의해 주도되고 있습니다. 현대인의 식생활과 라이프스타일 트렌드에 맞추어 더 건강하고 편리하며 식물성 대체품을 찾는 소비자가 증가함에 따라 즉석에서 먹을 수 있는 제과류 소비가 증가하고 있으며, 가정 내 베이킹 활동이 급증하고 있다는 것입니다.
| 시장 범위 | |
|---|---|
| 시작 연도 | 2025년 |
| 예측 기간 | 2026-2035년 |
| 개시 연도 시장 규모 | 55억 달러 |
| 예측액 | 78억 달러 |
| CAGR | 3.7% |
대두유 부문은 40.5%의 점유율을 차지하고 있으며, 2035년까지 연평균 복합 성장률(CAGR) 3.9%를 나타낼 것으로 예측됩니다. 식물성 쇼트닝의 원료는 콩기름, 팜유, 면실유, 해바라기유 등 매우 다양합니다. 팜유는 가성비와 뛰어난 안정성으로 인해 널리 사용되고 있지만, 콩기름은 영양학적 장점과 다양한 식품에 폭넓게 활용되는 장점으로 인해 여전히 인기를 끌고 있습니다.
고형 쇼트닝 부문은 2025년 65.4%의 점유율을 차지했으며, 2026년부터 2035년까지 연평균 복합 성장률(CAGR) 3.8%를 나타낼 것으로 예측됩니다. 소비자의 기호 변화에 따라 편의성, 다양성, 기능성이 강조되면서 고형 쇼트닝은 제빵 및 튀김용 제품에서 선도적인 지위를 유지하고 있습니다. 일관된 식감, 장기적인 신선도 유지 및 사용 편의성을 제공할 수 있다는 점이 제빵업체와 식품 가공업체에서 그 우위를 강화하고 있습니다.
북미의 식물성 쇼트닝 시장은 2025년에 34.7%의 점유율을 차지했습니다. 이 지역은 높은 소비자 의식과 바로 먹을 수 있는 구운 과자 및 스낵에 대한 수요에 힘입어 성장세를 보이고 있습니다. 북미 내에서는 미국이 가장 큰 점유율을 차지하고 있으며, 이는 제빵, 튀김, 스낵 제조에 식물성 쇼트닝이 광범위하게 사용되고 있기 때문입니다. 기업들은 건강을 중시하는 소비자의 기호에 부응하기 위해 클린 라벨, 식물 유래, 비 유전자 변형(Non-GMO) 제품 생산을 확대되고 있습니다. 비건 및 채식주의 식단의 확산으로 식물성 쇼트닝에 대한 수요가 더욱 증가하고 있으며, 북미는 주요 성장 거점 지역으로 자리매김하고 있습니다.
자주 묻는 질문
목차
제1장 조사 방법과 범위
제2장 주요 요약
제3장 업계 인사이트
제4장 경쟁 구도
제5장 시장 추산 및 예측 : 소스별(2022-2035년)
제6장 시장 추산 및 예측 : 형태별(2022-2035년)
제7장 시장 추산 및 예측 : 용도별(2022-2035년)
제8장 시장 추산 및 예측 : 유통 채널별(2022-2035년)
제9장 시장 추산 및 예측 : 지역별(2022-2035년)
제10장 기업 개요
KTH 26.05.20The Global Vegetable Shortening Market was valued at USD 5.5 billion in 2025 and is estimated to grow at a CAGR of 3.7% to reach USD 7.8 billion by 2035.

The market is driven by the baking and food service industries, where vegetable shortening is prized for producing soft, flaky textures in pastries, cookies, cakes, and deep-fried foods while extending shelf life. Rising consumer awareness of health and wellness is influencing market dynamics, with increasing preference for trans fat-free and non-hydrogenated formulations. The growing popularity of plant-based and vegan diets is accelerating demand for sustainable, clean-label, and non-GMO shortening products. Innovation in product formulations and expanding applications in food processing support sustained growth. Market expansion is fueled by two primary factors: the rising consumption of ready-to-eat baked goods and the surge in home baking activities, as consumers seek healthier, convenient, and plant-based alternatives that meet modern dietary and lifestyle trends.
| Market Scope | |
|---|---|
| Start Year | 2025 |
| Forecast Year | 2026-2035 |
| Start Value | $5.5 Billion |
| Forecast Value | $7.8 Billion |
| CAGR | 3.7% |
The soybean oil segment held a 40.5% share and is expected to grow at a CAGR of 3.9% through 2035. Vegetable shortening sources are highly diverse, including soybean oil, palm oil, cottonseed oil, and sunflower oil. Palm oil remains widely used due to its cost-effectiveness and excellent stability, while soybean oil retains its popularity for nutritional benefits and versatile applications across various food products.
The solid shortening segment accounted for 65.4% share in 2025 and is projected to grow at a CAGR of 3.8% between 2026 and 2035. Shifts in consumer preferences have emphasized convenience, versatility, and functional performance, with solid shortening maintaining a leading position in baking and frying applications. Its ability to deliver consistent textures, prolonged freshness, and ease of use reinforces its dominance among bakers and food processors.
North America Vegetable Shortening Market represented 34.7% share in 2025. The region benefits from high consumer awareness and demand for ready-to-eat baked goods and snacks. The United States accounts for the largest share within the region, driven by widespread use of vegetable shortening in baking, frying, and snack production. Companies are increasingly producing clean-label, plant-based, non-GMO products to align with health-conscious consumer preferences. Rising adoption of vegan and vegetarian diets further supports demand for plant-based shortening, making North America a key growth hub.
Major players in the Global Vegetable Shortening Market include Ventura Foods, NIRMALA AVIJAYA GROUP, Bunge, Wilmar International Ltd, Spectrum Naturals, CALOFIC, Cargill, B&G Foods, Stratas Foods, GOLDEN HOPE - NHA BE EDIBLE OILS CO., LTD, and Manildra Group. Companies in the A are strengthening their position through several strategies, including product innovation, expanding plant-based and non-GMO portfolios, and focusing on clean-label formulations. Manufacturers invest in research and development to create healthier, trans fat-free options while maintaining functional performance. Expanding distribution networks across retail and food service channels enhances market penetration. Strategic partnerships with bakeries, restaurants, and food processors improve visibility and adoption. Companies also leverage marketing campaigns emphasizing sustainability, nutritional benefits, and versatile applications. Investments in advanced production technologies reduce costs and improve product consistency. Continuous consumer engagement, education, and adaptation to dietary trends ensure brand loyalty and long-term competitive advantage in the evolving market.
Table of Contents
Chapter 1 Methodology & Scope
- 1.1 Market scope and definition
- 1.2 Research design
- 1.2.1 Research approach
- 1.2.2 Data collection methods
- 1.3 Data mining sources
- 1.3.1 Global
- 1.3.2 Regional/Country
- 1.4 Base estimates and calculations
- 1.4.1 Base year calculation
- 1.4.2 Key trends for market estimation
- 1.5 Primary research and validation
- 1.5.1 Primary sources
- 1.6 Forecast model
- 1.7 Research assumptions and limitations
Chapter 2 Executive Summary
- 2.1 Industry 360° synopsis
- 2.2 Key market trends
- 2.2.1 Regional
- 2.2.2 Source
- 2.2.3 Form
- 2.2.4 Application
- 2.2.5 Distribution channel
- 2.3 TAM Analysis, 2026-2035
- 2.4 CXO perspectives: Strategic imperatives
- 2.4.1 Executive decision points
Chapter 3 Industry Insights
- 3.1 Industry ecosystem analysis
- 3.1.1 Supplier landscape
- 3.1.2 Profit margin
- 3.1.3 Value addition at each stage
- 3.1.4 Factor affecting the value chain
- 3.1.5 Disruptions
- 3.2 Industry impact forces
- 3.2.1 Growth drivers
- 3.2.2 Industry pitfalls and challenges
- 3.2.3 Market opportunities
- 3.3 Growth potential analysis
- 3.4 Regulatory landscape
- 3.4.1 North America
- 3.4.2 Europe
- 3.4.3 Asia Pacific
- 3.4.4 Latin America
- 3.4.5 Middle East & Africa
- 3.5 Porter's analysis
- 3.6 PESTEL analysis
- 3.7 Price trends
- 3.7.1 By region
- 3.7.2 By type
- 3.8 Future market trends
- 3.9 Technology and Innovation landscape
- 3.9.1 Current technological trends
- 3.9.2 Emerging technologies
- 3.10 Patent Landscape
- 3.11 Trade statistics (HS code)
- 3.11.1 Major importing countries
- 3.11.2 Major exporting countries
- 3.12 Sustainability and environmental aspects
- 3.12.1 Sustainable practices
- 3.12.2 Waste reduction strategies
- 3.12.3 Energy efficiency in production
- 3.12.4 Eco-friendly initiatives
- 3.13 Carbon footprint consideration
Chapter 4 Competitive Landscape, 2025
- 4.1 Introduction
- 4.2 Company market share analysis
- 4.2.1 By region
- 4.2.1.1 North America
- 4.2.1.2 Europe
- 4.2.1.3 Asia Pacific
- 4.2.1.4 LATAM
- 4.2.1.5 MEA
- 4.2.1 By region
- 4.3 Company matrix analysis
- 4.4 Competitive analysis of major market players
- 4.5 Competitive positioning matrix
- 4.6 Key developments
- 4.6.1 Mergers & acquisitions
- 4.6.2 Partnerships & collaborations
- 4.6.3 New Product Launches
- 4.6.4 Expansion Plans
Chapter 5 Market Estimates and Forecast, By Source, 2022-2035 (USD Billion) (Kilo Tons)
- 5.1 Key trends
- 5.2 Soybean oil
- 5.3 Palm oil
- 5.4 Cottonseed oil
- 5.5 Sunflower oil
- 5.6 Others
Chapter 6 Market Estimates and Forecast, By Form, 2022-2035 (USD Billion) (Kilo Tons)
- 6.1 Key trends
- 6.2 Solid shortening
- 6.3 Liquid shortening
- 6.4 Powdered shortening
Chapter 7 Market Estimates and Forecast, By Application, 2022-2035 (USD Billion) (Kilo Tons)
- 7.1 Key trends
- 7.2 Baking
- 7.3 Frying
- 7.4 Confectionery
- 7.5 Snacks & savory
- 7.6 Food processing
- 7.7 Others
Chapter 8 Market Estimates and Forecast, By Distribution Channel, 2022-2035 (USD Billion) (Kilo Tons)
- 8.1 Key trends
- 8.2 Supermarkets/hypermarkets
- 8.3 Convenience stores
- 8.4 Online retail
- 8.5 Specialty stores
- 8.6 Others
Chapter 9 Market Estimates and Forecast, By Region, 2022-2035 (USD Billion) (Kilo Tons)
- 9.1 Key trends
- 9.2 North America
- 9.2.1 U.S.
- 9.2.2 Canada
- 9.3 Europe
- 9.3.1 Germany
- 9.3.2 UK
- 9.3.3 France
- 9.3.4 Spain
- 9.3.5 Italy
- 9.3.6 Rest of Europe
- 9.4 Asia Pacific
- 9.4.1 China
- 9.4.2 India
- 9.4.3 Japan
- 9.4.4 Australia
- 9.4.5 South Korea
- 9.4.6 Rest of Asia Pacific
- 9.5 Latin America
- 9.5.1 Brazil
- 9.5.2 Mexico
- 9.5.3 Argentina
- 9.5.4 Rest of Latin America
- 9.6 Middle East and Africa
- 9.6.1 Saudi Arabia
- 9.6.2 South Africa
- 9.6.3 UAE
- 9.6.4 Rest of Middle East and Africa
Chapter 10 Company Profiles
- 10.1 B&G Foods, Inc.
- 10.2 Bunge
- 10.3 CALOFIC
- 10.4 Cargill
- 10.5 GOLDEN HOPE - NHA BE EDIBLE OILS CO., LTD
- 10.6 Manildra Group
- 10.7 NIRMALA AVIJAYA GROUP
- 10.8 Spectrum Naturals
- 10.9 Stratas Foods
- 10.10 Ventura Foods
- 10.11 Wilmar International
