
|
시장보고서
상품코드
2027607
귀금속 전자 폐기물 회수 : 시장 기회, 성장 촉진요인, 업계 동향 분석 및 예측(2026-2035년)Precious Metals E-Waste Recovery Market Opportunity, Growth Drivers, Industry Trend Analysis, and Forecast 2026 - 2035 |
||||||
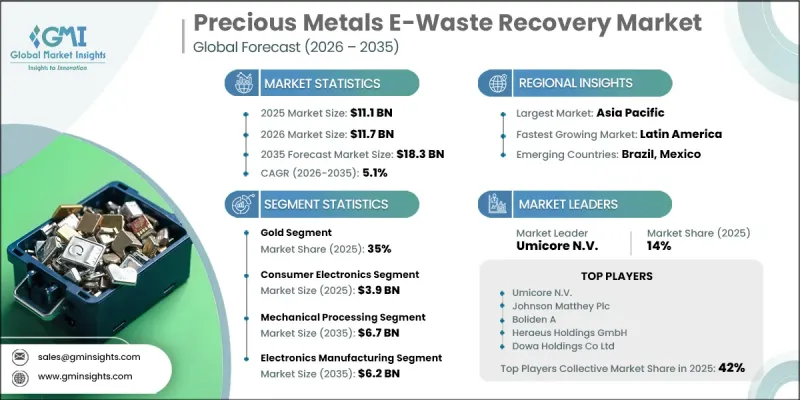
세계의 귀금속 전자 폐기물 회수 시장은 2025년에 111억 달러로 평가되었고 CAGR 5.1%를 나타내 2035년까지 183억 달러에 이를 것으로 추정되고 있습니다.
지속가능성에 대한 강조와 기술 발전이 회수 방식을 재구성하는 가운데, 시장은 꾸준히 변화하고 있습니다. 환경 친화적인 처리 방법에 대한 관심이 높아지면서 높은 효율을 유지하면서 배출량을 최소화하는 첨단 기술의 도입이 촉진되고 있습니다. 동시에 로봇 공학, 센서 시스템, 데이터 기반 분석과 같은 자동화 기술을 통합하여 선별 정확도를 높이고 회수율을 높이며 수작업에 대한 의존도를 낮추고 있습니다. 회수 방법 중, 재료 분리의 기본 공정으로 기계적 처리가 여전히 주류이지만, 환경적 장점으로 인해 보다 진보된 방법이 점점 더 각광을 받고 있습니다. 지속가능성에 대한 관심이 높아지고 있음에도 불구하고, 전통적인 대규모 공정은 여전히 대량 처리에서 중요한 역할을 하고 있습니다. 최종 사용 산업 전반 수요는 여전히 견조하며, 특히 제조용으로 귀금속의 안정적인 공급을 필요로 하는 부문에서 수요가 두드러집니다. 지역별 동향을 살펴보면, 재료의 풍부한 공급과 산업의 성장으로 아시아태평양의 활동이 활발하며, 유럽, 북미가 그 뒤를 잇고 있습니다. 한편, 개발도상국도 세계 시장에서 점차 그 입지를 넓혀가고 있습니다.
| 시장 범위 | |
|---|---|
| 시작 연도 | 2025년 |
| 예측 기간 | 2026-2035년 |
| 개시 연도 시장 규모 | 111억 달러 |
| 예측액 | 183억 달러 |
| CAGR | 5.1% |
금 부문은 2025년 35% 점유율을 차지했으며, 2035년까지 연평균 4.7%의 성장률을 나타낼 것으로 예측됩니다. 높은 경제적 가치와 전자부품에 광범위하게 사용되어 시장 내에서 회수되는 가장 주요한 소재가 되었으며, 재활용 사업 전반에 걸쳐 안정적인 수요를 견인하고 있습니다.
가전제품 부문은 2025년 39억 달러 시장 규모를 기록했으며, 2026년부터 2035년까지 연평균 5%의 성장률을 나타낼 것으로 전망됩니다. 전자제품에 대한 견조한 수요는 회수 가능한 재료의 양에 크게 기여하고 있으며, 이 부문의 지속적인 성장을 뒷받침하고 시장 내 선도적 지위를 강화하고 있습니다.
북미의 귀금속 전자 폐기물 회수 시장은 2026년부터 2035년까지 연평균 7%의 성장률을 나타낼 것으로 예측됩니다. 이 지역의 성장은 엄격한 환경 규제, 잘 정비된 재활용 인프라, 지속 가능한 폐기물 관리 방식에 대한 인식이 높아진 덕분입니다. 기존 업계 진입자들의 존재가 시장을 더욱 강화하는 한편, 순환 경제 이니셔티브의 확대 채택과 지속적인 기술 발전이 장기적인 확장에 기여하고 있습니다.
자주 묻는 질문
목차
제1장 조사 방법과 범위
제2장 주요 요약
제3장 업계 인사이트
제4장 경쟁 구도
제5장 시장 추산 및 예측 : 귀금속 유형별(2022-2035년)
제6장 시장 추산 및 예측 : 원료별(2022-2035년)
제7장 시장 추산 및 예측 : 회수 프로세스별(2022-2035년)
제8장 시장 추산 및 예측 : 최종 용도별(2022-2035년)
제9장 시장 추산 및 예측 : 지역별(2022-2035년)
제10장 기업 개요
KTH 26.05.20The Global Precious Metals E-Waste Recovery Market was valued at USD 11.1 billion in 2025 and is estimated to grow at a CAGR of 5.1% to reach USD 18.3 billion by 2035.

The market is undergoing a steady transformation as sustainability priorities and technological progress reshape recovery practices. Increasing focus on environmentally responsible processing methods is encouraging the adoption of advanced techniques that minimize emissions while maintaining high efficiency. At the same time, the integration of automation technologies such as robotics, sensor systems, and data-driven analytics is improving sorting accuracy, enhancing recovery yields, and reducing reliance on manual labor. Among recovery approaches, mechanical processing continues to dominate as a foundational step for material separation, while more advanced methods are gaining momentum due to their environmental advantages. Traditional large-scale processes remain relevant for high-volume operations despite growing sustainability concerns. Demand across end-use industries remains strong, particularly from sectors that require a consistent supply of precious metals for manufacturing applications. Regional dynamics highlight strong activity in Asia Pacific due to high material availability and industrial growth, followed by Europe and North America, while developing regions are gradually expanding their presence in the global landscape.
| Market Scope | |
|---|---|
| Start Year | 2025 |
| Forecast Year | 2026-2035 |
| Start Value | $11.1 Billion |
| Forecast Value | $18.3 Billion |
| CAGR | 5.1% |
The gold segment accounted for 35% share in 2025 and is expected to grow at a CAGR of 4.7% through 2035. Its high economic value and widespread utilization in electronic components make it the most prominent material recovered within the market, driving consistent demand across recycling operations.
The consumer electronics segment generated USD 3.9 billion in 2025 and is projected to grow at a CAGR of 5% from 2026 to 2035. Strong demand for electronic devices contributes significantly to the volume of recoverable materials, supporting continuous growth in this segment and reinforcing its leading position within the market.
North America Precious Metals E-Waste Recovery Market is expected to grow at a CAGR of 7% during 2026-2035. Growth in the region is supported by stringent environmental regulations, well-developed recycling infrastructure, and increasing awareness of sustainable waste management practices. The presence of established industry participants further strengthens the market, while growing adoption of circular economy initiatives and continued technological advancements are contributing to long-term expansion.
Key companies operating in the Global Precious Metals E-Waste Recovery Market include Umicore NV, Johnson Matthey Plc, Boliden AB, Heraeus Holding GmbH, DOWA Holding Co., Ltd, Tanaka Precious Metals, Sims Limited, Materion Corporation, TES-AMM Pte. Ltd., and EnviroLeach Technologies Inc. Companies in the Precious Metals E-Waste Recovery Market are focusing on strengthening their competitive position through technological innovation and strategic expansion. Significant investments are being made in advanced recovery technologies to improve efficiency, reduce environmental impact, and enhance metal recovery rates. Partnerships and collaborations are helping companies access new markets and expand operational capabilities. Firms are also investing in automation and digital solutions to optimize processing and reduce costs. Expanding recycling capacity and strengthening supply chain networks are key priorities to meet growing demand. Additionally, companies are aligning with regulatory standards and sustainability goals while developing circular economy strategies to ensure long-term growth and market leadership.
Table of Contents
Chapter 1 Methodology & Scope
- 1.1 Research approach
- 1.2 Quality Commitments
- 1.2.1 GMI AI policy & data integrity commitment
- 1.2.1.1 Source consistency protocol
- 1.2.1 GMI AI policy & data integrity commitment
- 1.3 Research Trail & Confidence Scoring
- 1.3.1 Research Trail Components
- 1.3.2 Scoring Components
- 1.4 Data Collection
- 1.4.1 Partial list of primary sources
- 1.5 Data mining sources
- 1.5.1 Paid sources
- 1.5.1.1 Sources, by region
- 1.5.1 Paid sources
- 1.6 Base estimates and calculations
- 1.6.1 Base year calculation for any one approach
- 1.7 Forecast model
- 1.7.1 Quantified market impact analysis
- 1.7.1.1 Mathematical impact of growth parameters on forecast
- 1.7.1 Quantified market impact analysis
- 1.8 Research transparency addendum
- 1.8.1 Source attribution framework
- 1.8.2 Quality assurance metrics
- 1.8.3 Our commitment to trust
Chapter 2 Executive Summary
- 2.1 Industry 360° synopsis
- 2.2 Key market trends
- 2.2.1 Regional
- 2.2.2 Precious Metal Type
- 2.2.3 Source
- 2.2.4 Recovery Process
- 2.2.5 End Use Industry
- 2.3 TAM Analysis, 2025-2035
- 2.4 CXO perspectives: Strategic imperatives
Chapter 3 Industry Insights
- 3.1 Industry ecosystem analysis
- 3.1.1 Supplier landscape
- 3.1.2 Profit margin
- 3.1.3 Value addition at each stage
- 3.1.4 Factor affecting the value chain
- 3.1.5 Disruptions
- 3.2 Industry impact forces
- 3.2.1 Growth drivers
- 3.2.2 Industry pitfalls and challenges
- 3.2.3 Market opportunities
- 3.3 Growth potential analysis
- 3.4 Regulatory landscape
- 3.4.1 North America
- 3.4.2 Europe
- 3.4.3 Asia Pacific
- 3.4.4 Latin America
- 3.4.5 Middle East & Africa
- 3.5 Porter's analysis
- 3.6 PESTEL analysis
- 3.7 Price trends
- 3.7.1 By region
- 3.7.2 By precious metal type
- 3.8 Future market trends
- 3.9 Technology and Innovation landscape
- 3.9.1 Current technological trends
- 3.9.2 Emerging technologies
- 3.10 Patent Landscape
- 3.11 Trade statistics (HS code)
- 3.11.1 Major importing countries
- 3.11.2 Major exporting countries
- 3.12 Sustainability and environmental aspects
- 3.12.1 Sustainable practices
- 3.12.2 Waste reduction strategies
- 3.12.3 Energy efficiency in production
- 3.12.4 Eco-friendly initiatives
Chapter 4 Competitive Landscape, 2025
- 4.1 Introduction
- 4.2 Company market share analysis
- 4.2.1 By region
- 4.2.1.1 North America
- 4.2.1.2 Europe
- 4.2.1.3 Asia Pacific
- 4.2.1.4 LATAM
- 4.2.1.5 MEA
- 4.2.1 By region
- 4.3 Company matrix analysis
- 4.4 Competitive analysis of major market players
- 4.5 Competitive positioning matrix
- 4.6 Key developments
- 4.6.1 Mergers & acquisitions
- 4.6.2 Partnerships & collaborations
- 4.6.3 New Product Launches
- 4.6.4 Expansion Plans
Chapter 5 Market Estimates and Forecast, By Precious Metal Type, 2022-2035 (USD Billion) (Kilo Tons)
- 5.1 Key trends
- 5.2 Gold
- 5.3 Silver
- 5.4 Platinum
- 5.5 Palladium
- 5.6 Rhodium
- 5.7 Others
Chapter 6 Market Estimates and Forecast, By Source, 2022-2035 (USD Billion) (Kilo Tons)
- 6.1 Key trends
- 6.2 Consumer Electronics
- 6.2.1 Smartphones
- 6.2.2 Laptops & Computers
- 6.2.3 Tablets
- 6.2.4 Televisions
- 6.2.5 Wearable devices
- 6.3 IT & Telecommunication Equipment
- 6.3.1 Servers & data center equipment
- 6.3.2 Networking hardware
- 6.3.3 Communication devices
- 6.4 Industrial Electronics
- 6.4.1 Industrial automation systems
- 6.4.2 Control panels
- 6.4.3 Sensors and instrumentation
- 6.5 Automotive Electronics
- 6.5.1 Electronic control units (ECUs)
- 6.5.2 Sensors and onboard electronics
- 6.5.3 EV battery management electronics
- 6.6 Medical Devices
- 6.6.1 Diagnostic equipment
- 6.6.2 Imaging systems
- 6.6.3 Monitoring devices
- 6.7 Household Appliances
- 6.7.1 Refrigerators
- 6.7.2 Washing machines
- 6.7.3 Microwaves
- 6.8 Others
Chapter 7 Market Estimates and Forecast, By Recovery Process, 2022-2035 (USD Billion) (Kilo Tons)
- 7.1 Key trends
- 7.2 Mechanical Processing
- 7.2.1 Shredding
- 7.2.2 Sorting
- 7.2.3 Magnetic separation
- 7.3 Hydrometallurgical Processes
- 7.3.1 Leaching
- 7.3.2 Solvent extraction
- 7.3.3 Ion exchange
- 7.4 Pyrometallurgical Processes
- 7.4.1 Smelting
- 7.4.2 Thermal treatment
- 7.5 Electrochemical Processes
- 7.5.1 Electrowinning
- 7.5.2 Electrorefining
- 7.6 Biotechnological Processes
- 7.6.1 Bioleaching
- 7.6.2 Microbial recovery
Chapter 8 Market Estimates and Forecast, By End Use, 2022-2035 (USD Billion) (Kilo Tons)
- 8.1 Key trends
- 8.2 Electronics Manufacturing
- 8.3 Automotive Industry
- 8.4 Aerospace & Defense
- 8.5 Healthcare Equipment Manufacturing
- 8.6 Jewelry & Precious Metal Refining
- 8.7 Others
Chapter 9 Market Estimates and Forecast, By Region, 2022-2035 (USD Billion) (Kilo Tons)
- 9.1 Key trends
- 9.2 North America
- 9.2.1 U.S.
- 9.2.2 Canada
- 9.3 Europe
- 9.3.1 Germany
- 9.3.2 UK
- 9.3.3 France
- 9.3.4 Spain
- 9.3.5 Italy
- 9.3.6 Rest of Europe
- 9.4 Asia Pacific
- 9.4.1 China
- 9.4.2 India
- 9.4.3 Japan
- 9.4.4 Australia
- 9.4.5 South Korea
- 9.4.6 Rest of Asia Pacific
- 9.5 Latin America
- 9.5.1 Brazil
- 9.5.2 Mexico
- 9.5.3 Argentina
- 9.5.4 Rest of Latin America
- 9.6 Middle East and Africa
- 9.6.1 Saudi Arabia
- 9.6.2 South Africa
- 9.6.3 UAE
- 9.6.4 Rest of Middle East and Africa
Chapter 10 Company Profiles
- 10.1 Umicore NV
- 10.2 Johnson Matthey Plc
- 10.3 Boliden A
- 10.4 Heraeus Holding GmbH
- 10.5 DOWA Holding Co., Ltd
- 10.6 Tanaka Precious Metals
- 10.7 Sims Limited
- 10.8 Materion Corporation
- 10.9 TES-AMM Pte. Ltd.
- 10.10 EnviroLeach Technologies Inc.
