
|
시장보고서
상품코드
2038642
완두콩 단백질 시장 : 시장 기회, 성장요인, 업계 동향 분석 및 예측(2026-2035년)Pea Protein Market Opportunity, Growth Drivers, Industry Trend Analysis, and Forecast 2026 - 2035 |
||||||
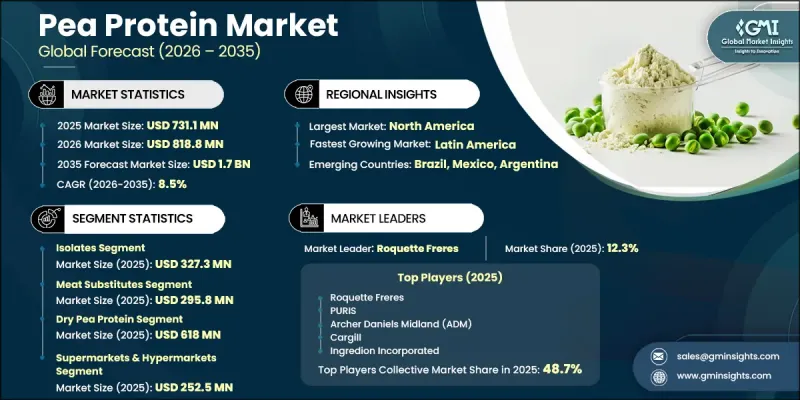
세계의 완두콩 단백질 시장은 2025년에 7억 3,110만 달러로 평가되었고, CAGR 8.5%로 성장할 전망이며, 2035년까지 17억 달러에 이를 것으로 예측됩니다.
소비자들이 점점 더 식물성 영양과 지속 가능한 식품 원료로 전환함에 따라 이 시장은 강한 추진력을 보이고 있습니다. 고도의 가공 기술로 노란 완두콩에서 추출한 완두콩 단백질은 소화흡수율이 높고, 균형 잡힌 아미노산 구성으로 다양한 식성 취향에 적합합니다. 제조 공정에서 영양가를 손상시키지 않고 분리 단백질, 농축 단백질, 텍스처드 제품 등 다양한 형태의 원료를 개발할 수 있습니다. 중성적인 맛과 기능적 다양성으로 인해 다양한 음료 및 식품 배합에 높은 적응력을 발휘합니다. 클린 라벨 제품 및 친환경 조달에 대한 인식이 높아짐에 따라 업계 전반의 채택이 계속 가속화되고 있습니다. 식품 제조업체들은 변화하는 소비자의 기대에 부응하고 식감, 안정성, 영양가를 향상시키기 위해 다양한 제품에 완두콩 단백질을 도입하고 있습니다. 또한, 완두콩 단백질은 일반적인 알레르겐을 포함하지 않기 때문에 알레르겐이 없는 원료에 대한 수요가 증가함에 따라 완두콩 단백질의 광범위한 보급을 뒷받침하고 있습니다. 지속적인 제품 혁신과 최소한의 가공으로 제조된 단백질 솔루션의 개발은 경쟁 구도를 더욱 형성하고 시장의 지속적인 성장을 주도하고 있습니다.
| 시장 범위 | |
|---|---|
| 개시 연도 | 2025년 |
| 예측 기간 | 2026-2035년 |
| 개시 연도 시장 규모 | 7억 3,110만 달러 |
| 예측 시장 규모 | 17억 달러 |
| CAGR | 8.5% |
2025년, 분리 단백질 부문은 3억 2,730만 달러를 차지했으며, 이는 시장에서의 선도적인 위치를 반영합니다. 용해성과 기능성이 개선된 고단백 식물성 원료에 대한 강한 수요가 이 부문의 확대에 기여하고 있습니다. 맛과 분산성 향상을 포함한 배합 품질의 지속적인 개선이 다양한 제품 용도에서의 활용 확대를 뒷받침하고 있습니다.
2025년 육류 대체품 부문은 2억 9,580만 달러 시장 규모를 기록했으며, 전체 시장 수요를 견인하는 데 중요한 역할을 했습니다. 완두콩 단백질은 바람직한 구조와 질감을 부여할 수 있는 특성으로 인해 대체 단백질 배합에 점점 더 많이 사용되고 있습니다. 소화가 잘되고 깨끗한 단백질 공급원에 대한 소비자들의 관심이 높아지면서 기능성 영양 카테고리 전체의 성장을 뒷받침하고 있습니다.
북미의 완두콩 단백질 시장은 2025년 2억 3,240만 달러로 평가되었고, 2035년까지 5억 3,160만 달러로 성장할 것으로 예측됩니다. 이 지역에서는 소비자들이 식생활 선택과 제품의 투명성에 대한 인식이 높아지면서 식물성 원료에 대한 수요가 증가하고 있습니다. 식품업체들은 클린 라벨 트렌드와 변화하는 소비 패턴에 대응하기 위해 제품 포트폴리오를 적극적으로 확장하고 있습니다.
자주 묻는 질문
목차
제1장 조사 방법 및 범위
제2장 주요 요약
제3장 업계 인사이트
제4장 경쟁 구도
제5장 시장 추산 및 예측 : 제품별(2022-2035년)
제6장 시장 추산 및 예측 : 용도별(2022-2035년)
제7장 시장 추산 및 예측 : 형태별(2022-2035년)
제8장 시장 추산 및 예측 : 유통 채널별(2022-2035년)
제9장 시장 추산 및 예측 : 지역별(2022-2035년)
제10장 기업 개요
AJY 26.06.11The Global Pea Protein Market was valued at USD 731.1 million in 2025 and is estimated to grow at a CAGR of 8.5% to reach USD 1.7 billion by 2035.

The market is gaining strong momentum as consumers increasingly shift toward plant-based nutrition and sustainable food ingredients. Pea protein, extracted from yellow peas through advanced processing techniques, delivers a well-balanced amino acid profile with high digestibility, making it suitable for diverse dietary preferences. The production process preserves nutritional integrity while enabling manufacturers to develop ingredients in multiple formats, including isolates, concentrates, and textured variants. Its neutral flavor and functional versatility make it highly adaptable across a wide range of food and beverage formulations. Growing awareness of clean-label products and environmentally responsible sourcing continues to accelerate adoption across industries. Food manufacturers are incorporating pea protein into various formulations to enhance texture, stability, and nutritional content while meeting evolving consumer expectations. Additionally, increasing demand for allergen-friendly ingredients is supporting widespread acceptance, as pea protein remains free from common allergens. Continuous product innovation and development of minimally processed protein solutions are further shaping the competitive landscape and driving sustained market growth.
| Market Scope | |
|---|---|
| Start Year | 2025 |
| Forecast Year | 2026-2035 |
| Start Value | $731.1 Million |
| Forecast Value | $1.7 Billion |
| CAGR | 8.5% |
The isolates segment accounted for USD 327.3 million in 2025, reflecting its leading position within the market. Strong demand for high-protein, plant-based ingredients with improved solubility and functional performance is contributing to segment expansion. Ongoing improvements in formulation quality, including enhanced taste and dispersibility, are supporting broader usage across multiple product applications.
The meat substitutes segment generated USD 295.8 million in 2025, highlighting its strong role in driving overall market demand. Pea protein is increasingly used in alternative protein formulations due to its ability to deliver desirable structure and consistency. Rising consumer interest in digestible, clean protein sources is also supporting growth across functional nutrition categories.
North America Pea Protein Market is expected to grow from USD 232.4 million in 2025 to USD 531.6 million by 2035. The region is witnessing increasing demand for plant-based ingredients as consumers become more conscious of dietary choices and product transparency. Food manufacturers are actively expanding product portfolios to align with clean-label trends and evolving consumption patterns.
Key companies operating in the Global Pea Protein Industry include Cargill, Axiom Foods, Kerry Group, Roquette Freres, Ingredion Incorporated, The Scoular Company, Burcon Nutrascience Corporation, A&B Ingredients, Emsland Group, Glanbia Plc, AGT Food and Ingredients, Archer Daniels Midland (ADM), Farbest Tallman Foods Corporation, Sotexpro, and PURIS. Companies in the Pea Protein Market are strengthening their market position through innovation, strategic partnerships, and global expansion initiatives. Many players are investing in advanced processing technologies to improve protein quality, functionality, and taste while reducing production costs. Collaborations with food and beverage manufacturers are enabling customized ingredient solutions tailored to specific applications. Firms are also focusing on expanding production capacity to meet rising global demand and ensure supply chain efficiency. Product diversification, including the development of clean-label and minimally processed offerings, is becoming a key competitive strategy. Additionally, companies are targeting emerging markets and enhancing distribution networks to increase their global footprint and capture new growth opportunities.
Table of Contents
Chapter 1 Methodology & Scope
- 1.1 Market scope and definition
- 1.2 Research design
- 1.2.1 Research approach
- 1.2.2 Data collection methods
- 1.3 Data mining sources
- 1.3.1 Global
- 1.3.2 Regional/Country
- 1.4 Base estimates and calculations
- 1.4.1 Base year calculation
- 1.4.2 Key trends for market estimation
- 1.5 Primary research and validation
- 1.5.1 Primary sources
- 1.6 Forecast model
- 1.7 Research assumptions and limitations
Chapter 2 Executive Summary
- 2.1 Industry 360° synopsis
- 2.2 Key market trends
- 2.2.1 Product
- 2.2.2 Application
- 2.2.3 Form
- 2.2.4 Distribution Channel
- 2.2.5 Regional
- 2.3 TAM Analysis, 2026-2035
- 2.4 CXO perspectives: Strategic imperatives
- 2.5 Future outlook and strategic recommendations
Chapter 3 Industry Insights
- 3.1 Industry ecosystem analysis
- 3.1.1 Supplier landscape
- 3.1.2 Profit margin
- 3.1.3 Value addition at each stage
- 3.1.4 Factor affecting the value chain
- 3.1.5 Disruptions
- 3.2 Industry impact forces
- 3.2.1 Growth drivers
- 3.2.1.1 Rising health consciousness & demand for dietary fiber
- 3.2.1.2 Growing prevalence of digestive & cardiovascular disorders
- 3.2.1.3 Increasing adoption in functional food & beverage application
- 3.2.2 Pitfalls/challenge
- 3.2.2.1 High price volatility due to agricultural & climatic dependence
- 3.2.2.2 Allergic reactions & occupational health concerns
- 3.2.3 Opportunities
- 3.2.3.1 Emerging applications in cosmetic & personal care industry
- 3.2.3.2 Growing demand for organic & certified psyllium products
- 3.2.1 Growth drivers
- 3.3 Growth potential analysis
- 3.4 Regulatory landscape
- 3.4.1 North America
- 3.4.2 Europe
- 3.4.3 Asia Pacific
- 3.4.4 Latin America
- 3.4.5 Middle East & Africa
- 3.5 Porter's analysis
- 3.6 PESTEL analysis
- 3.7 Technology and innovation landscape
- 3.7.1 Current technological trends
- 3.7.2 Emerging technologies
- 3.8 Price trends
- 3.8.1 By region
- 3.8.2 By product
- 3.9 Future market trends
- 3.10 Technology and innovation landscape
- 3.10.1 Current technological trends
- 3.10.2 Emerging technologies
- 3.11 Patent landscape
- 3.12 Trade statistics (HS code)
- 3.12.1 Major importing countries
- 3.12.2 Major exporting countries
- 3.13 Sustainability and environmental aspects
- 3.13.1 Sustainable practices
- 3.13.2 Waste reduction strategies
- 3.13.3 Energy efficiency in production
- 3.13.4 Eco-friendly initiatives
- 3.14 Carbon footprint consideration
Chapter 4 Competitive Landscape, 2025
- 4.1 Introduction
- 4.2 Company market share analysis
- 4.2.1 By region
- 4.2.1.1 North America
- 4.2.1.2 Europe
- 4.2.1.3 Asia Pacific
- 4.2.1.4 LATAM
- 4.2.1.5 MEA
- 4.2.1 By region
- 4.3 Company matrix analysis
- 4.4 Competitive analysis of major market players
- 4.5 Competitive positioning matrix
- 4.6 Key developments
- 4.6.1 Mergers & acquisitions
- 4.6.2 Partnerships & collaborations
- 4.6.3 New product launches
- 4.6.4 Expansion plans
Chapter 5 Market Estimates and Forecast, By Product, 2022-2035 (USD Million) (Kilo Tons)
- 5.1 Key trends
- 5.2 Isolates
- 5.3 Concentrates
- 5.4 Textured
Chapter 6 Market Estimates and Forecast, By Application, 2022-2035 (USD Million) (Kilo Tons)
- 6.1 Key trends
- 6.2 Meat substitutes
- 6.3 Nutraceuticals
- 6.4 Sport supplements
- 6.5 Others
Chapter 7 Market Estimates and Forecast, By Form, 2022-2035 (USD Million) (Kilo Tons)
- 7.1 Key trends
- 7.2 Dry pea protein
- 7.3 Liquid pea protein
Chapter 8 Market Estimates and Forecast, By Distribution Channel, 2022-2035 (USD Million) (Kilo Tons)
- 8.1 Key trends
- 8.2 Supermarkets & hypermarkets
- 8.3 Online/E-commerce
- 8.4 Pharmacies & drugstores
- 8.5 Others
Chapter 9 Market Estimates and Forecast, By Region, 2022-2035 (USD Million) (Kilo Tons)
- 9.1 Key trends
- 9.2 North America
- 9.2.1 U.S.
- 9.2.2 Canada
- 9.3 Europe
- 9.3.1 Germany
- 9.3.2 UK
- 9.3.3 France
- 9.3.4 Spain
- 9.3.5 Italy
- 9.3.6 Rest of Europe
- 9.4 Asia Pacific
- 9.4.1 China
- 9.4.2 India
- 9.4.3 Japan
- 9.4.4 Australia
- 9.4.5 South Korea
- 9.4.6 Rest of Asia Pacific
- 9.5 Latin America
- 9.5.1 Brazil
- 9.5.2 Mexico
- 9.5.3 Argentina
- 9.5.4 Rest of Latin America
- 9.6 Middle East and Africa
- 9.6.1 Saudi Arabia
- 9.6.2 South Africa
- 9.6.3 UAE
- 9.6.4 Rest of Middle East and Africa
Chapter 10 Company Profiles
- 10.1 A&B Ingredients
- 10.2 Burcon Nutrascience Corporation
- 10.3 Roquette Freres
- 10.4 Farbest Tallman Foods Corporation
- 10.5 Kerry Group
- 10.6 The Scoular Company
- 10.7 Sotexpro
- 10.8 Archer Daniels Midland (ADM)
- 10.9 Cargill
- 10.10 Glanbia Plc
- 10.11 Ingredion Incorporated
- 10.12 AGT Food and Ingredients
- 10.13 Axiom Foods
- 10.14 PURIS
- 10.15 Emsland Group
