

|
시장보고서
상품코드
2038648
PFAS 대체 화학제품 시장 기회, 성장요인, 업계 동향 분석 및 예측(2026-2035년)PFAS Alternative Chemicals Market Opportunity, Growth Drivers, Industry Trend Analysis, and Forecast 2026 - 2035 |
||||||

세계의 PFAS 대체 화학제품 시장은 2025년에 109억 달러로 평가되었고, 2035년까지 연평균 복합 성장률(CAGR) 11.7%로 성장하여 323억 달러에 이를 것으로 추정되고 있습니다.
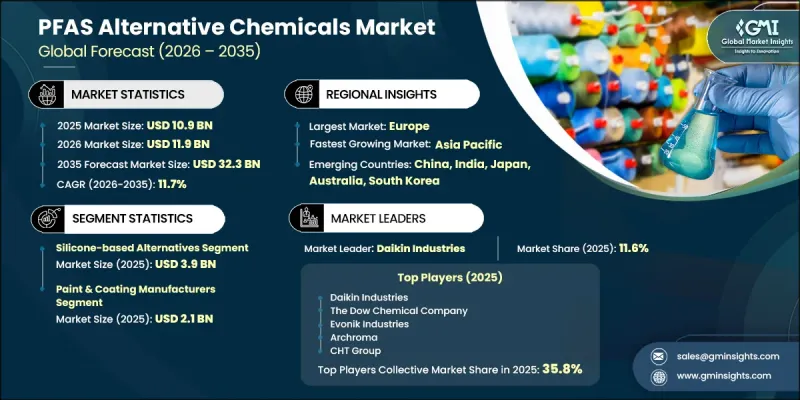
이 시장은 산업 및 상업용 용도에서 기존의 과불화화합물(PFAS) 및 폴리플루오로알킬물질(PFAS)을 대체할 수 있도록 설계된 첨단 화학 솔루션에 초점을 맞추었습니다. 이 차세대 대체품은 내습성, 내유성, 구조적 내구성, 가혹한 조건에서의 안정성 등 주요 성능 특성을 재현하도록 설계되었으며, 동시에 환경 내 잔류성을 크게 줄였습니다. 기업들은 제품 개발을 지속가능성 목표와 더 엄격한 규정 준수 기준에 맞추기 위해 안전성 테스트, 성능 벤치마킹, 생분해성 평가 등 엄격한 검증 과정을 거치는 경향이 증가하고 있습니다. 재료과학의 지속적인 발전으로 보다 효율적이고 안전한 대체품의 개발이 가능해져 보급이 촉진되고 있습니다. 오염에 대한 우려와 함께 높아진 환경 인식도 구매 결정에 영향을 미치고 있으며, 조직은 도입 전에 적합성 조사, 수명주기 분석, 규정 준수 점검을 통해 재료를 신중하게 평가하도록 촉구하고 있습니다.
| 시장 규모 | |
|---|---|
| 시작 연도 | 2025년 |
| 예측 기간 | 2026-2035년 |
| 시작 연도 시장 규모 | 109억 달러 |
| 예측 규모 | 323억 달러 |
| CAGR | 11.7% |
PFAS 대체 화학물질 시장에는 다양한 산업의 성능 요건을 충족하도록 설계된 다양한 화학 제제가 포함되어 있습니다. 이러한 솔루션은 다양한 응용 분야에서 내구성, 내성, 효율성을 지원하는 여러 첨단 화학 기술을 망라하고 있습니다. 지속적인 혁신 노력으로 이러한 소재의 기능성이 확대되고 있으며, 제조업체는 성능과 지속가능성 측면에서 더 나은 결과를 얻을 수 있게 되었습니다. 모든 분야의 기업들은 운영 효율성을 유지하면서 환경 가이드라인을 준수하는 대체 물질을 채택하는 것을 점점 더 우선순위에 두고 있습니다. R&D 활동은 배합 기술의 획기적인 발전을 지속적으로 주도하고 있으며, 기업이 규제 및 상업적 기대치를 모두 충족하는 차별화된 제품을 출시할 수 있도록 돕고 있습니다. 산업계가 환경에 미치는 영향에 대한 인식이 높아짐에 따라 재료 선택 프로세스가 더욱 종합적이 되고 있으며, 신뢰성과 규정 준수를 보장하기 위해 상세한 테스트 프로토콜과 장기적인 성능 평가가 이루어지고 있습니다.
PFAS 대체 화학물질 시장에서 실리콘 기반 대체품 부문은 2025년 39억 달러 규모 시장을 차지했고, 다양한 산업 분야에 적용 가능한 다재다능한 성능 특성과 적응성으로 인해 강력한 수요를 반영하고 있습니다.
최종 사용 산업별로 보면, 페인트 및 코팅 제조업체 부문은 2025년 21억 달러의 매출을 기록했습니다. 이는 환경 기준에 부합하는 고성능 보호 솔루션에 대한 수요에 따른 것입니다.
북미 PFAS 대체 화학물질 시장은 2025년 33억 달러에서 2035년까지 104억 달러로 성장할 것으로 예측됩니다. 각 산업계가 점점 더 엄격해지는 환경 정책 및 지속가능성에 대한 노력에 대응하는 가운데, 이 지역에서는 대체 화학물질 솔루션에 대한 관심이 지속적으로 증가하고 있습니다. 북미에서 사업을 영위하는 기업들은 변화하는 규제 프레임워크 하에서 컴플라이언스 및 성능 효율성을 보장하기 위해 다양한 용도의 신소재 시험 및 검증에 집중하고 있습니다.
자주 묻는 질문
목차
제1장 조사 방법과 범위
제2장 주요 요약
제3장 업계 인사이트
제4장 경쟁 구도
제5장 시장 추산 및 예측 : 대체 화학물질 유형별, 2022-2035년
제6장 시장 추산 및 예측 : 최종 이용 산업별, 2022-2035년
제7장 시장 추산 및 예측 : 지역별, 2022-2035년
제8장 기업 개요
JHS 26.05.29The Global PFAS Alternative Chemicals Market was valued at USD 10.9 billion in 2025 and is estimated to grow at a CAGR of 11.7% to reach USD 32.3 billion by 2035.
The market focuses on advanced chemical solutions designed to replace conventional per- and polyfluoroalkyl substances across industrial and commercial applications. These next-generation alternatives are engineered to replicate key performance attributes such as resistance to moisture and oils, structural durability, and stability under demanding conditions, while significantly reducing environmental persistence. Companies are increasingly aligning their product development with sustainability goals and stricter compliance standards, which require rigorous validation processes including safety testing, performance benchmarking, and biodegradability assessments. Continuous progress in material science is enabling the creation of more efficient and safer substitutes, encouraging widespread adoption. Growing environmental awareness related to contamination concerns is also influencing purchasing decisions, prompting organizations to carefully evaluate materials through compatibility studies, lifecycle analysis, and regulatory compliance checks before deployment.
| Market Scope | |
|---|---|
| Start Year | 2025 |
| Forecast Year | 2026-2035 |
| Start Value | $10.9 Billion |
| Forecast Value | $32.3 Billion |
| CAGR | 11.7% |
The PFAS alternative chemicals market includes a wide spectrum of chemical formulations that are designed to meet varying industrial performance requirements. These solutions encompass multiple advanced chemistries that support durability, resistance, and efficiency across a range of applications. Ongoing innovation efforts are expanding the functional capabilities of these materials, allowing manufacturers to improve both performance and sustainability outcomes. Businesses across sectors are increasingly prioritizing the adoption of alternative substances that align with environmental guidelines while maintaining operational efficiency. Research and development activities continue to drive breakthroughs in formulation technologies, helping companies introduce differentiated products that meet both regulatory and commercial expectations. As industries become more conscious of environmental impact, material selection processes are becoming more comprehensive, involving detailed testing protocols and long-term performance evaluations to ensure reliability and compliance.
Within the PFAS alternative chemicals market, the silicone-based alternatives segment accounted for USD 3.9 billion in 2025, reflecting strong demand due to their versatile performance characteristics and adaptability across multiple industrial applications.
In terms of end-use industries, the paint and coating manufacturers segment generated USD 2.1 billion in 2025, driven by the need for high-performance protective solutions that align with environmental standards.
North America PFAS Alternative Chemicals Market is expected to grow from USD 3.3 billion in 2025 to USD 10.4 billion by 2035. The region continues to demonstrate sustained interest in alternative chemical solutions as industries respond to increasingly stringent environmental policies and sustainability commitments. Companies operating in North America are intensifying their focus on testing and validating new materials across diverse applications to ensure compliance and performance efficiency under evolving regulatory frameworks.
Key participants in the PFAS Alternative Chemicals Market include Daikin Industries, Archroma, Evonik Industries, The Dow Chemical Company, RUDOLF Holding SE & Co. KG, HeiQ Materials, NICCA CHEMICAL CO., LTD., CHT Group, Cerakote, James Walker Group, and Victrex plc. Companies in the PFAS Alternative Chemicals Market are adopting a combination of innovation-led and growth-oriented strategies to strengthen their market position. They are significantly increasing investments in research and development to introduce high-performance formulations that meet both regulatory and environmental standards. Strategic partnerships and collaborations with end-use industries are enabling faster product commercialization and wider adoption. Firms are also expanding their production capacities and enhancing global supply chain networks to meet rising demand efficiently. In addition, companies are focusing on sustainability certifications, transparent reporting, and lifecycle assessments to build credibility and trust among stakeholders.
Table of Contents
Chapter 1 Methodology & Scope
- 1.1 Market scope and definition
- 1.2 Research design
- 1.2.1 Research approach
- 1.2.2 Data collection methods
- 1.3 Data mining sources
- 1.3.1 Global
- 1.3.2 Regional/Country
- 1.4 Base estimates and calculations
- 1.4.1 Base year calculation
- 1.4.2 Key trends for market estimation
- 1.5 Primary research and validation
- 1.5.1 Primary sources
- 1.6 Forecast model
- 1.7 Research assumptions and limitations
Chapter 2 Executive Summary
- 2.1 Industry 360° synopsis
- 2.2 Key market trends
- 2.2.1 Alternative chemical type
- 2.2.2 End use industry
- 2.2.3 Regional
- 2.3 TAM Analysis, 2026-2035
- 2.4 CXO perspectives: Strategic imperatives
- 2.5 Future outlook and strategic recommendations
Chapter 3 Industry Insights
- 3.1 Industry ecosystem analysis
- 3.1.1 Supplier landscape
- 3.1.2 Profit margin
- 3.1.3 Value addition at each stage
- 3.1.4 Factor affecting the value chain
- 3.1.5 Disruptions
- 3.2 Industry impact forces
- 3.2.1 Growth drivers
- 3.2.1.1 Rising awareness encourages adoption of PFAS-free materials
- 3.2.1.2 Regulations support transition toward environmentally safer chemistries
- 3.2.1.3 Industries seek performance alternatives aligning with sustainability goals
- 3.2.2 Pitfalls/challenge
- 3.2.2.1 Limited long-term data creates uncertainty in adoption.
- 3.2.2.2 Manufacturing adjustments increase complexity during material transition
- 3.2.3 Opportunities
- 3.2.3.1 Bio-derived coatings offer emerging sustainable formulation options
- 3.2.3.2 Innovative applications expand potential across multiple industries
- 3.2.1 Growth drivers
- 3.3 Growth potential analysis
- 3.4 Regulatory landscape
- 3.4.1 North America
- 3.4.2 Europe
- 3.4.3 Asia Pacific
- 3.4.4 Latin America
- 3.4.5 Middle East & Africa
- 3.5 Porter's analysis
- 3.6 PESTEL analysis
- 3.7 Technology and innovation landscape
- 3.7.1 Current technological trends
- 3.7.2 Emerging technologies
- 3.8 Price trends
- 3.8.1 By region
- 3.8.2 By alternative chemical type
- 3.9 Future market trends
- 3.10 Patent landscape
- 3.11 Trade statistics (HS code)
- 3.11.1 Major importing countries
- 3.11.2 Major exporting countries
- 3.12 Sustainability and environmental aspects
- 3.12.1 Sustainable practices
- 3.12.2 Waste reduction strategies
- 3.12.3 Energy efficiency in production
- 3.12.4 Eco-friendly initiatives
- 3.13 Carbon footprint consideration
Chapter 4 Competitive Landscape, 2025
- 4.1 Introduction
- 4.2 Company market share analysis
- 4.2.1 By region
- 4.2.1.1 North America
- 4.2.1.2 Europe
- 4.2.1.3 Asia Pacific
- 4.2.1.4 LATAM
- 4.2.1.5 MEA
- 4.2.1 By region
- 4.3 Company matrix analysis
- 4.4 Competitive analysis of major market players
- 4.5 Competitive positioning matrix
- 4.6 Key developments
- 4.6.1 Mergers & acquisitions
- 4.6.2 Partnerships & collaborations
- 4.6.3 New product launches
- 4.6.4 Expansion plans
Chapter 5 Market Estimates and Forecast, By Alternative Chemical Type, 2022-2035 (USD Billion) (Kilo Tons)
- 5.1 Key trends
- 5.2 Silicone-based alternatives
- 5.3 Polyurethane-based alternatives
- 5.4 Acrylate & acrylic polymer alternatives
- 5.5 Hydrocarbon-based alternatives
- 5.6 Polysaccharide & cellulose-based alternatives
- 5.7 Inorganic & ceramic alternatives
- 5.8 Organophosphorus alternatives
- 5.9 Dendritic & specialty polymers
- 5.10 Others
Chapter 6 Market Estimates and Forecast, By End Use Industry, 2022-2035 (USD Billion) (Kilo Tons)
- 6.1 Key trends
- 6.2 Textile & apparel manufacturing
- 6.3 Paint & coating manufacturers
- 6.4 Firefighting & emergency services
- 6.5 Food & beverage packaging industry
- 6.6 Semiconductor & electronics manufacturing
- 6.7 Automotive manufacturing
- 6.8 Aerospace & defense
- 6.9 Medical device manufacturing
- 6.10 Construction & building materials
- 6.11 Others
Chapter 7 Market Estimates and Forecast, By Region, 2022-2035 (USD Billion) (Kilo Tons)
- 7.1 Key trends
- 7.2 North America
- 7.2.1 U.S.
- 7.2.2 Canada
- 7.3 Europe
- 7.3.1 Germany
- 7.3.2 UK
- 7.3.3 France
- 7.3.4 Spain
- 7.3.5 Italy
- 7.3.6 Rest of Europe
- 7.4 Asia Pacific
- 7.4.1 China
- 7.4.2 India
- 7.4.3 Japan
- 7.4.4 Australia
- 7.4.5 South Korea
- 7.4.6 Rest of Asia Pacific
- 7.5 Latin America
- 7.5.1 Brazil
- 7.5.2 Mexico
- 7.5.3 Argentina
- 7.5.4 Rest of Latin America
- 7.6 Middle East and Africa
- 7.6.1 Saudi Arabia
- 7.6.2 South Africa
- 7.6.3 UAE
- 7.6.4 Rest of Middle East and Africa
Chapter 8 Company Profiles
- 8.1 Archroma
- 8.2 Evonik Industries
- 8.3 The Dow Chemical Company
- 8.4 Daikin Industries
- 8.5 RUDOLF Holding SE & Co. KG
- 8.6 HeiQ Materials
- 8.7 NICCA CHEMICAL CO., LTD.
- 8.8 CHT Group
- 8.9 Cerakote
- 8.10 James Walker Group
- 8.11 Victrex plc


