
|
시장보고서
상품코드
2061340
자동차용 하이퍼바이저 및 혼합 중요도 OS 시장 기회, 성장요인, 업계 동향 분석 및 예측(2026-2035년)Automotive Hypervisor and Mixed-Criticality OS Market Opportunity, Growth Drivers, Industry Trend Analysis, and Forecast 2026 - 2035 |
||||||
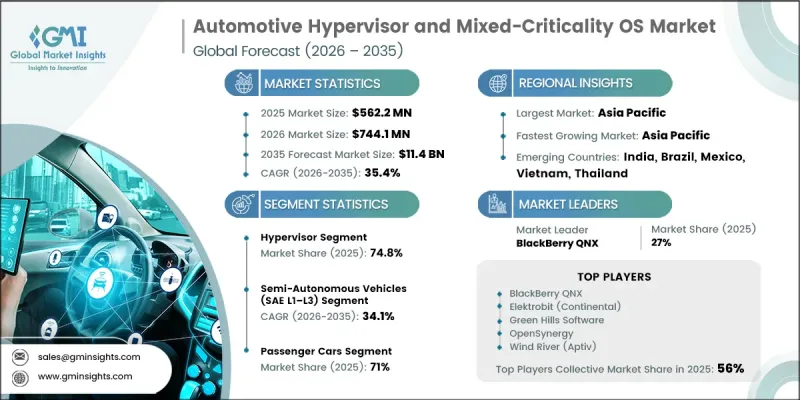
세계의 자동차용 하이퍼바이저 및 혼합 중요도 OS 시장은 2025년에 5억 6,220만 달러로 평가되며, 2035년까지 CAGR 35.4%로 성장하며, 114억 달러에 달할 것으로 추정되고 있습니다.

시장의 성장은 자동차 업계가 집중형 차량 컴퓨팅 아키텍처로 전환되고 있는 데 힘입고 있습니다. 이 아키텍처에서는 다수의 분산형 전자제어 장치가 더 적은 수의 도메인 및 존 컨트롤러로 통합되어 있습니다. 이러한 아키텍처의 전환으로 인해, 엄격한 기능 분리 및 시스템 신뢰성을 유지하면서 단일 하드웨어 플랫폼에서 여러 워크로드를 지원할 수 있는 첨단 자동차용 하이퍼바이저 및 혼합 중요도 OS에 대한 수요가 크게 증가하고 있습니다. 첨단 운전 지원 기술의 통합이 진행됨에 따라 자동차 제조사들은 안전상 중요한 애플리케이션과 그렇지 않은 애플리케이션이 동시에 작동할 수 있는 안전한 실행 환경을 필요로 하고 있으며, 이것이 도입을 더욱 가속화하고 있습니다. 차량이 소프트웨어 정의형으로 전환됨에 따라 제조사들은 자원의 효율적인 활용, 연산 성능 향상, 그리고 자동차 안전 기준 준수를 가능하게 하는 플랫폼을 우선시하고 있습니다. 차량 시스템 전반에 걸친 디지털화의 진전과 소프트웨어의 복잡성 증가가 맞물리면서, 워크로드 분리, 실시간 응답성 및 안전한 시스템 운영을 지원하는 가상화 기술에 대한 수요가 높아지고 있습니다. 이러한 요인들로 인해, 자동차용 하이퍼바이저 및 혼합 중요도 OS 시장은 앞으로도 장기적으로 상당한 성장이 예상됩니다.
| 시장 범위 | |
|---|---|
| 시작연도 | 2025년 |
| 예측 기간 | 2026-2035년 |
| 개시 금액 | 5억 6,220만 달러 |
| 예측액 | 114억 달러 |
| CAGR | 35.4% |
전기자동차(EV) 아키텍처의 급속한 발전으로 인해, 자동차용 하이퍼바이저 및 혼합 중요도 OS 시장에 새로운 기회가 창출되고 있습니다. 배터리 관리, 추진 제어, 열 관리와 관련된 차량 기능에는 엄격한 성능 요건을 충족할 수 있는 신뢰성 높은 실시간 작동 환경이 요구됩니다. 자동차 제조사들이 집중형 컴퓨팅 프레임워크를 점점 더 많이 도입함에 따라 높은 안전성, 신뢰성 및 운영 효율성을 유지하면서 중요한 차량 제어 기능을 다른 소프트웨어 기능으로부터 안전하게 분리할 수 있는 솔루션에 대한 수요가 증가하고 있습니다. 이러한 추세는 차세대 차량 플랫폼에서 하이브리드 중요도 OS의 역할을 강화하고 있습니다.
하이퍼바이저 부문은 74.8%의 시장 점유율을 차지하고 있으며, 2026-2035년 연평균 성장률(CAGR) 34.5%를 기록할 것으로 전망됩니다. 이 부문의 성장은 업계가 기존의 전자제어 장치(ECU) 아키텍처에서 중앙 집중식 컴퓨팅 환경으로 전환되고 있는 데 힘입고 있습니다. 하이퍼바이저는 워크로드의 분리 및 시스템 무결성을 보장하면서, 단일 고성능 컴퓨팅 플랫폼에서 여러 운영 체제를 동시에 실행할 수 있게 해줍니다. 소프트웨어 정의 차량(SDV) 내에서 다양한 소프트웨어 환경을 지원해야 할 필요성이 높아짐에 따라 인포테인먼트, 운전 보조, 차량 제어 애플리케이션에 달할 도입하는 추세가 확산되고 있습니다. 또한 전기자동차(EV) 플랫폼 전반에 걸쳐 다양한 중요도를 가진 운영 체제를 통합함에 따라 기능 안전 규정 준수와 효율적인 자원 관리를 지원하는 하이퍼바이저 기반 솔루션에 대한 수요가 더욱 증가하고 있습니다.
반자율주행차(SAE L1-L3) 부문은 2025년에 68.7%의 시장 점유율을 차지하며, 2026-2035년 연평균 성장률(CAGR) 34.1%로 성장할 것으로 전망됩니다. 이 부문의 수요는 승용차 전반에 걸친 첨단 운전자 보조 기능의 도입 확대에 힘입어 증가하고 있습니다. 각 자동차 제조사들은 차량의 지능화와 운전자의 편의성을 높이는 반자율주행 기술을 통해 안전 기능 강화와 주행 성능 향상에 주력하고 있습니다. 이러한 시스템의 지속적인 확장에 따라 차량 운영 전반에 걸쳐 신뢰할 수 있는 성능과 안전성을 유지하면서 여러 워크로드를 관리할 수 있는 견고한 소프트웨어 플랫폼에 대한 수요가 높아지고 있습니다.
미국의 자동차용 하이퍼바이저 및 혼합 중요도 OS 시장은 2025년에 1억 2,770만 달러 규모에 달하며, 2035년까지 연평균 성장률(CAGR) 36.3%로 성장할 것으로 전망됩니다. 미국은 첨단 차량 자동화 기술 분야의 주요 혁신 거점으로 자리매김하고 있으며, 집중형 차량 컴퓨팅을 지원하는 첨단 소프트웨어 플랫폼에 대한 강력한 수요를 창출하고 있습니다. 지능형 모빌리티 솔루션, 소프트웨어 정의 차량 개발 및 차세대 자동차 기술에 대한 투자 확대에 따라 하이퍼바이저와 혼합 중요도 OS의 도입이 가속화되고 있습니다. 또한 지원적인 규제 체계와 지속적인 기술 발전이 안전한 워크로드 분리 및 고성능 차량 운행을 보장하기 위해 설계된 가상화 기술의 광범위한 도입에 기여하고 있습니다.
자주 묻는 질문
목차
제1장 조사 방법
제2장 개요
제3장 업계 인사이트
제4장 경쟁 구도
제5장 시장 추산·예측 : 소프트웨어별, 2022-2035년
제6장 시장 추산·예측 : 자율주행 레벨별, 2022-2035년
제7장 시장 추산·예측 : 용도별, 2022-2035년
제8장 시장 추산·예측 : 차량별, 2022-2035년
제9장 시장 추산·예측 : 판매 채널별, 2022-2035년
제10장 시장 추산·예측 : 지역별, 2022-2035년
제11장 기업 개요
KSAThe Global Automotive Hypervisor and Mixed-Criticality OS Market was valued at USD 562.2 million in 2025 and is estimated to grow at a CAGR of 35.4% to reach USD 11.4 billion by 2035.
Market growth is driven by the automotive industry's transition toward centralized vehicle computing architectures, where numerous distributed electronic control units are being consolidated into a smaller number of domain and zonal controllers. This architectural shift is creating substantial demand for advanced automotive hypervisors and mixed-criticality operating systems capable of supporting multiple workloads on a single hardware platform while maintaining strict functional separation and system reliability. The increasing integration of advanced driver assistance technologies is further accelerating adoption, as automakers require secure execution environments for safety-critical and non-critical applications operating simultaneously. As vehicles become software-defined, manufacturers are prioritizing platforms that enable efficient resource utilization, enhanced computing performance, and compliance with automotive safety standards. Growing digitalization across vehicle systems, coupled with rising software complexity, is strengthening the need for virtualization technologies that support workload isolation, real-time responsiveness, and secure system operation. These factors continue to position the automotive hypervisor and mixed-criticality OS industry for substantial long-term expansion.
| Market Scope | |
|---|---|
| Start Year | 2025 |
| Forecast Year | 2026-2035 |
| Start Value | $562.2 Million |
| Forecast Value | $11.4 Billion |
| CAGR | 35.4% |
The rapid evolution of electric vehicle architectures is creating additional opportunities for the automotive hypervisor and mixed-criticality OS market. Vehicle functions related to battery management, propulsion control, and thermal regulation require dependable real-time operating environments capable of meeting stringent performance requirements. As automakers increasingly adopt centralized computing frameworks, demand is rising for solutions that can safely separate critical vehicle operations from other software functions while maintaining high levels of safety, reliability, and operational efficiency. This trend is reinforcing the role of mixed-criticality operating systems in next-generation vehicle platforms.
The hypervisor segment held a 74.8% share, and is anticipated to register a CAGR of 34.5% between 2026 and 2035. Segment growth is being supported by the industry's shift from conventional electronic control unit architectures toward centralized computing environments. Hypervisors enable multiple operating systems to run simultaneously on a single high-performance computing platform while ensuring workload separation and system integrity. The growing need to support diverse software environments within software-defined vehicles is increasing adoption across infotainment, driver assistance, and vehicle control applications. In addition, the integration of mixed-criticality operating systems across electric vehicle platforms is further contributing to demand for hypervisor-based solutions that support functional safety compliance and efficient resource management.
The semi-autonomous vehicles (SAE L1-L3) segment accounted for 68.7% share in 2025 and is expected to grow at a CAGR of 34.1% from 2026 to 2035. Demand within this segment is being driven by the increasing incorporation of advanced driver assistance capabilities across passenger vehicles. Automakers are focusing on delivering enhanced safety features and improved driving functionality through semi-autonomous technologies that support greater vehicle intelligence and driver convenience. The continued expansion of these systems is increasing the requirement for robust software platforms capable of managing multiple workloads while maintaining reliable performance and safety across vehicle operations.
U.S. Automotive Hypervisor and Mixed-Criticality OS Market generated USD 127.7 million in 2025 and is forecast to grow at a CAGR of 36.3% through 2035. The country remains a key hub for innovation in advanced vehicle automation technologies, creating strong demand for sophisticated software platforms that support centralized vehicle computing. Increasing investments in intelligent mobility solutions, software-defined vehicle development, and next-generation automotive technologies are accelerating adoption of hypervisors and mixed-criticality operating systems. In addition, supportive regulatory frameworks and ongoing technological advancements are contributing to the widespread implementation of virtualization technologies designed to ensure secure workload separation and high-performance vehicle operation.
Major companies operating in the Global Automotive Hypervisor and Mixed-Criticality OS Market include BlackBerry QNX, Elektrobit (Continental), Green Hills Software, Lynx Software Technologies, NVIDIA, NXP Semiconductors, OpenSynergy, Renesas Electronics, SYSGO, and Wind River (Aptiv). Leading participants in the automotive hypervisor and mixed-criticality OS market are implementing a range of strategies to strengthen their market position and expand business opportunities. Companies are investing significantly in research and development to improve virtualization capabilities, real-time performance, cybersecurity, and functional safety compliance. Strategic collaborations with automotive manufacturers, semiconductor providers, and software developers are helping accelerate technology integration across next-generation vehicle platforms. Product innovation remains a major focus area, with vendors developing scalable software solutions tailored for software-defined vehicles and centralized computing architectures. Many organizations are also expanding their global footprint through partnerships, acquisitions, and ecosystem development initiatives. In addition, companies are emphasizing compliance with evolving automotive safety standards while enhancing interoperability and platform flexibility to meet the growing demands of connected, autonomous, and electric vehicles.
Table of Contents
Chapter 1 Methodology
- 1.1 Research approach
- 1.2 Quality Commitments
- 1.2.1 GMI AI policy & data integrity commitment
- 1.2.1.1 Source consistency protocol
- 1.2.1 GMI AI policy & data integrity commitment
- 1.3 Research Trail & Confidence Scoring
- 1.3.1 Research Trail Components
- 1.3.2 Scoring Components
- 1.4 Data Collection
- 1.4.1 Partial list of primary sources
- 1.5 Data mining sources
- 1.5.1 Paid sources
- 1.5.1.1 Sources, by region
- 1.5.1 Paid sources
- 1.6 Base estimates and calculations
- 1.6.1 Base year calculation
- 1.7 Forecast model
- 1.7.1 Quantified market impact analysis
- 1.7.1.1 Mathematical impact of growth parameters on forecast
- 1.7.1 Quantified market impact analysis
- 1.8 Research transparency addendum
- 1.8.1 Source attribution framework
- 1.8.2 Quality assurance metrics
- 1.8.3 Our commitment to trust
Chapter 2 Executive Summary
- 2.1 Industry 360° synopsis
- 2.2 Key market trends
- 2.2.1 Regional
- 2.2.2 Software
- 2.2.3 Level of Autonomy
- 2.2.4 Application
- 2.2.5 Vehicle
- 2.2.6 Sales Channel
- 2.3 TAM analysis, 2026-2035
- 2.4 CXO perspectives: Strategic imperatives
Chapter 3 Industry Insights
- 3.1 Industry ecosystem analysis
- 3.1.1 Supplier landscape
- 3.1.2 Profit margin
- 3.1.3 Cost structure
- 3.1.4 Value addition at each stage
- 3.1.5 Factor affecting the value chain
- 3.1.6 Disruptions
- 3.2 Industry impact forces
- 3.2.1 Growth drivers
- 3.2.1.1 ECU Consolidation & SDV Transition
- 3.2.1.2 ADAS & Autonomous Complexity Growth
- 3.2.1.3 EV Powertrain Software Integration
- 3.2.1.4 Functional Safety & Cyber Compliance
- 3.2.2 Industry pitfalls and challenges
- 3.2.2.1 High ASIL Certification Cost
- 3.2.2.2 Virtualization Latency Constraints
- 3.2.3 Market opportunities
- 3.2.3.1 Zonal Architecture Expansion
- 3.2.3.2 L4-L5 Autonomous Vehicle Growth
- 3.2.3.3 Open-Source Hypervisor Adoption
- 3.2.3.4 EV Startup Ecosystem Expansion
- 3.2.1 Growth drivers
- 3.3 Growth potential analysis
- 3.4 Technology and innovation landscape
- 3.4.1 Current technological trends
- 3.4.2 Emerging technologies
- 3.5 Cost breakdown analysis
- 3.6 Regulatory landscape
- 3.6.1 North America
- 3.6.1.1 National Institute of Standards and Technology
- 3.6.1.2 Innovation, Science and Economic Development Canada
- 3.6.2 Europe
- 3.6.2.1 European Commission
- 3.6.2.2 European Telecommunications Standards Institute
- 3.6.3 Asia Pacific
- 3.6.3.1 Ministry of Industry and Information Technology
- 3.6.3.2 Ministry of Economy, Trade and Industry
- 3.6.4 Latin America
- 3.6.4.1 Ministry of Science, Technology and Innovation
- 3.6.4.2 National Institute of Statistics and Geography
- 3.6.5 Middle East & Africa
- 3.6.5.1 Saudi Data and Artificial Intelligence Authority
- 3.6.5.2 Department of Communications and Digital Technologies
- 3.6.1 North America
- 3.7 Pricing Analysis (Driven by Primary Research)
- 3.7.1 Historical Price Trend Analysis
- 3.7.2 Pricing Strategy by Player Type
- 3.8 Porter's analysis
- 3.9 PESTEL analysis
- 3.10 Patent analysis (Driven by Primary Research)
- 3.11 Impact of AI & Generative AI on the Market
- 3.11.1 AI-driven disruption of existing business models
- 3.11.2 Gen AI use cases & adoption roadmap by segment
- 3.11.3 Risks, limitations & regulatory considerations
- 3.12 Sustainability and environmental aspects
- 3.12.1 Sustainable practices
- 3.12.2 Waste reduction strategies
- 3.12.3 Energy efficiency in production
- 3.12.4 Eco-friendly initiatives
- 3.12.5 Carbon footprint considerations
- 3.13 Forecast assumptions & scenario analysis (Driven by primary research)
- 3.13.1 Base Case - key macro & industry variables driving CAGR
- 3.13.2 Optimistic Scenarios - Favorable macro and industry tailwinds
- 3.13.3 Pessimistic Scenario - Macroeconomic slowdown or industry headwinds
Chapter 4 Competitive Landscape, 2025
- 4.1 Introduction
- 4.2 Company market share analysis
- 4.2.1 North America
- 4.2.2 Europe
- 4.2.3 Asia Pacific
- 4.2.4 LATAM
- 4.2.5 MEA
- 4.3 Competitive analysis of major market players
- 4.4 Competitive positioning matrix
- 4.5 Key developments
- 4.5.1 Mergers & acquisitions
- 4.5.2 Partnerships & collaborations
- 4.5.3 New product launches
- 4.5.4 Expansion plans and funding
Chapter 5 Market Estimates and Forecast, By Software, 2022 - 2035 ($ Million)
- 5.1 Key trends
- 5.2 Hypervisor
- 5.2.1 Type 1 Hypervisor (Bare-Metal / Native)
- 5.2.2 Type 2 Hypervisor (Hosted)
- 5.3 Safety-Certified Mixed-Criticality OS Platforms (MC-OS)
- 5.3.1 AUTOSAR-Based MC Platforms
- 5.3.2 RTOS-Based MC Platforms
Chapter 6 Market Estimates and Forecast, By Level of Autonomy, 2022 - 2035 ($ Million)
- 6.1 Key trends
- 6.2 Semi-Autonomous Vehicles (SAE L1-L3)
- 6.3 Fully Autonomous Vehicles (SAE L4-L5)
Chapter 7 Market Estimates and Forecast, By Application, 2022 - 2035 ($ Million)
- 7.1 Key trends
- 7.2 Advanced driver assistance systems (ADAS) & autonomous driving
- 7.3 Infotainment & digital cockpit
- 7.4 Vehicle connectivity & telematics
- 7.5 Powertrain & energy management
- 7.6 Body electronics & comfort systems
- 7.7 Vehicle cybersecurity & secure gateway systems
Chapter 8 Market Estimates and Forecast, By Vehicle, 2022 - 2035 ($ Million)
- 8.1 Key trends
- 8.2 Passenger cars
- 8.2.1 Sedan
- 8.2.2 SUV
- 8.2.3 Hatchback
- 8.3 Commercial vehicles
- 8.3.1 LCV
- 8.3.2 MCV
- 8.3.3 HCV
Chapter 9 Market Estimates and Forecast, By Sales Channel, 2022 - 2035 ($ Million)
- 9.1 Key trends
- 9.2 OEM
- 9.3 Aftermarket
Chapter 10 Market Estimates & Forecast, By Region, 2022 - 2035 ($Mn)
- 10.1 Key trends
- 10.2 North America
- 10.2.1 U.S.
- 10.2.2 Canada
- 10.3 Europe
- 10.3.1 Germany
- 10.3.2 UK
- 10.3.3 France
- 10.3.4 Italy
- 10.3.5 Spain
- 10.3.6 Russia
- 10.3.7 Netherlands
- 10.3.8 Sweden
- 10.3.9 Poland
- 10.4 Asia Pacific
- 10.4.1 China
- 10.4.2 India
- 10.4.3 Japan
- 10.4.4 South Korea
- 10.4.5 Australia
- 10.4.6 Vietnam
- 10.4.7 Indonesia
- 10.4.8 Malaysia
- 10.4.9 Singapore
- 10.4.10 Thailand
- 10.5 Latin America
- 10.5.1 Brazil
- 10.5.2 Mexico
- 10.5.3 Argentina
- 10.5.4 Chile
- 10.6 MEA
- 10.6.1 South Africa
- 10.6.2 Saudi Arabia
- 10.6.3 UAE
Chapter 11 Company Profiles
- 11.1 Global players
- 11.1.1 BlackBerry QNX
- 11.1.2 Elektrobit (Continental)
- 11.1.3 Green Hills Software
- 11.1.4 Lynx Software Technologies
- 11.1.5 NVIDIA
- 11.1.6 NXP Semiconductors
- 11.1.7 OpenSynergy
- 11.1.8 Wind River (Aptiv)
- 11.2 Regional players
- 11.2.1 eSOL
- 11.2.2 NeuSoft Rui Chi
- 11.2.3 Perseus (CyberPerseus)
- 11.2.4 Renesas Electronics
- 11.2.5 SCSK
- 11.2.6 SYSGO
- 11.2.7 TTTech Auto
- 11.2.8 Vector Informatik
- 11.3 Emerging players
- 11.3.1 Apex.AI
- 11.3.2 easyCore
- 11.3.3 osdyne
- 11.3.4 Virtual Open Systems
