

|
시장보고서
상품코드
2071410
작물 모니터링 시장 : 기회, 성장 촉진요인, 업계 동향 분석 및 예측(2026-2035년)Crop Monitoring Market Opportunity, Growth Drivers, Industry Trend Analysis, and Forecast 2026 - 2035 |
||||||

세계의 작물 모니터링 시장은 2025년에 33억 달러 규모로 평가되었고, 2035년까지 연평균 복합 성장률(CAGR) 14.1%로 성장하여 122억 달러에 이를 것으로 추정되고 있습니다.
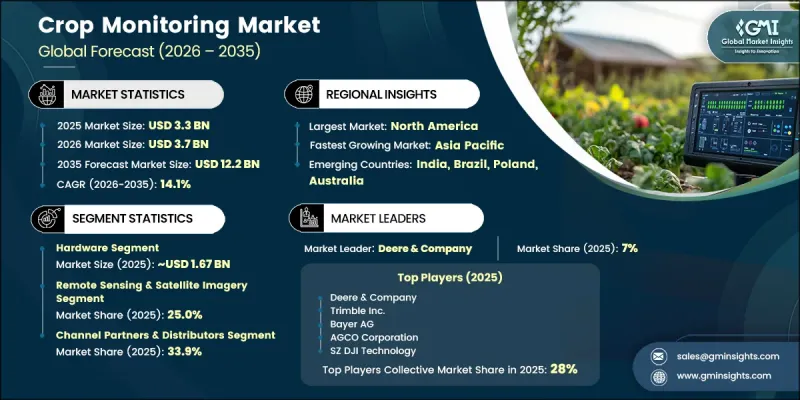
시장의 성장을 견인하고 있는 것은 선진국과 신흥 농업 경제권 모두에서 정밀 농업의 실천이 급속히 확산되고 있다는 점입니다. 위성 데이터의 활용 편의성 향상, 사물인터넷(IoT) 센서의 도입 확대, 그리고 데이터에 기반한 농업 경영 의사결정에 대한 수요 증가가 업계 전체에 큰 비즈니스 기회를 창출하고 있습니다. 농가와 농업 관련 기업들은 자원 활용을 최적화하고, 작물 생산성을 높이며, 운영 비용을 절감하고, 수확량 예측 정확도를 높이는 데 도움이 되는 기술에 대한 투자를 점점 더 늘리고 있습니다. 농작물 모니터링 시장을 형성하는 주요 변화 중 하나는 독립형 하드웨어 시스템에서 데이터 수집, 분석, 의사결정 지원 기능을 결합한 통합형 디지털 플랫폼으로의 전환입니다. 클라우드 기반 농업 솔루션은 확장 가능한 도입, 빠른 데이터 처리, 접근성 향상, 그리고 지속적인 서비스 기반 수익 모델을 가능하게 하기 때문에 그 중요성이 점점 더 커지고 있습니다. 농업 지원 정책과 지속가능성에 초점을 맞춘 노력들이 기술 도입을 더욱 가속화하여, 작물 모니터링 업계의 장기적인 성장 전망을 더욱 공고히 하고 있습니다.
| 시장 범위 | |
|---|---|
| 시작 연도 | 2025 |
| 예측 기간 | 2026-2035년 |
| 초기 시장 규모 | 33억 달러 |
| 예측 금액 | 122억 달러 |
| CAGR | 14.1% |
하드웨어 부문은 50.5%의 시장 점유율을 차지했으며, 2025년에는 16억 7,000만 달러의 매출을 기록했습니다. 하드웨어 시장 점유율은 전체적으로 약 45%로 서서히 하락할 것으로 예상되지만, 이러한 변화는 하드웨어 솔루션에 대한 수요가 감소하고 있다는 것보다는 소프트웨어 및 서비스 제공이 급속히 확대되고 있음을 반영한 것입니다. 첨단 감시 장비, 연결형 현장 장치, 원격 감지 기술 및 농업 데이터 수집 인프라에 대한 지속적인 투자는 전 세계 농업 시장에서 해당 부문의 성장을 뒷받침하는 주요 촉진요인으로 자리 잡고 있습니다.
원격 감지 및 위성 이미지 부문은 2025년에 25%의 시장 점유율을 차지하며 8억 3,000만 달러의 매출을 기록했습니다. 고해상도 농업용 이미지의 이용 가능성이 높아지고, 원격 감지 기술이 발전함에 따라, 보다 광범위한 농업 경영 분야에서 첨단 모니터링 기능을 이용할 수 있는 기회가 확대되고 있습니다. 데이터 수집 및 이미지 분석에 드는 비용이 감소함에 따라, 상업 농장, 농업 단체 및 공공 부문의 이해관계자들 사이에서 도입이 확대되고 있습니다. 그 결과, 원격 감지 기술은 작물 수확량 증대, 자원 관리 및 운영 효율 개선을 목표로 하는 정밀 농업 전략에서 점점 더 중요한 요소로 자리 잡고 있습니다.
2025년, 북미의 작물 모니터링 시장은 38%의 점유율을 차지했으며, 시장 규모는 13억 달러에 달했습니다. 이 지역이 주도적인 위치를 차지하고 있는 배경에는 대규모 상업 농업 경영의 존재, 선진적인 농업 인프라, 그리고 디지털 농업 기술의 광범위한 도입이 있습니다. 첨단 기술 통합, 견고한 통신 인프라, 그리고 확립된 농업 기술 제공업체 생태계가 작물 모니터링 솔루션에 대한 수요를 지속적으로 견인하고 있습니다. 또한, 이 지역에서는 정밀 농업 및 농장 관리 기술에 대한 투자가 증가하고 있으며, 이는 농업 분야 전반에 걸쳐 통합형 모니터링 플랫폼과 첨단 데이터 분석 도구의 도입을 촉진하고 있습니다.
자주 묻는 질문
목차
제1장 조사 방법
제2장 주요 요약
제3장 업계 인사이트
제4장 경쟁 구도
제5장 시장 추정 및 예측 : 유형별(2022-2035년)
제6장 시장 추정 및 예측 : 기술별(2022-2035년)
제7장 시장 추정 및 예측 : 용도별(2022-2035년)
제8장 시장 추정 및 예측 : 작물 유형별(2022-2035년)
제9장 시장 추정 및 예측 : 유통 채널별(2022-2035년)
제10장 시장 추정 및 예측 : 지역별(2022-2035년)
제11장 기업 개요
KTH 26.07.03The Global Crop Monitoring Market was valued at USD 3.3 billion in 2025 and is estimated to grow at a CAGR of 14.1% to reach USD 12.2 billion by 2035.
Market growth is fueled by the rapid adoption of precision agriculture practices across both developed and emerging agricultural economies. Increasing accessibility of satellite-based data, expanding deployment of Internet of Things (IoT) sensors, and rising demand for data-driven farming decisions are creating substantial opportunities throughout the industry. Farmers and agricultural enterprises are increasingly investing in technologies that help optimize resource utilization, improve crop productivity, reduce operational costs, and enhance yield predictability. A major transformation shaping the crop monitoring market is the transition from standalone hardware systems toward integrated digital platforms that combine data collection, analytics, and decision-support capabilities. Cloud-based agricultural solutions are becoming increasingly important as they enable scalable deployment, faster data processing, improved accessibility, and recurring service-based revenue models. Supportive agricultural policies and sustainability-focused initiatives are further accelerating technology adoption, strengthening the long-term growth outlook for the crop monitoring industry.
| Market Scope | |
|---|---|
| Start Year | 2025 |
| Forecast Year | 2026-2035 |
| Start Value | $3.3 Billion |
| Forecast Value | $12.2 Billion |
| CAGR | 14.1% |
The hardware segment held a 50.5% share, generating USD 1.67 billion in 2025. Although hardware is expected to experience a gradual decline in overall market share to approximately 45%, this shift reflects the faster expansion of software and service offerings rather than reduced demand for hardware solutions. Continued investments in advanced monitoring equipment, connected field devices, remote sensing technologies, and agricultural data collection infrastructure remain key drivers supporting segment growth across global farming markets.
The remote sensing and satellite imagery segment accounted for 25% share in 2025, generating USD 830 million. Growing availability of high-resolution agricultural imagery and improvements in remote sensing technologies are expanding access to advanced monitoring capabilities across a wider range of agricultural operations. Declining costs associated with data acquisition and image analysis have increased adoption among commercial farms, agricultural organizations, and public-sector stakeholders. As a result, remote sensing technologies are becoming an increasingly important component of precision agriculture strategies aimed at improving crop performance, resource management, and operational efficiency.
North America Crop Monitoring Market held 38% share in 2025, equivalent to USD 1.3 billion. The region's leadership position is supported by the presence of large-scale commercial farming operations, advanced agricultural infrastructure, and widespread adoption of digital farming technologies. High levels of technology integration, strong connectivity infrastructure, and a well-established ecosystem of agricultural technology providers continue to drive demand for crop monitoring solutions. The region also benefits from increasing investments in precision agriculture and farm management technologies, which support the adoption of integrated monitoring platforms and advanced data analytics tools across the agricultural sector.
Major companies operating in the global crop monitoring market include Aerobotics, AGCO Corporation, Bayer AG, CNH Industrial, Corteva Agriscience, Cropin Technology Solutions, CropX Technologies, Deere & Company, Farmers Edge Inc., Hummingbird Technologies, Pessl Instruments GmbH, Planet Labs PBC, SatSure Analytics, Semios, Sentera Inc., SZ DJI Technology, Topcon Corporation, Trimble Inc., XAG Co. Ltd., and Yara International. Companies operating in the crop monitoring market are implementing a variety of strategic initiatives to strengthen their competitive position and expand market share. Investment in research and development remains a top priority as organizations focus on enhancing data analytics, artificial intelligence capabilities, predictive modeling, and precision agriculture technologies. Many market participants are expanding their software platforms to provide integrated solutions that combine remote sensing, IoT connectivity, and real-time farm intelligence. Strategic partnerships, acquisitions, and collaborations are helping companies broaden their geographic reach and strengthen technology portfolios. Businesses are also investing in cloud-based infrastructure and subscription-based service models to create recurring revenue streams and improve customer retention.
Table of Contents
Chapter 1 Research Methodology
- 1.1 Research approach
- 1.2 Quality Commitments
- 1.2.1 GMI AI policy & data integrity commitment
- 1.2.1.1 Source consistency protocol
- 1.2.1 GMI AI policy & data integrity commitment
- 1.3 Research Trail & Confidence Scoring
- 1.3.1 Research Trail Components
- 1.3.2 Scoring Components
- 1.4 Data Collection
- 1.4.1 Partial list of primary sources
- 1.5 Data mining sources
- 1.5.1 Paid sources
- 1.5.1.1 Sources, by region
- 1.5.1 Paid sources
- 1.6 Base estimates and calculations
- 1.6.1 Base year calculation for any one approach
- 1.7 Forecast model
- 1.7.1 Quantified market impact analysis
- 1.7.1.1 Mathematical impact of growth parameters on forecast
- 1.7.1 Quantified market impact analysis
- 1.8 Research transparency addendum
- 1.8.1 Source attribution framework
- 1.8.2 Quality assurance metrics
- 1.8.3 Our commitment to trust
Chapter 2 Executive Summary
- 2.1 Industry 360° synopsis, 2022 - 2035
- 2.2 Key market trends
- 2.2.1 Regional
- 2.2.2 Type
- 2.2.3 Technology
- 2.2.4 Application
- 2.2.5 Crop Type
- 2.2.6 Distribution Channel
Chapter 3 Industry Insights
- 3.1 Industry ecosystem analysis
- 3.1.1 Factor affecting the value chain
- 3.1.2 Profit margin analysis
- 3.1.3 Disruptions
- 3.1.4 Future outlook
- 3.1.5 Manufacturers
- 3.1.6 Distributors
- 3.2 Supplier landscape
- 3.3 Key news & initiatives
- 3.4 Technology & Innovation Landscape
- 3.5 Regulatory landscape
- 3.6 Impact on forces
- 3.6.1 Growth drivers
- 3.6.2 Industry pitfalls & challenges
- 3.6.3 Opportunities
- 3.7 Pricing analysis, 2025 (driven by primary research)
- 3.7.1 Historical price trend analysis (2022-2025)
- 3.7.2 Pricing strategy by player type (premium/value/cost-plus)
- 3.7.3 Regional price variation analysis
- 3.8 Growth potential analysis
- 3.9 Porter's analysis
- 3.10 PESTEL analysis
- 3.11 Trade data analysis (driven by paid database)
- 3.11.1 Import/export volume & value trends (Driven by Primary Research)
- 3.11.2 Key trade corridors & tariff impact (Driven by Primary Research)
- 3.12 Impact of AI & generative AI on the market
- 3.12.1 AI-driven disruption of existing business models
- 3.12.2 GenAI use cases & adoption roadmap by segment
- 3.12.3 Risks, limitations & regulatory considerations
- 3.13 Capacity & Production Landscape (Driven by Primary Research)
- 3.13.1 Installed Capacity by Region & Key Producer (Driven by Primary Research)
- 3.13.2 Capacity Utilization Rates & Expansion Pipelines (Driven by Primary Research)
Chapter 4 Competitive Landscape, 2025
- 4.1 Introduction
- 4.2 Company market share analysis
- 4.3 Competitive positioning matrix
- 4.4 Strategic outlook matrix
- 4.5 Competitive analysis of major market players
- 4.6 Key developments
- 4.6.1 Mergers & acquisitions
- 4.6.2 Partnerships & collaborations
- 4.6.3 New product launches
- 4.6.4 Expansion plans
Chapter 5 Market Estimates & Forecast, By Type, 2022 - 2035, (USD Billion) (Thousand Units)
- 5.1 Key trends
- 5.2 Hardware
- 5.3 Software
- 5.4 Services
Chapter 6 Market Estimates & Forecast, By Technology, 2022 - 2035, (USD Billion) (Thousand Units)
- 6.1 Key trends
- 6.2 Remote Sensing & Satellite Imagery
- 6.3 UAV / Drone-Based Monitoring
- 6.4 IoT & Ground Sensors
- 6.5 AI & Machine Learning Analytics
- 6.6 Variable Rate Technology (VRT)
- 6.7 Others (GPS/GIS, Cloud, Blockchain)
Chapter 7 Market Estimates & Forecast, By Application, 2022 - 2035, (USD Billion) (Thousand Units)
- 7.1 Key trends
- 7.2 Crop Health Monitoring
- 7.3 Soil Monitoring
- 7.4 Yield Monitoring & Forecasting
- 7.5 Pest & Disease Detection
- 7.6 Field Mapping
- 7.7 Irrigation Management
- 7.8 Weather Tracking & Forecasting
- 7.9 Others (VRA, Carbon Credit)
Chapter 8 Market Estimates & Forecast, By Crop Type, 2022 - 2035, (USD Billion) (Thousand Units)
- 8.1 Key trends
- 8.2 Cereals & Grains
- 8.3 Oilseeds & Pulses
- 8.4 Fruits & Flowers
- 8.5 Stem & Tubers
- 8.6 Other (Plantation Crops, Forestry, etc.)
Chapter 9 Market Estimates & Forecast, By Distribution Channel, 2022 - 2035, (USD Billion) (Thousand Units)
- 9.1 Key trends
- 9.2 Direct Sales
- 9.3 Channel Partners & Distributors
- 9.4 Online / E-Commerce
- 9.5 OEM & System Integrators
Chapter 10 Estimates & Forecast, By Region, 2022 - 2035, (USD Billion) (Million Units)
- 10.1 Key trends
- 10.2 North America
- 10.2.1 U.S.
- 10.2.2 Canada
- 10.3 Europe
- 10.3.1 Germany
- 10.3.2 U.K.
- 10.3.3 France
- 10.3.4 Italy
- 10.3.5 Spain
- 10.4 Asia Pacific
- 10.4.1 China
- 10.4.2 India
- 10.4.3 Japan
- 10.4.4 South Korea
- 10.4.5 Australia
- 10.5 Latin America
- 10.5.1 Brazil
- 10.5.2 Mexico
- 10.5.3 Argentina
- 10.6 MEA
- 10.6.1 UAE
- 10.6.2 Saudi Arabia
- 10.6.3 South Africa
Chapter 11 Company Profiles (Business Overview, Financial Data, Product Landscape, Strategic Outlook, SWOT Analysis)
- 11.1 Global players
- 11.1.1 Deere & Company
- 11.1.2 Trimble Inc.
- 11.1.3 Bayer AG
- 11.1.4 AGCO Corporation
- 11.1.5 SZ DJI Technology
- 11.1.6 Corteva Agriscience
- 11.1.7 Topcon Corporation
- 11.1.8 Planet Labs PBC
- 11.2 Regional players
- 11.2.1 CNH Industrial
- 11.2.2 Yara International
- 11.2.3 XAG Co. Ltd.
- 11.2.4 Pessl Instruments GmbH
- 11.2.5 Cropin Technology Solutions
- 11.2.6 Farmers Edge Inc.
- 11.2.7 CropX Technologies
- 11.3 Emerging players
- 11.3.1 Sentera Inc.
- 11.3.2 Hummingbird Technologies
- 11.3.3 Semios
- 11.3.4 Aerobotics
- 11.3.5 SatSure Analytics


