|
시장보고서
상품코드
2083125
바이오가스 정제 기술 시장 기회, 성장요인, 업계 동향 분석 및 예측(2026-2035년)Biogas Upgrading Technology Market Opportunity, Growth Drivers, Industry Trend Analysis, and Forecast 2026 - 2035 |
||||||

세계의 바이오가스 정제 기술 시장은 2025년에 20억 달러로 평가되었고, CAGR 11.2%로 성장하여 59억 달러에 달할 것으로 추정되고 있습니다.
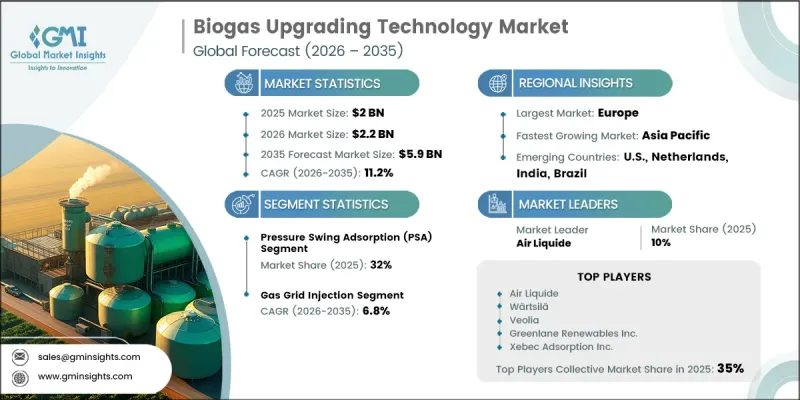
바이오가스 정제 기술 시장의 성장은 기술 도입 방식의 진화와 새로운 지역 시장으로의 진출 확대에 힘입어 이루어지고 있습니다. 유럽, 북미 및 아시아태평양의 특정 국가 정부는 재생 가능 가스 목표와 바이오메탄 생산 의무를 도입하고 있으며, 이로 인해 정제 능력에 대한 장기적인 수요가 발생하고 있습니다. 이러한 정책 조치는 프로젝트 개발자에게 있어 상업적 불확실성을 줄여주는 동시에, 정제 설비 및 시스템 설치를 포함한 밸류체인 전반에 걸친 투자를 촉진하고 있습니다. 또한, 탄소 크레딧 제도, 재생 가능 가스 인증 시스템, 그리고 기업의 지속가능성 노력이 점점 더 통합됨에 따라 프로젝트 운영자에게 새로운 수익 기회가 창출되고 있습니다. 수익 전망이 명확해지고 재무적 수익성이 개선됨에 따라 프로젝트의 실현 가능성이 높아졌으며, 이는 중·대규모 바이오메탄 정제 시설에 대한 자본 투자 확대를 뒷받침하고 있습니다. 전 세계적으로 재생에너지 도입이 계속해서 가속화되는 가운데, 바이오가스 정제 기술 시장은 예측 기간 동안 지속적인 수요와 유리한 규제 환경의 혜택을 누릴 것으로 예측됩니다.
| 시장 범위 | |
|---|---|
| 개시 연도 | 2025년 |
| 예측 기간 | 2026-2035년 |
| 개시 연도 시장 규모 | 20억 달러 |
| 예측액 | 59억 달러 |
| CAGR | 11.2% |
압력 스윙 흡착(PSA) 부문은 2025년에 32%의 시장 점유율을 차지했으며, 2035년까지 연평균 성장률(CAGR) 8.9%로 성장할 것으로 전망됩니다. 이 기술은 특수한 흡착재를 이용한 주기적인 압력 변동 공정을 통해 메탄에서 이산화탄소를 분리함으로써, 화학 첨가제를 사용하지 않고도 96%에서 99% 순도의 메탄을 얻을 수 있습니다. PSA 시스템은 운영상의 신뢰성, 확장성, 그리고 고품질의 재생 가능 가스를 공급할 수 있는 능력 덕분에 바이오메탄 생산의 다양한 분야에서 널리 채택되고 있습니다. 효율적인 가스 분리 기술에 대한 지속적인 투자가 세계 시장에서 이 부문의 확고한 입지를 뒷받침할 것으로 예측됩니다.
가스 그리드 주입 부문은 2025년에 39.7%의 점유율을 차지했으며, 2026-2035년 연평균 성장률(CAGR) 6.8%로 성장할 전망입니다. 이러한 용도에서는 천연가스 수송 및 공급망에 통합하기 위해 필요한 품질 기준을 충족하는 바이오메탄으로, 처리되지 않은 바이오가스를 정제 및 업그레이드합니다. 지원적인 규제 체계, 유리한 네트워크 접근 정책, 그리고 인센티브 프로그램 덕분에 가스망 주입 프로젝트가 널리 채택되게 되었습니다. 그 결과, 이 방식은 안정적인 장기 시장 기회를 모색하는 많은 대규모 바이오메탄 생산 시설에 있어 바람직한 상업적 경로가 되고 있습니다.
북미의 바이오가스 정제 기술 시장은 2025년에 22%의 점유율을 차지했으며, 2035년까지 연평균 성장률(CAGR) 11.5%로 성장할 것으로 전망됩니다. 이 지역 시장 성장은 재생 가능 연료 정책, 저탄소 에너지 인프라에 대한 투자 확대, 그리고 재생 가능 천연가스에 대한 수요 증가에 힘입어 이루어지고 있습니다. 재생 가능 연료 생산을 촉진하기 위해 고안된 인센티브 프로그램은 프로젝트의 경제성을 지속적으로 향상시키고, 정제 시설 개발을 뒷받침하고 있습니다. 해당 지역의 배출량 감축, 에너지 다각화, 그리고 지속 가능한 대체 연료에 대한 적극적인 추진이 향후 10년 동안 투자 모멘텀을 유지하고 시장 성장을 뒷받침할 것으로 예측됩니다.
자주 묻는 질문
목차
제1장 조사 방법과 범위
제2장 주요 요약
제3장 업계 인사이트
제4장 경쟁 구도
제5장 시장 규모와 예측 : 기술별, 2022년-2035년
제6장 시장 규모와 예측 : 원료별, 2022년-2035년
제7장 시장 규모와 예측 : 용도별, 2022년-2035년
제8장 시장 규모와 예측 : 지역별, 2022년-2035년
제9장 기업 개요
LSH 26.07.14The Global Biogas Upgrading Technology Market was valued at USD 2 billion in 2025 and is estimated to grow at a CAGR of 11.2% to reach USD 5.9 billion.
Growth in the biogas upgrading technology market is fueled by evolving technology adoption patterns and expanding deployment across new geographic markets. Governments across Europe, North America, and selected Asia-Pacific countries are implementing renewable gas targets and biomethane production mandates that are creating long-term demand for upgrading capacity. These policy initiatives are reducing commercial uncertainty for project developers while encouraging investment throughout the value chain, including upgrading equipment and system installations. In addition, the increasing integration of carbon credit mechanisms, renewable gas certification systems, and corporate sustainability commitments is generating additional revenue opportunities for project operators. Enhanced revenue visibility and stronger financial returns are improving project viability, supporting greater capital investment in both medium- and large-scale biomethane upgrading facilities. As renewable energy adoption continues to accelerate globally, the biogas upgrading technology market is expected to benefit from sustained demand and favorable regulatory conditions throughout the forecast period.
| Market Scope | |
|---|---|
| Start Year | 2025 |
| Forecast Year | 2026-2035 |
| Start Value | $2 Billion |
| Forecast Value | $5.9 Billion |
| CAGR | 11.2% |
The pressure swing adsorption (PSA) segment held a 32% share in 2025 and is projected to grow at a CAGR of 8.9% through 2035. This technology separates carbon dioxide from methane through cyclical pressure-based processes utilizing specialized adsorption materials, enabling methane purity levels ranging from 96% to 99% without the use of chemical additives. PSA systems have achieved widespread adoption across biomethane production applications due to their operational reliability, scalability, and ability to deliver high-quality renewable gas output. Continued investment in efficient gas separation technologies is expected to support the segment's strong position within the global market.
The gas grid injection segment held a 39.7% share in 2025, advancing at a CAGR of 6.8% during 2026-2035. This application involves upgrading raw biogas into biomethane that meets required quality standards for integration into natural gas transmission and distribution networks. Supportive regulatory frameworks, favorable network access policies, and incentive programs have encouraged widespread adoption of grid injection projects. As a result, this pathway has become the preferred commercial route for many large-scale biomethane production facilities seeking stable long-term market opportunities.
North America Biogas Upgrading Technology Market accounted for 22% share in 2025 and is projected to grow at a CAGR of 11.5% through 2035. Regional market growth is being supported by renewable fuel policies, increasing investment in low-carbon energy infrastructure, and expanding demand for renewable natural gas. Incentive programs designed to promote renewable fuel production continue to improve project economics and encourage the development of upgrading facilities. The region's strong focus on emissions reduction, energy diversification, and sustainable fuel alternatives is expected to sustain investment momentum and reinforce market growth over the coming decade.
Major companies operating in the global biogas upgrading technology market include Air Liquide, Greenlane Renewables Inc., Pentair plc, Kanadevia Inova AG, DMT Clear Gas Solutions LLC, EnviTec Biogas, Bright Renewables, Malmberg Group, CarboTech AC GmbH, Evonik Industries, and Wartsila. Companies operating in the biogas upgrading technology market are focusing on innovation, strategic partnerships, and geographic expansion to strengthen their competitive position. Significant investments in research and development are enabling market participants to improve upgrading efficiency, enhance methane recovery rates, and reduce operating costs. Many companies are expanding their product portfolios with advanced and scalable solutions designed to meet diverse project requirements. Strategic collaborations with renewable energy developers, utilities, and industrial stakeholders are helping accelerate project deployment and broaden market reach. Firms are also strengthening service capabilities through long-term maintenance agreements, technical support programs, and digital monitoring solutions.
Table of Contents
Chapter 1 Methodology & Scope
- 1.1 Research approach
- 1.2 Quality commitments
- 1.2.1 GMI AI policy & data integrity commitment
- 1.2.1.1 Source consistency protocol
- 1.2.1 GMI AI policy & data integrity commitment
- 1.3 Research trail & confidence scoring
- 1.3.1 Research trail components
- 1.3.2 Scoring components
- 1.4 Data collection
- 1.4.1 Partial list of primary sources
- 1.5 Data mining sources
- 1.5.1 Paid sources
- 1.5.1.1 Sources, by region
- 1.5.1 Paid sources
- 1.6 Base estimates and calculations
- 1.6.1 Base year calculation for any one approach
- 1.7 Market estimates & forecasts parameters
- 1.8 Forecast model
- 1.8.1 Quantified market impact analysis
- 1.8.1.1 Mathematical impact of growth parameters on forecast
- 1.8.1 Quantified market impact analysis
- 1.9 Research transparency addendum
- 1.9.1 Source attribution framework
- 1.9.2 Quality assurance metrics
- 1.9.3 Our commitment to trust
- 1.10 Market definitions
Chapter 2 Executive Summary
- 2.1 Industry synopsis, 2022 - 2035
- 2.1.1 Business trends
- 2.1.2 Technology trends
- 2.1.3 Feedstock trends
- 2.1.4 Application trends
- 2.1.5 Regional trends
Chapter 3 Industry Insights
- 3.1 Industry ecosystem analysis
- 3.1.1 Feedstock & biogas production layer
- 3.1.2 Upgrading technology & equipment layer
- 3.1.3 Gas conditioning & compression layer
- 3.1.4 End-use & distribution layer
- 3.2 Regulatory landscape
- 3.3 Industry impact forces
- 3.3.1 Growth drivers
- 3.3.1.1 Tightening renewable energy mandates
- 3.3.1.2 Rising demand for biomethane as low-carbon fuel
- 3.3.1.3 Carbon credit programmes, green gas guarantees of origin & voluntary corporate decarbonization demand
- 3.3.2 Industry pitfalls and challenges
- 3.3.2.1 High capital intensity & extended payback periods
- 3.3.1 Growth drivers
- 3.4 Growth potential analysis
- 3.5 Porter's analysis
- 3.5.1 Bargaining power of suppliers
- 3.5.2 Bargaining power of buyers
- 3.5.3 Threat of new entrants
- 3.5.4 Threat of substitute
- 3.5.5 Intensity of competitive rivalry
- 3.6 PESTEL analysis
- 3.6.1 Political factors
- 3.6.2 Economic factors
- 3.6.3 Social factors
- 3.6.4 Technological factors
- 3.6.5 Environmental factors
- 3.6.6 Legal factors
- 3.7 Impact of AI and generative AI on the market (Driven by primary research)
- 3.7.1 AI-driven disruption of existing business model
- 3.7.2 GenAI use cases & adoption roadmap
- 3.7.3 Risks, limitations & regulatory considerations for AI in biogas operations
- 3.8 Investment & funding analysis (Driven by primary research)
- 3.8.1 Private equity & venture capital investment trends
- 3.8.2 Government grants, subsidies & incentive programmes
Chapter 4 Competitive Landscape, 2026
- 4.1 Introduction
- 4.2 Company market share analysis, by region, 2025
- 4.2.1 North America
- 4.2.2 Europe
- 4.2.3 Asia Pacific
- 4.2.4 Middle East & Africa
- 4.2.5 Latin America
- 4.3 Competitive analysis of major market players
- 4.4 Competitive positioning matrix
- 4.5 Key developments
- 4.5.1 Mergers & acquisitions
- 4.5.2 Partnerships & collaborations
- 4.5.3 New product launches
- 4.5.4 Expansion plans and funding
- 4.6 Company tier benchmarking
- 4.6.1 Tier classification criteria & qualifying thresholds
- 4.6.2 Tier positioning matrix by revenue, geography & innovation
Chapter 5 Market Size and Forecast, By Technology, 2022 - 2035 (USD Million)
- 5.1 Key trends
- 5.2 Water scrubbing
- 5.3 Chemical scrubbing
- 5.4 Pressure Swing Adsorption (PSA)
- 5.5 Membrane separation
- 5.6 Cryogenic separation
- 5.7 Others
Chapter 6 Market Size and Forecast, By Feedstock, 2022 - 2035 (USD Million)
- 6.1 Key trends
- 6.2 Agricultural residues & energy crops
- 6.3 Animal manure
- 6.4 Food & organic waste
- 6.5 Sewage sludge
- 6.6 Landfill gas
- 6.7 Others
Chapter 7 Market Size and Forecast, By Application, 2022 - 2035 (USD Million)
- 7.1 Key trends
- 7.2 Gas grid injection
- 7.3 Transportation fuel
- 7.4 Electricity & heat generation
- 7.5 Biomethane bottling & industrial use
- 7.6 Others
Chapter 8 Market Size and Forecast, By Region, 2022 - 2035 (USD Million)
- 8.1 Key trends
- 8.2 North America
- 8.2.1 U.S.
- 8.2.2 Canada
- 8.2.3 Mexico
- 8.3 Europe
- 8.3.1 Germany
- 8.3.2 UK
- 8.3.3 France
- 8.3.4 Netherlands
- 8.3.5 Italy
- 8.4 Asia Pacific
- 8.4.1 China
- 8.4.2 India
- 8.4.3 Japan
- 8.4.4 South Korea
- 8.4.5 Australia
- 8.5 Middle East & Africa
- 8.5.1 UAE
- 8.5.2 South Africa
- 8.6 Latin America
- 8.6.1 Brazil
- 8.6.2 Argentina
Chapter 9 Company Profiles
- 9.1 Air Liquide
- 9.2 Anaergia Inc.
- 9.3 Bio Energy
- 9.4 Bright Renewables
- 9.5 CarboTech AC GmbH
- 9.6 DMT Clear Gas Solutions LLC
- 9.7 Ennox Biogas Technology GmbH
- 9.8 EnviTec Biogas
- 9.9 Evonik Industries
- 9.10 FNX LNG
- 9.11 GMT Membrantechnik GmbH
- 9.12 Greenlane Renewables Inc.
- 9.13 Kanadevia Inova AG
- 9.14 Malmberg Group
- 9.15 Memsys GmbH
- 9.16 Pentair plc
- 9.17 Prodeval
- 9.18 Veolia
- 9.19 Wartsila
- 9.20 Xebec Adsorption Inc.