

|
시장보고서
상품코드
2101559
유전 서비스 시장 기회, 성장 촉진요인, 업계 동향 분석 및 예측(2026-2035년)Oilfield Services Market Opportunity, Growth Drivers, Industry Trend Analysis, and Forecast 2026 - 2035 |
||||||

세계의 유전 서비스 시장은 2025년에 1,297억 달러 규모에 달하고, CAGR 4.7%로 성장하여 2035년까지 2,061억 달러에 달할 것으로 추정됩니다.
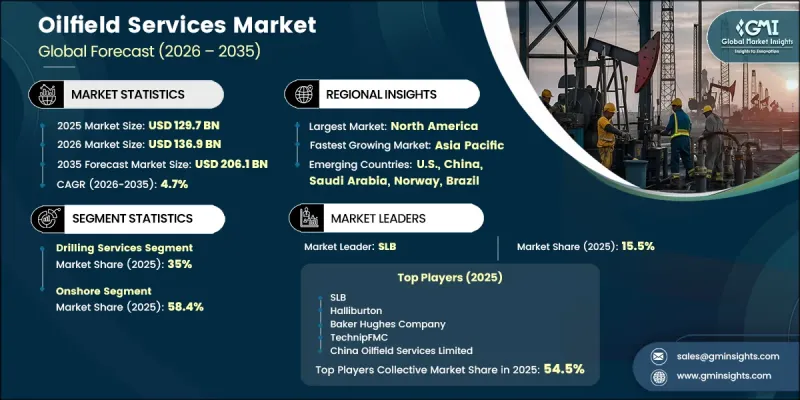
시장의 확대는 운영사의 투자 우선순위에 대한 장기적인 변화를 지속적으로 반영하고 있으며, 탐사에 중점을 둔 지출보다 유전 개발, 생산성 향상 및 기존 자산의 회수율 극대화가 더욱 중요시되고 있습니다. 해양 개발, 성숙 자산의 최적화, 그리고 첨단 디지털 유전 솔루션에 대한 투자 증가는 전문 서비스 제공업체에 대한 장기적인 수요를 지속적으로 뒷받침하고 있습니다. 동시에, 자동 시추 기술, 통합형 서비스, 인공지능(AI)을 활용한 생산 관리 솔루션의 도입이 진행됨에 따라 운영 효율이 향상되고 유정 전체의 비용이 절감되는 한편, 유정 수명주기 전반에 걸쳐 서비스 수요가 증가하고 있습니다. 비전통적 탄화수소 자원의 상업화가 지속되고, 시추, 저류층 관리, 생산 업무에 디지털 기술이 급속히 통합됨에 따라 서비스 제공 모델이 근본적으로 재구성되고, 운영 성과가 향상되며, 전 세계 유전 서비스 시장 전반에 걸쳐 지속적인 성장 기회가 창출되고 있습니다.
| 시장 범위 | |
|---|---|
| 시작 연도 | 2025년 |
| 예측 기간 | 2026-2035년 |
| 시작 시점 시장 규모 | 1,297억 달러 |
| 예측액 | 2,061억 달러 |
| CAGR | 4.7% |
시추 서비스 부문은 2025년에 35%의 점유율을 차지했으며, 2035년까지 연평균 성장률(CAGR) 4.6%로 성장할 것으로 전망됩니다. 이 부문이 계속해서 주도적인 위치를 유지하는 이유는 시추 활동이 업스트림 사업의 기반을 이루고 있으며, 그 이후의 모든 생산 관련 서비스는 유정 건설 및 재개발의 성공에 의존하기 때문입니다. 시추 서비스에서 창출되는 수익에는 방향성 시추, 시추 중 측정(MWD), 시추 중 지층 분석(LWD), 회전식 조향 시스템(RSS), 드릴 비트 및 시멘트 주입 서비스가 포함됩니다. 기술적으로 진보된 시추 솔루션에 대한 수요 증가는 고부가가치 서비스 부문을 지속적으로 견인하고 있습니다. 이는 유정 설계가 점점 더 복잡해짐에 따라 시추 과정 전반에 걸쳐 더 높은 정밀도, 효율성 및 운영 신뢰성이 요구되기 때문입니다.
2025년에는 육상 사업 부문이 시장 점유율의 58.4%를 차지했으며, 2026년부터 2035년까지 연평균 성장률(CAGR) 4.4%로 성장할 것으로 전망됩니다. 기존 및 비전통 탄화수소 자원의 지속적인 개발에 더해, 시추, 유정 유지 관리, 생산 증대 프로그램이 지속됨에 따라 육상 서비스에 대한 견조한 수요가 계속해서 뒷받침되고 있습니다. 수평 유정의 연장, 완공 공사의 증가, 그리고 생산 중인 유정 수의 확대로 인해 개입 작업, 인공 채유 시스템 최적화 및 유지보수 서비스에 대한 안정적인 수요가 지속적으로 창출되고 있습니다. 신규 시추 활동에 비해 이러한 생산 지원 서비스는 일반적으로 더 안정적인 수익원이 되어, 육상 사업 전반에 걸친 유전 서비스 제공업체에 대한 장기적인 수요 유지에 기여하고 있습니다.
2025년, 북미 유전 서비스 시장은 30.9%의 점유율을 차지했는데, 이는 해당 지역의 업스트림 산업이 비교적 성숙해 있으며, 원자재 가격 변동의 영향을 더 크게 받기 쉬운 점을 반영한 것입니다. 이 지역에서 사업을 전개하는 서비스 제공업체들은 운영사의 지출 변동이 시추 완료 공사 및 시추 활동 수요에 영향을 미치기 때문에 여전히 주기적인 가격 압박에 직면해 있습니다. 이러한 시장 역학은 해당 지역에서 대규모 사업을 전개하는 기업의 수익성에 영향을 미치고 있으며, 변화하는 시장 환경 속에서 경쟁력을 유지하기 위해서는 업무 효율성 향상, 서비스 포트폴리오 다각화, 그리고 지리적 확장 확대가 중요함을 여실히 보여주고 있습니다.
자주 묻는 질문
목차
제1장 조사 방법과 범위
제2장 주요 요약
제3장 업계 인사이트
제4장 경쟁 구도
제5장 시장 규모 및 예측 : 서비스별, 2022-2035년
제6장 시장 규모 및 예측 : 설치 형태별, 2022-2035년
제7장 시장 규모 및 예측 : 유정 유형별, 2022-2035년
제8장 시장 규모 및 예측 : 용도별, 2022-2035년
제9장 시장 규모 및 예측 : 지역별, 2022-2035년
제10장 기업 개요
KSM 26.08.04The Global Oilfield Services Market was valued at USD 129.7 billion in 2025 and is estimated to grow at a CAGR of 4.7% to reach USD 206.1 billion by 2035.
Market expansion continues to reflect a long-term transition in operator investment priorities, with greater emphasis on field development, production enhancement, and maximizing recovery from existing assets rather than exploration-focused spending. Rising investments in offshore developments, mature asset optimization, and advanced digital oilfield solutions continue to reinforce long-term demand for specialized service providers. At the same time, the increasing adoption of automated drilling technologies, integrated service offerings, and artificial intelligence-based production management solutions is improving operational efficiency, lowering overall well costs, and increasing service requirements throughout the entire well lifecycle. The continued commercialization of unconventional hydrocarbon resources and the rapid integration of digital technologies into drilling, reservoir management, and production operations are fundamentally reshaping service delivery models, improving operational performance, and creating sustained growth opportunities across the global oilfield services market.
| Market Scope | |
|---|---|
| Start Year | 2025 |
| Forecast Year | 2026-2035 |
| Start Value | $129.7 Billion |
| Forecast Value | $206.1 Billion |
| CAGR | 4.7% |
The drilling services segment held 35% share in 2025 and is projected to grow at a CAGR of 4.6% through 2035. This segment continues to maintain its leading position because drilling activities form the foundation of upstream operations, making every subsequent production-related service dependent on successful well construction and redevelopment. Revenue generated from drilling services includes directional drilling, measurement-while-drilling (MWD), logging-while-drilling (LWD), rotary steerable systems (RSS), drill bits, and cementing services. Growing demand for technically advanced drilling solutions continues to support higher-value service categories, as increasingly complex well designs require greater precision, efficiency, and operational reliability throughout the drilling process.
The onshore activities segment accounted for 58.4% share in 2025 and is forecast to grow at a CAGR of 4.4% during 2026-2035. Strong demand for onshore services remains supported by the continued development of both conventional and unconventional hydrocarbon resources, as well as sustained drilling, well maintenance, and production enhancement programs. Longer horizontal wells, higher completion intensity, and the expanding inventory of producing wells continue to generate stable demand for intervention, artificial lift optimization, and maintenance services. Compared with new drilling activity, these production support services generally provide a more consistent source of revenue, helping sustain long-term demand for oilfield service providers across onshore operations.
North America Oilfield Services Market held 30.9% share in 2025, reflecting the comparatively mature nature of its upstream industry and its greater exposure to fluctuations in commodity prices. Service providers operating within the region continue to experience periodic pricing pressure as changes in operator spending influence demand for completion and drilling activities. These market dynamics have affected profitability for companies with significant regional exposure, reinforcing the importance of operational efficiency, diversified service portfolios, and broader geographic presence to maintain competitive performance during changing market conditions.
Major companies operating in the global oilfield services market include Ades Holding, Archer, Baker Hughes Company, Cactus Wellhead, ChampionX, China Oilfield Services Limited, Expro Holdings, Halliburton, Helmerich & Payne, Hunting, Liberty Energy, Nabors Industries, NOV, Oceaneering International, Patterson-UTI Energy, Precision Drilling Corporation, SLB, Superior Energy Services, TAQA KSA, TechnipFMC, Tenaris, and Weatherford International. Companies operating in the oilfield services market are strengthening their market position by expanding integrated service portfolios, investing in advanced drilling technologies, and accelerating digital transformation initiatives. Many providers are prioritizing automation, artificial intelligence, data analytics, and remote operations to improve operational efficiency while reducing project costs for customers. Strategic partnerships, long-term service agreements, and selective acquisitions continue to enhance technical capabilities and broaden geographic reach. Market participants are also focusing on expanding production optimization services, improving equipment reliability, and increasing investments in research and development to deliver higher-value solutions.
Table of Contents
Chapter 1 Methodology & Scope
- 1.1 Research approach
- 1.2 Quality commitments
- 1.2.1 GMI AI policy & data integrity commitment
- 1.2.1.1 Source consistency protocol
- 1.2.1 GMI AI policy & data integrity commitment
- 1.3 Research trail & confidence scoring
- 1.3.1 Research trail components
- 1.3.2 Scoring components
- 1.4 Data collection
- 1.4.1 Partial list of primary sources
- 1.5 Data mining sources
- 1.5.1 Paid sources
- 1.5.1.1 Sources, by region
- 1.5.1 Paid sources
- 1.6 Base estimates and calculations
- 1.6.1 Base year calculation for any one approach
- 1.7 Market estimates & forecasts parameters
- 1.8 Forecast model
- 1.8.1 Quantified market impact analysis
- 1.8.1.1 Mathematical impact of growth parameters on forecast
- 1.8.1 Quantified market impact analysis
- 1.9 Research transparency addendum
- 1.9.1 Source attribution framework
- 1.9.2 Quality assurance metrics
- 1.9.3 Our commitment to trust
- 1.10 Market definitions
Chapter 2 Executive Summary
- 2.1 Industry synopsis, 2022 - 2035
- 2.1.1 Business trends
- 2.1.2 Service trends
- 2.1.3 Installation trends
- 2.1.4 Well type trends
- 2.1.5 Application trends
- 2.1.6 Regional trends
Chapter 3 Industry Insights
- 3.1 Industry ecosystem analysis
- 3.1.1 Raw material availability & sourcing analysis
- 3.1.2 Manufacturing capacity assessment
- 3.1.3 Supply chain resilience & risk factors
- 3.1.4 Distribution network analysis
- 3.2 Industry impact forces
- 3.2.1 Growth drivers
- 3.2.2 Industry pitfalls & challenges
- 3.3 Regulatory landscape
- 3.4 Growth potential analysis
- 3.5 Porter's analysis
- 3.5.1 Bargaining power of suppliers
- 3.5.2 Bargaining power of buyers
- 3.5.3 Threat of new entrants
- 3.5.4 Threat of substitutes
- 3.6 PESTEL analysis
- 3.6.1 Political factors
- 3.6.2 Economic factors
- 3.6.3 Social factors
- 3.6.4 Technological factors
- 3.6.5 Legal factors
- 3.6.6 Environmental factors
- 3.7 Cost structure analysis of oilfield services
- 3.8 Emerging opportunities in the oilfield services industry
- 3.9 Digital transformation and intelligent oilfield operations
- 3.10 Expansion across frontier basins and high-growth upstream markets
- 3.11 Capital investment trends and future growth outlook
- 3.12 Impact of AI & Generative AI on the market (Driven by Primary Research)
- 3.12.1 AI-Driven production optimization (Driven by Primary Research)
- 3.12.2 Predictive maintenance & fault detection (Driven by Primary Research)
Chapter 4 Competitive Landscape, 2026
- 4.1 Introduction
- 4.2 Company market share analysis, by region, 2025
- 4.2.1 North America
- 4.2.2 Europe
- 4.2.3 Asia Pacific
- 4.2.4 Middle East & Africa
- 4.2.5 Latin America
- 4.3 Competitive analysis of major market players
- 4.4 Competitive positioning matrix
- 4.5 Key developments
- 4.5.1 Mergers & acquisitions
- 4.5.2 Partnerships & collaborations
- 4.5.3 New product launches
- 4.5.4 Expansion plans & funding
- 4.6 Company tier benchmarking
- 4.6.1 Tier classification criteria & qualifying thresholds
- 4.6.2 Tier positioning matrix by revenue, geography & innovation
Chapter 5 Market Size and Forecast, By Service, 2022 - 2035 (USD Million)
- 5.1 Key trends
- 5.2 Drilling services
- 5.3 Completion services
- 5.4 Production services
- 5.5 Reservoir evaluation services
- 5.6 Well intervention & workover services
- 5.7 Others
Chapter 6 Market Size and Forecast, By Installation, 2022 - 2035 (USD Million)
- 6.1 Key trends
- 6.2 Onshore
- 6.3 Offshore
Chapter 7 Market Size and Forecast, By Well Type, 2022 - 2035 (USD Million)
- 7.1 Key trends
- 7.2 Conventional wells
- 7.3 Unconventional wells
Chapter 8 Market Size and Forecast, By Application, 2022 - 2035 (USD Million)
- 8.1 Key trends
- 8.2 Exploration
- 8.3 Development
- 8.4 Production
- 8.5 Decommissioning
Chapter 9 Market Size and Forecast, By Region, 2022 - 2035 (USD Million)
- 9.1 Key trends
- 9.2 North America
- 9.2.1 U.S.
- 9.2.2 Canada
- 9.2.3 Mexico
- 9.3 Europe
- 9.3.1 Norway
- 9.3.2 UK
- 9.3.3 Netherlands
- 9.3.4 Denmark
- 9.3.5 Germany
- 9.3.6 France
- 9.3.7 Italy
- 9.3.8 Spain
- 9.4 Asia Pacific
- 9.4.1 China
- 9.4.2 India
- 9.4.3 Australia
- 9.4.4 Indonesia
- 9.4.5 Malaysia
- 9.4.6 Thailand
- 9.4.7 Vietnam
- 9.4.8 South Korea
- 9.5 Middle East & Africa
- 9.5.1 Saudi Arabia
- 9.5.2 UAE
- 9.5.3 Qatar
- 9.5.4 Kuwait
- 9.5.5 Oman
- 9.5.6 Bahrain
- 9.5.7 Nigeria
- 9.5.8 Algeria
- 9.5.9 Egypt
- 9.5.10 Angola
- 9.6 Latin America
- 9.6.1 Brazil
- 9.6.2 Argentina
- 9.6.3 Peru
Chapter 10 Company Profiles
- 10.1 Ades Holding
- 10.2 Archer
- 10.3 Baker Hughes Company
- 10.4 Cactus Wellhead
- 10.5 ChampionX
- 10.6 China Oilfield Services Limited
- 10.7 EXPRO HOLDINGS
- 10.8 Halliburton
- 10.9 Helmerich & Payne
- 10.10 Hunting
- 10.11 Liberty Energy
- 10.12 Nabors Industries
- 10.13 NOV
- 10.14 Oceaneering International
- 10.15 Patterson-UTI Energy
- 10.16 Precision Drilling Corporation
- 10.17 SLB
- 10.18 Superior Energy Services
- 10.19 TAQA KSA
- 10.20 TechnipFMC
- 10.21 Tenaris
- 10.22 Weatherford International


