

|
시장보고서
상품코드
2101612
해양 이산화탄소 제거 시장 기회, 성장 촉진요인, 업계 동향 분석 및 예측(2026-2035년)Ocean Carbon Dioxide Removal Market Opportunity, Growth Drivers, Industry Trend Analysis, and Forecast 2026 - 2035 |
||||||

세계의 해양 이산화탄소 제거(CDR) 시장은 2025년에 7억 3,000만 달러 규모에 달하고, 2035년까지 CAGR 19.9%로 성장하여 44억 3,000만 달러에 달할 것으로 추정됩니다.
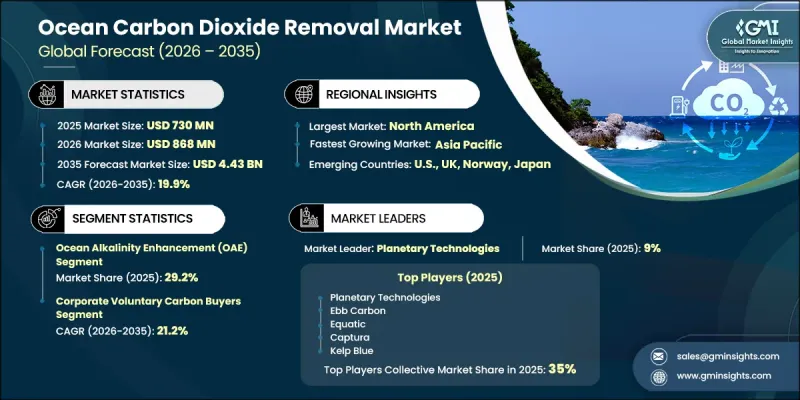
이 시장은 그동안 주로 맹그로브와 해초 복원을 중심으로 한 자연 기반 ‘블루 카본’ 접근 방식이 주류를 이루었으나, 상업적 인프라는 제한적이었고 통일된 인증 시스템도 존재하지 않았습니다. 2022년 이후, 인공 해양 이산화탄소 제거 기술이 검증된 현장 도입을 통해 측정 가능한 탄소 격리 성과를 보여주기 시작하면서 이 분야는 구조적인 변화를 겪고 있습니다. 업계는 현재 조사 주도형 자금 조달 모델에서 상업적으로 구축된 이산화탄소 제거 이행 계약으로 전환되고 있습니다. 검증된 탄소 제거는 시장 진입 기업의 중요한 요건이 되었으며, 독립적인 등록 기관에 의한 검증이 구매자의 신뢰를 얻기 위한 주요 기준으로 부상하고 있습니다. 인증된 크레딧 발행을 달성한 사업자는 검증받지 않은 참여자에 비해 더 높은 가격 책정이나 장기 계약을 확보할 수 있는 사례가 늘고 있습니다. 해양 기반 탄소 제거 크레딧은 아직 규제 준수 시장의 일부는 아니지만, 해운 업계 이해관계자들은 향후 규제에 편입될 것을 염두에 두고 초기 단계의 조달 전략을 적극적으로 수립하고 있습니다. 주요 해운 사업자들은 향후 규제 준수 체계로의 통합을 염두에 두고 이미 장기적인 인수 계약을 체결하기 시작했습니다. 신뢰할 수 있고 지속가능한 탄소 제거 솔루션에 대한 기업의 선호도가 높아짐에 따라, 해양 CDR 생태계 전반의 수요는 지속적으로 재편되고 있으며, 검증되고 기술을 활용한 제거 경로로 전환되는 추세가 가속화되고 있습니다.
| 시장 범위 | |
|---|---|
| 시작 연도 | 2025년 |
| 예측 기간 | 2026-2035년 |
| 초기 시장 규모 | 7억 3,000만 달러 |
| 예측액 | 44억 3,000만 달러 |
| CAGR | 19.9% |
해양 알칼리도 향상(OAE)은 29.2%의 점유율을 차지하고 있으며, 2035년까지 연평균 성장률(CAGR) 21.6%로 성장할 것으로 예측됩니다. 이 기법은 칼슘과 마그네슘을 주성분으로 하는 알칼리성 광물 화합물을 해수에 도입함으로써 해양의 천연 탄소 흡수 능력을 높이고, 이를 통해 중탄산염의 완충 작용을 강화하여 장기적인 탄소 저장 효율을 향상시킵니다.
기업의 자발적 탄소 크레딧 구매자는 38%의 점유율을 차지하고 있으며, 2035년까지 연평균 성장률(CAGR) 21.2%로 성장할 것으로 예상됩니다. 이 범주에는 기술, 항공, 금융 서비스, 소비재 산업에 걸친 다국적 기업들이 포함되어 있으며, 자발적인 기후 변화 대응 공약을 달성하기 위해 해양 유래 탄소 제거 크레딧에 대한 투자를 확대하고 있습니다. 시장 수요는 고품질의 검증된 탄소 제거 크레딧으로 이동하고 있으며, 구매자들은 추가성과 장기적인 지속성을 입증하는 내구성이 높고 신뢰할 수 있는 탄소 상쇄를 확보하기 위해 톤당 200-400달러를 지불하고 있습니다.
북미의 해양 이산화탄소 제거(CDR) 시장은 2025년에 39.4%의 점유율을 차지했으며, 2035년까지 연평균 성장률(CAGR) 18.5%로 성장할 것으로 전망됩니다. 이 지역 내에서 미국이 가장 큰 기여국으로 부상하고 있으며, 이는 탄소 제거 혁신에 초점을 맞춘 연방 정부의 강력한 연구 이니셔티브와 자금 지원 프로그램에 힘입은 결과입니다. 제거 비용 절감과 측정·보고·검증(MRV) 역량 확대를 목표로 한 정부 주도의 노력에 힘입어, 지역 전체의 기술 개발과 상용화가 계속해서 가속화되고 있습니다.
자주 묻는 질문
목차
제1장 조사 방법과 범위
제2장 주요 요약
제3장 업계 인사이트
제4장 경쟁 구도
제5장 시장 규모 및 예측 : 기술별, 2022-2035년
제6장 시장 규모 및 예측 : 전개별, 2022-2035년
제7장 시장 규모 및 예측 : 최종사용별, 2022-2035년
제8장 시장 규모 및 예측 : 지역별, 2022-2035년
제9장 기업 개요
KSM 26.08.04The Global Ocean Carbon Dioxide Removal (CDR) Market was valued at USD 730 million in 2025 and is estimated to grow at a CAGR of 19.9% to reach USD 4.43 billion by 2035.
The market has historically been dominated by nature-based blue carbon approaches, largely centered on mangrove and seagrass restoration, which operated with limited commercial infrastructure and without a unified certification system. Since 2022, the sector has undergone a structural transformation as engineered ocean carbon removal technologies have begun to demonstrate measurable carbon sequestration results through verified field deployments. The industry is now transitioning from research-led funding models toward commercially structured carbon removal delivery contracts. Verified carbon removal has become a critical requirement for market participation, with independent registry validation emerging as a key benchmark for buyer confidence. Operators that achieve certified issuance are increasingly able to secure higher pricing and longer-term agreements compared to non-verified participants. Although ocean-based carbon removal credits are not yet part of compliance markets, maritime stakeholders are actively developing early-stage procurement strategies in anticipation of future regulatory inclusion. Large shipping operators have already initiated long-term offtake arrangements, reflecting expectations of eventual integration into compliance frameworks. Growing corporate preference for high-integrity, durable carbon removal solutions continues to reshape demand across the ocean CDR ecosystem, reinforcing the transition toward verified, technology-enabled removal pathways.
| Market Scope | |
|---|---|
| Start Year | 2025 |
| Forecast Year | 2026-2035 |
| Start Value | $730 Million |
| Forecast Value | $4.43 Billion |
| CAGR | 19.9% |
Ocean alkalinity enhancement (OAE) accounted for 29.2% share and is projected to grow at a CAGR of 21.6% through 2035. This approach increases the ocean's natural carbon absorption capacity by introducing alkaline mineral compounds such as calcium- and magnesium-based materials into seawater, thereby strengthening bicarbonate buffering processes and enhancing long-term carbon storage efficiency.
The corporate voluntary carbon purchasers represented 38% share and is expected to grow at a CAGR of 21.2% through 2035. This category includes multinational corporations across technology, aviation, financial services, and consumer industries that are increasingly investing in ocean-based carbon removal credits to meet voluntary climate commitments. Market demand is shifting toward high-quality, verified carbon removal credits, with buyers paying between USD 200-400 per tonne to secure durable, high-integrity carbon offsets that demonstrate additionality and long-term permanence.
North America Ocean Carbon Dioxide Removal (CDR) Market held 39.4% share in 2025 and is projected to grow at a CAGR of 18.5% during 2035. The United States represents the dominant contributor within the region, supported by strong federal research initiatives and funding programs focused on carbon removal innovation. Government-backed efforts aimed at reducing removal costs and expanding measurement, reporting, and verification capabilities continue to accelerate technology development and commercialization across the region.
Major companies operating in the global ocean carbon dioxide removal industry include Captura, Carboniferous, CarbonRun, Ebb Carbon, Equatic, Gigablue, Heimdal, Kelp Blue, Ocean Visions, Inc., Planetary Technologies, Seafields Solutions Ltd., SeaO2, SOS Carbon, Vesta, and Vycarb. Companies operating in the ocean carbon dioxide removal market are strengthening their competitive position by advancing technology development, expanding pilot-scale deployments, and securing long-term offtake agreements with corporate buyers. Many organizations are investing heavily in measurement, reporting, and verification systems to ensure credibility and compliance with emerging registry standards. Strategic collaborations with research institutions, maritime operators, and climate-focused organizations help accelerate technology validation and commercial scaling. Companies are also focusing on cost reduction through process optimization, materials innovation, and scalable deployment models to improve economic viability.
Table of Contents
Chapter 1 Methodology & Scope
- 1.1 Research approach
- 1.2 Quality commitments
- 1.2.1 GMI AI policy & data integrity commitment
- 1.2.1.1 Source consistency protocol
- 1.2.1 GMI AI policy & data integrity commitment
- 1.3 Research trail & confidence scoring
- 1.3.1 Research trail components
- 1.3.2 Scoring components
- 1.4 Data collection
- 1.4.1 Partial list of primary sources
- 1.5 Data mining sources
- 1.5.1 Paid sources
- 1.5.1.1 Sources, by region
- 1.5.1 Paid sources
- 1.6 Base estimates and calculations
- 1.6.1 Base year calculation for any one approach
- 1.7 Market estimates & forecasts parameters
- 1.8 Forecast model
- 1.8.1 Quantified market impact analysis
- 1.8.1.1 Mathematical impact of growth parameters on forecast
- 1.8.1 Quantified market impact analysis
- 1.9 Research transparency addendum
- 1.9.1 Source attribution framework
- 1.9.2 Quality assurance metrics
- 1.9.3 Our commitment to trust
- 1.10 Market definitions
Chapter 2 Executive Summary
- 2.1 Industry synopsis, 2022 - 2035
- 2.1.1 Business trends
- 2.1.2 Technology trends
- 2.1.3 Deployment trends
- 2.1.4 End use trends
- 2.1.5 Regional trends
Chapter 3 Industry Insights
- 3.1 Industry ecosystem analysis
- 3.1.1 Technology developers & solution providers
- 3.1.2 MRV service providers & carbon registries
- 3.1.3 Carbon credit buyers & intermediaries
- 3.1.4 Regulatory & governance bodies
- 3.2 Technology & innovation landscape
- 3.2.1 Technology Readiness Level (TRL) assessment
- 3.2.2 Emerging R&D frontiers
- 3.3 Regulatory landscape
- 3.3.1 International governance
- 3.3.2 National & regional permitting frameworks
- 3.3.3 Emerging ocean CDR-specific regulatory proposals
- 3.4 Industry impact forces
- 3.4.1 Growth drivers
- 3.4.1.1 Accelerating corporate net-zero commitments & voluntary carbon market demand
- 3.4.1.2 IMO GHG Decarbonization strategy driving maritime sector engagement with ocean CDR
- 3.4.1.3 Government policy support & public R&D funding programs
- 3.4.2 Industry pitfalls and challenges
- 3.4.2.1 High cost of scale-up & persistent technology readiness gaps
- 3.4.1 Growth drivers
- 3.5 Growth potential analysis
- 3.6 Porter's analysis
- 3.6.1 Bargaining power of suppliers
- 3.6.2 Bargaining power of buyers
- 3.6.3 Threat of new entrants
- 3.6.4 Threat of substitute
- 3.6.5 Intensity of competitive rivalry
- 3.7 PESTEL analysis
- 3.7.1 Political factors
- 3.7.2 Economic factors
- 3.7.3 Social factors
- 3.7.4 Technological factors
- 3.7.5 Environmental factors
- 3.7.6 Legal factors
- 3.8 Impact of AI and generative AI on the market (Driven by primary research)
- 3.8.1 AI-driven disruption of existing business model
- 3.8.2 GenAI use cases & adoption roadmap
- 3.8.3 Risks, limitations & regulatory considerations
- 3.9 Investment & Funding Analysis (Driven by primary research)
- 3.9.1 Venture capital & private equity investment trends
- 3.9.2 Government grants & philanthropic
- 3.9.3 Carbon Credit pre-purchase agreements as financing mechanism
Chapter 4 Competitive Landscape, 2026
- 4.1 Introduction
- 4.2 Company market share analysis, by region, 2025
- 4.2.1 By region
- 4.2.1.1 North America
- 4.2.1.2 Europe
- 4.2.1.3 Asia Pacific
- 4.2.1.4 Middle East & Africa
- 4.2.1.5 Latin America
- 4.2.2 Market concentration analysis
- 4.2.1 By region
- 4.3 Competitive analysis of major market players
- 4.4 Competitive positioning matrix
- 4.5 Key developments
- 4.5.1 Mergers & acquisitions
- 4.5.2 Partnerships & collaborations
- 4.5.3 New product launches
- 4.5.4 Expansion plans & funding
- 4.6 Company tier benchmarking
- 4.6.1 Tier classification criteria & qualifying thresholds
- 4.6.2 Tier positioning matrix by revenue, geography & innovation
Chapter 5 Market Size and Forecast, By Technology, 2022 - 2035 (USD Million)
- 5.1 Key trends
- 5.2 Ocean Alkalinity Enhancement (OAE)
- 5.3 Direct Ocean Capture (DOC)
- 5.4 Macroalgae/seaweed cultivation & sinking
- 5.5 Microalgae propagation & ocean fertilization
- 5.6 Coastal blue carbon ecosystem restoration
- 5.7 Others
Chapter 6 Market Size and Forecast, By Deployment, 2022 - 2035 (USD Million)
- 6.1 Key trends
- 6.2 Open ocean
- 6.3 Coastal & near shore
- 6.4 Land-Based / closed seawater
Chapter 7 Market Size and Forecast, By End Use, 2022 - 2035 (USD Million)
- 7.1 Key trends
- 7.2 Corporate voluntary carbon buyers
- 7.3 Government carbon programs
- 7.4 Maritime industry
- 7.5 Energy companies
- 7.6 Carbon project developers & investors
Chapter 8 Market Size and Forecast, By Region, 2022 - 2035 (USD Million)
- 8.1 Key trends
- 8.2 North America
- 8.2.1 U.S.
- 8.2.2 Canada
- 8.3 Europe
- 8.3.1 Germany
- 8.3.2 UK
- 8.3.3 Norway
- 8.4 Asia Pacific
- 8.4.1 Japan
- 8.4.2 South Korea
- 8.4.3 Australia
- 8.5 Middle East & Africa
- 8.5.1 Saudi Arabia
- 8.5.2 South Africa
- 8.6 Latin America
- 8.6.1 Brazil
Chapter 9 Company Profiles
- 9.1 Captura
- 9.2 Carboniferous
- 9.3 CarbonRun
- 9.4 Ebb Carbon
- 9.5 Equatic
- 9.6 Gigablue
- 9.7 Heimdal
- 9.8 Kelp Blue
- 9.9 Ocean Visions, Inc.
- 9.10 Planetary Technologies
- 9.11 Running Tide
- 9.12 Seafields Solutions Ltd.
- 9.13 SeaO2
- 9.14 SOS Carbon
- 9.15 Vesta
- 9.16 Vycarb


