

|
시장보고서
상품코드
2101661
자동차용 USB 파워 딜리버리 시스템 시장 기회, 성장 촉진요인, 업계 동향 분석 및 예측(2026-2035년)Automotive USB Power Delivery System Market Opportunity, Growth Drivers, Industry Trend Analysis, and Forecast 2026 - 2035 |
||||||

세계의 자동차용 USB 파워 딜리버리 시스템 시장은 2025년에 20억 달러 규모에 달하고, CAGR 9.7%로 성장하여 2035년까지 51억 달러에 달할 것으로 추정됩니다.
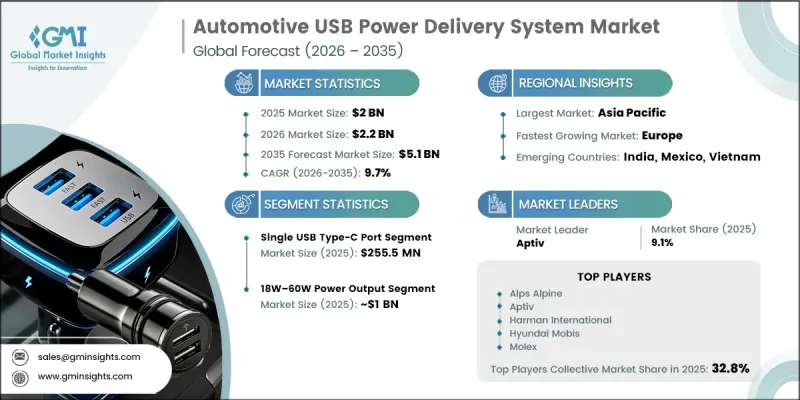
이러한 성장은 배터리식 전기자동차(BEV) 및 PHEV(플러그인 하이브리드차)로의 전 세계적 전환에 힘입어 가속화되고 있으며, 차량 내 고출력 USB 충전 아키텍처에 대한 지속적인 수요를 창출하고 있습니다. 주요 자동차 시장에서 전기자동차 보급률이 20-25% 범위에 근접함에 따라, 각 OEM 업체들은 포트당 60W-140W의 출력을 지원할 수 있는 USB Power Delivery(PD) 3.1 규격의 멀티포트 시스템을 점점 더 많이 채택하고 있으며, 60W-100W 및 100W 이상과 같은 고출력 부문의 수요를 가속화하고 있습니다. EV 플랫폼의 확대와 고급 USB PD의 통합이 맞물려, 이것이 시장 성장을 견인하는 주요 요인이 되고 있습니다. 동시에, 차량 내 급속 충전에 대한 소비자의 기대는 스마트폰 충전 규격과 일치해 가고 있습니다. 최신 기기에서는 이동 중 효율적인 급속 충전을 위해 45W-65W가 필요합니다. 이에 따라 1차 공급업체들은 인포테인먼트 아키텍처에 USB PD 컨트롤러 IC를 통합하도록 유도받고 있으며, 열로 인한 전력 제한 없이 여러 기기를 안정적으로 충전할 수 있게 되어 차량 내 전체 전력 분배 효율이 향상되고 있습니다.
| 시장 범위 | |
|---|---|
| 시작 연도 | 2025년 |
| 예측 기간 | 2026-2035년 |
| 개시 금액 | 20억 달러 |
| 예측 금액 | 51억 달러 |
| CAGR | 9.7% |
단일 USB Type-C 포트 부문은 2025년에 2억 5,550만 달러의 시장 규모를 기록했습니다. 이러한 성장은 프리미엄 차량 및 전기자동차 아키텍처에서의 조기 도입을 반영한 것으로, 이러한 플랫폼에서는 앞좌석 배치에서 Type-C 인터페이스가 주요 충전 지점으로 점점 더 많이 채택되고 있습니다. 많은 설계에서 유선 고출력 전원 공급은 무선 충전 시스템을 대체하는 것이 아니라 이를 보완하는 형태로 채택되고 있어, 현대 자동차 실내 생태계에서 Type-C 도입의 중요성이 더욱 높아지고 있습니다.
60W-100W 출력 부문은 2025년에 2억 6,690만 달러의 시장 규모를 기록했으며, 2035년까지 연평균 성장률(CAGR)은 18.4%에 달할 전망입니다. 이러한 성장은 프리미엄 차량이나 차량 내 이용 시간이 긴 전기자동차, 그리고 장거리 이동 시의 편의성과 연결성을 중시하여 설계된 뒷좌석용 엔터테인먼트 시스템에서 각 OEM 업체들이 중-고출력 USB 충전 시스템을 조기에 탑재한 것이 원동력이 되고 있습니다.
북미 자동차용 USB 파워 딜리버리 시스템 시장은 2025년에 4억 5,900만 달러에 달했으며, 2026년부터 2035년까지 연평균 성장률(CAGR) 10.5%로 성장하여 2035년에는 12억 4,000만 달러에 달할 것으로 전망됩니다. 이 지역의 시장 성장은 전기자동차(EV)의 급속한 보급, 차량당 USB 포트 밀도의 향상, 그리고 라이드셰어링, 물류, 상업용 운송 분야에서의 전기화 차량 도입 확대에 힘입고 있습니다. 이러한 구조적 요인으로 인해 승용차 및 상용차 두 부문 모두에서 첨단 차량용 전력 공급 시스템에 대한 수요가 지속적으로 증가하고 있습니다.
자주 묻는 질문
목차
제1장 조사 방법
제2장 주요 요약
제3장 업계 인사이트
제4장 경쟁 구도
제5장 시장 추정 및 예측 : 커넥터별, 2022-2035년
제6장 시장 추정 및 예측 : 출력별, 2022-2035년
제7장 시장 추정 및 예측 : 용도별, 2022-2035년
제8장 시장 추정 및 예측 : 차량별, 2022-2035년
제9장 시장 추정 및 예측 : 차량 추진별, 2022-2035년
제10장 시장 추정 및 예측 : 유통 채널별, 2022-2035년
제11장 시장 추정 및 예측 : 지역별, 2022-2035년
제12장 기업 개요
KSM 26.08.05The Global Automotive USB Power Delivery System Market was valued at USD 2 billion in 2025 and estimated to grow at a CAGR of 9.7% to reach USD 5.1 billion by 2035.
Growth is reinforced by the global shift toward battery electric vehicles (BEVs) and plug-in hybrid electric vehicles (PHEVs), which is creating sustained demand for high-output USB charging architectures within vehicle cabins. As EV penetration approaches the 20-25% range in major automotive markets, OEMs are increasingly adopting USB Power Delivery (PD) 3.1-compliant multi-port systems capable of supporting 60W-140W output per port, accelerating demand in higher wattage segments such as 60W-100W and above 100W categories. The alignment between EV platform expansion and advanced USB PD integration is a primary growth catalyst for the market. At the same time, consumer expectations for fast in-vehicle charging are converging with smartphone charging standards, where modern devices require 45W-65W for efficient fast charging during travel. This is prompting Tier-1 suppliers to embed USB PD controller ICs into infotainment architectures, enabling stable multi-device charging without thermal power limitations and improving overall cabin power distribution efficiency.
| Market Scope | |
|---|---|
| Start Year | 2025 |
| Forecast Year | 2026-2035 |
| Start Value | $2 Billion |
| Forecast Value | $5.1 Billion |
| CAGR | 9.7% |
The single USB Type-C port segment generated USD 255.5 million in 2025. Its growth reflects early adoption in premium vehicle platforms and electric vehicle architectures, where Type-C interfaces are increasingly used as primary charging points in front-row seating configurations. In many designs, wired high-power delivery is being complemented by wireless charging systems rather than replaced, reinforcing the relevance of Type-C deployment in modern cabin ecosystems.
The 60W-100W power output segment captured USD 266.9 million in 2025, reflecting a CAGR of 18.4% through 2035. This performance is driven by early OEM integration of mid-to-high power USB charging systems in premium vehicles, electric vehicles with extended in-cabin usage time, and enhanced rear-seat entertainment configurations designed for long-distance travel comfort and connectivity.
North America Automotive USB Power Delivery System Market reached USD 459 million in 2025 and is expected to grow at a CAGR of 10.5% through 2026-2035, reaching USD 1.24 billion by 2035. Market growth in the region is supported by rapid EV adoption, higher USB port density per vehicle, and increasing deployment of electrified fleet vehicles across ride-hailing, logistics, and commercial transport applications. These structural factors continue to reinforce demand for advanced in-vehicle power delivery systems across both passenger and commercial vehicle categories.
Key companies operating in the global automotive USB power delivery system market include Aptiv, Molex, Hyundai Mobis, Harman International, Alps Alpine, Texas Instruments, Monolithic Power Systems, Diodes Incorporated, Panasonic, Casco, LTSCT, MD ELEKTRONIK, Alfatronix, PRO CAR, Wieson Automotive, Keboda, MinebeaMitsumi, Zhejiang Teme Science and Technology, Hebei First Light, and Aerpro. Companies operating in the automotive USB power delivery system market are focusing on enhancing product performance through higher wattage output capabilities, improved thermal management, and compact integrated circuit designs. Many firms are investing in advanced USB Power Delivery controller technologies to support multi-port high-speed charging architectures in electric and connected vehicles. Strategic partnerships with automotive OEMs and Tier-1 suppliers are being used to ensure early integration into next-generation vehicle platforms. Companies are also prioritizing semiconductor innovation to improve power efficiency and reduce energy loss during high-load charging cycles.
Table of Contents
Chapter 1 Methodology
- 1.1 Research approach
- 1.2 Quality Commitments
- 1.2.1 GMI AI policy & data integrity commitment
- 1.3 Research Trail & Confidence Scoring
- 1.3.1 Research Trail Components
- 1.3.2 Scoring Components
- 1.4 Data Collection
- 1.5 Data mining sources
- 1.5.1 Paid sources
- 1.6 Base estimates and calculations
- 1.6.1 Base year calculation
- 1.7 Forecast model
- 1.7.1 Quantified market impact analysis
- 1.8 Research transparency addendum
- 1.8.1 Source attribution framework
- 1.8.2 Quality assurance metrics
- 1.8.3 Our commitment to trust
Chapter 2 Executive Summary
- 2.1 Industry 360° synopsis
- 2.2 Key market trends
- 2.2.1 Regional
- 2.2.2 Connector
- 2.2.3 Power Output
- 2.2.4 Application
- 2.2.5 Vehicle
- 2.2.6 Vehicle Propulsion
- 2.2.7 Distribution Channel
- 2.3 TAM analysis, 2026-2035
- 2.4 CXO perspectives: Strategic imperatives
Chapter 3 Industry Insights
- 3.1 Industry ecosystem analysis
- 3.1.1 Supplier landscape
- 3.1.2 Profit margin
- 3.1.3 Cost structure
- 3.1.4 Value addition at each stage
- 3.1.5 Factor affecting the value chain
- 3.1.6 Disruptions
- 3.2 Industry impact forces
- 3.2.1 Growth drivers
- 3.2.1.1 Rising EV Adoption Driving Demand for High-Wattage USB PD Systems
- 3.2.1.2 Increasing Consumer Demand for In-Vehicle Device Connectivity & Fast Charging
- 3.2.1.3 Regulatory Mandates for USB-C Standardization (EU Common Charger Directive)
- 3.2.1.4 Growing Integration of Infotainment & ADAS Systems Requiring High-Bandwidth USB Interfaces
- 3.2.2 Industry pitfalls and challenges
- 3.2.2.1 High Cost of USB PD Controller ICs & Thermal Management Components
- 3.2.2.2 Compatibility Fragmentation Across Legacy USB Standards in Existing Vehicle Fleets
- 3.2.3 Market opportunities
- 3.2.3.1 Vehicle-to-Load (V2L) Capability Expansion Creating Demand for 100W+ USB PD Ports
- 3.2.3.2 Aftermarket Retrofit Demand in Aging Vehicle Fleets Across Emerging Markets
- 3.2.3.3 USB4 & USB PD 3.1 Adoption Creating Premium Upgrade Cycles
- 3.2.1 Growth drivers
- 3.3 Technology and innovation landscape
- 3.3.1 Current technological trends
- 3.3.1.1 USB Power Delivery 3.0
- 3.3.1.2 Programmable Power Supply (PPS) Technology
- 3.3.1.3 12V/24V DC-DC Step-Down Converters
- 3.3.2 Emerging technologies
- 3.3.2.1 USB Power Delivery 3.1
- 3.3.2.2 Bidirectional USB Power Delivery
- 3.3.1 Current technological trends
- 3.4 Growth potential analysis
- 3.5 Pricing Analysis (Driven by Primary Research)
- 3.5.1 Historical Price Trend Analysis
- 3.5.2 Pricing Strategy by Player Type (Premium / Value / Cost-plus)
- 3.6 Regulatory landscape
- 3.6.1 North America
- 3.6.1.1 US - NHTSA (National Highway Traffic Safety Administration)
- 3.6.1.2 Canada - ISED (Innovation, Science and Economic Development)
- 3.6.2 Europe
- 3.6.2.1 EU - European Commission (EC)
- 3.6.2.2 Germany - KBA (Kraftfahrt-Bundesamt)
- 3.6.3 Asia Pacific
- 3.6.3.1 China - MIIT (Ministry of Industry and Information Technology)
- 3.6.3.2 India - BIS (Bureau of Indian Standards / Department of Transport)
- 3.6.4 LATAM
- 3.6.4.1 Brazil - INMETRO
- 3.6.4.2 Brazil - ANATEL
- 3.6.5 MEA
- 3.6.5.1 South Africa - South African Bureau of Standards
- 3.6.5.2 Saudi Arabia - SASO (Saudi Standards, Metrology and Quality Organization)
- 3.6.1 North America
- 3.7 Porter's analysis
- 3.8 PESTEL analysis
- 3.9 Trade Data Analysis (Driven by Paid Database)
- 3.9.1 Import/Export Volume & Value Trends
- 3.9.2 Key Trade Corridors & Tariff Impact
- 3.10 Capacity & Production Landscape (Driven by Primary Research)
- 3.10.1 Installed Capacity by Region & Key Producer
- 3.10.2 Capacity Utilization Rates & Expansion Pipelines
- 3.11 Cost breakdown analysis
- 3.12 Patent analysis (Driven by Primary Research)
- 3.13 Connector & Interface Evolution Analysis
- 3.13.1 USB 2.0 to USB4 Migration Roadmap in Automotive Platforms
- 3.13.2 USB PD 3.0 to 3.1 (EPR) Transition
- 3.14 Reliability & Failure Mode Analysis
- 3.15 Impact of AI & generative AI on the market
- 3.15.1 AI-driven disruption of existing business models
- 3.15.2 GenAI use cases & adoption roadmap by segment
- 3.15.3 Risks, limitations & regulatory considerations
- 3.16 Forecast assumptions & scenario analysis (Driven by Primary Research)
- 3.16.1 Base Case- Key Macro & Industry Variables Driving CAGR
- 3.16.2 Optimistic Scenarios- Favorable macro and industry tailwinds
- 3.16.3 Pessimistic Scenario - Macroeconomic slowdown or industry headwinds
Chapter 4 Competitive Landscape, 2025
- 4.1 Introduction
- 4.2 Company market share analysis
- 4.2.1 North America
- 4.2.2 Europe
- 4.2.3 Asia Pacific
- 4.2.4 LATAM
- 4.2.5 MEA
- 4.3 Competitive analysis of major market players
- 4.4 Competitive positioning matrix
- 4.5 Key developments
- 4.5.1 Mergers & acquisitions
- 4.5.2 Partnerships & collaborations
- 4.5.3 New product launches
- 4.5.4 Expansion plans and funding
- 4.6 Company tier benchmarking
- 4.6.1 Tier classification criteria & qualifying thresholds
- 4.6.2 Tier positioning matrix by revenue, geography & innovation
Chapter 5 Market Estimates and Forecast, By Connector, 2022 - 2035 ($ Mn, Thousand Units)
- 5.1 Key trends
- 5.2 Single USB Type-A Port
- 5.3 Single USB Type-C Port
- 5.4 Combination (Type-A + Type-C Multi-Port)
- 5.5 Others
Chapter 6 Market Estimates and Forecast, By Power Output, 2022 - 2035 ($ Mn, Thousand Units)
- 6.1 Key trends
- 6.2 Up to 18W
- 6.3 18W-60W
- 6.4 60W-100W
- 6.5 Above 100W
Chapter 7 Market Estimates and Forecast, By Application, 2022 - 2035 ($ Mn, Thousand Units)
- 7.1 Key trends
- 7.2 Head Units / Infotainment Integration
- 7.3 Rear-Seat Entertainment Systems
- 7.4 Rear-Seat Chargers / Car Charger Ports
- 7.5 Others
Chapter 8 Market Estimates and Forecast, By Vehicle, 2022 - 2035 ($ Mn, Thousand Units)
- 8.1 Key trends
- 8.2 Passenger cars
- 8.2.1 Sedan
- 8.2.2 SUV & Crossover
- 8.2.3 Hatchback
- 8.2.4 Others
- 8.3 Commercial vehicles
- 8.3.1 LCV
- 8.3.2 MCV
- 8.3.3 HCV
- 8.4 Two-Wheelers
Chapter 9 Market Estimates and Forecast, By Vehicle Propulsion, 2022 - 2035 ($ Mn, Thousand Units)
- 9.1 Key trends
- 9.2 ICE
- 9.3 Electric
- 9.4 Hybrid
Chapter 10 Market Estimates and Forecast, By Distribution Channel, 2022 - 2035 ($ Mn, Thousand Units)
- 10.1 Key trends
- 10.2 OEM/Factory Installed
- 10.3 Aftermarket
- 10.3.1 Online Aftermarket
- 10.3.2 Offline Aftermarket
Chapter 11 Market Estimates & Forecast, By Region, 2022 - 2035 ($ Mn, Thousand Units)
- 11.1 Key trends
- 11.2 North America
- 11.2.1 US
- 11.2.2 Canada
- 11.3 Europe
- 11.3.1 Germany
- 11.3.2 UK
- 11.3.3 France
- 11.3.4 Italy
- 11.3.5 Spain
- 11.3.6 Netherlands
- 11.3.7 Switzerland
- 11.3.8 Poland
- 11.4 Asia Pacific
- 11.4.1 China
- 11.4.2 India
- 11.4.3 Japan
- 11.4.4 South Korea
- 11.4.5 Thailand
- 11.4.6 Vietnam
- 11.4.7 Indonesia
- 11.4.8 Malaysia
- 11.5 Latin America
- 11.5.1 Brazil
- 11.5.2 Mexico
- 11.5.3 Argentina
- 11.5.4 Chile
- 11.6 MEA
- 11.6.1 South Africa
- 11.6.2 Saudi Arabia
- 11.6.3 UAE
Chapter 12 Company Profiles
- 12.1 Global players
- 12.1.1 Molex
- 12.1.2 Aptiv
- 12.1.3 Harman International
- 12.1.4 Monolithic Power Systems
- 12.1.5 Alps Alpine
- 12.1.6 Hyundai Mobis
- 12.1.7 Diodes Incorporated
- 12.1.8 Panasonic
- 12.1.9 Casco
- 12.1.10 Texas Instruments
- 12.1.11 LTSCT
- 12.2 Regional players
- 12.2.1 Alfatronix
- 12.2.2 PRO CAR
- 12.2.3 MD ELEKTRONIK
- 12.2.4 Wieson Automotive
- 12.2.5 Keboda
- 12.2.6 MinebeaMitsumi
- 12.3 Emerging players
- 12.3.1 Zhejiang Teme Science and Technology
- 12.3.2 Hebei First Light
- 12.3.3 Aerpro


