

|
시장보고서
상품코드
2101877
크레인 시장 기회, 성장 촉진요인, 업계 동향 분석 및 예측(2026-2035년)Crane Market Opportunity, Growth Drivers, Industry Trend Analysis, and Forecast 2026 - 2035 |
||||||

세계의 크레인 시장은 2025년에 257억 달러 규모에 달하고, CAGR 5.4%로 성장하여 2035년까지 434억 달러에 달할 것으로 추정됩니다.
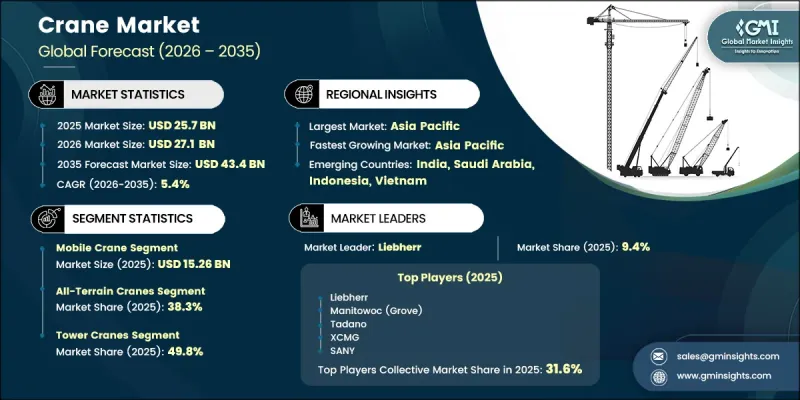
시장의 확대는 세계 각국의 경제권에서 지속되는 인프라 개발, 산업 건설 활동의 활성화, 그리고 에너지·물류 프로젝트에 대한 투자 증가에 힘입고 있습니다. 수요는 기존의 건설 수요에 더해, 재생에너지 시설, 제조 시설, 대규모 인프라 개발에서 중량물 운반 장비에 대한 수요가 증가함에 따라 형성되고 있습니다. 또한 시장에서는 크레인 차량의 현대화를 위한 단계적 전환이 진행되고 있으며, 사업자들은 효율 향상과 엄격해지는 배기가스 규제에 대응하기 위해 구형 디젤 구동 시스템을 하이브리드나 전기 구동 대체 기종으로 교체하고 있습니다. 수요의 견조한 지속성은 건설, 석유·가스, 조선, 물류, 산업 제조 등 다양한 최종 이용 산업에 의해 더욱 뒷받침되고 있습니다. 이러한 폭넓은 용도 기반은 경기 순환을 통해 수요를 안정시키는 데 일조하고 있으며, 특정 부문의 둔화가 다른 부문의 성장에 의해 상쇄되는 경우가 많아지고 있습니다. 전 세계 도시화가 가속화되고 인프라 네트워크가 확대되는 가운데, 크레인은 복잡한 건설 환경에서의 자재 취급 및 프로젝트 수행에 있어 여전히 필수적인 존재로 남아 있습니다.
| 시장 범위 | |
|---|---|
| 시작 연도 | 2025년 |
| 예측 기간 | 2026-2035년 |
| 시작 시점 시장 규모 | 257억 달러 |
| 예측액 | 434억 달러 |
| CAGR | 5.4% |
2025년에는 이동식 크레인 부문이 시장 점유율의 59.5%를 차지하며 152억 6,000만 달러의 매출을 기록했습니다. 또한 2035년까지 연평균 성장률(CAGR) 5.2%로 성장할 것으로 예측됩니다. 이 부문은 유연성, 도입 용이성, 그리고 광범위한 건설 및 산업 용도에 대한 적응성 덕분에 계속해서 주도적인 위치를 유지하고 있습니다. 이동식 크레인은 설치 시간이 최소화되고 여러 현장에서 효율적으로 사용할 수 있어, 도급업체 및 렌탈 서비스 사업자들로부터 폭넓은 지지를 받고 있으며, 급변하는 프로젝트 환경에서 실용적인 솔루션으로 자리 잡고 있습니다.
전지형 크레인 부문은 2025년에 38.3%의 시장 점유율을 차지하고, 시장 규모는 58억 4,000만 달러에 달하며, 2035년까지 연평균 성장률(CAGR) 5.2%로 성장할 것으로 예측됩니다. 이 부문은 일반 도로에서의 기동성과 높은 적재 능력을 겸비하고 있다는 장점이 있어, 인프라, 산업, 에너지 관련 프로젝트에서 폭넓게 활용되고 있습니다. 도시와 외딴 지역 모두의 건설 현장에서 운용 가능한 유연한 적재 솔루션에 대한 수요가 증가함에 따라, 다양한 건설 환경에서의 도입이 지속적으로 촉진되고 있습니다.
아시아태평양의 크레인 시장은 2025년에 40.4%의 점유율을 차지하며 103억 6,000만 달러의 시장 규모를 기록했으며, 2035년까지 연평균 성장률(CAGR) 6.5%로 성장하여 194억 6,000만 달러에 달할 것으로 전망됩니다. 이 지역의 성장은 대규모 인프라 개발, 급속한 도시 확장, 그리고 활발한 산업 투자 활동에 의해 주도되고 있습니다. 중국은 국내의 막대한 제조 능력과 첨단 리프팅 장비에 대한 수요를 뒷받침하는 지속적인 인프라 개발 프로그램에 힘입어 여전히 주요 국내 시장으로서의 위상을 유지하고 있습니다.
자주 묻는 질문
목차
제1장 조사 방법과 범위
제2장 주요 요약
제3장 업계 인사이트
제4장 경쟁 구도
제5장 시장 추정 및 예측 : 유형별, 2022-2035년
제6장 시장 추정 및 예측 : 이동식 크레인별, 2022-2035년
제7장 시장 추정 및 예측 : 고정식 크레인별, 2022-2035년
제8장 시장 추정 및 예측 : 지역별, 2022-2035년
제9장 기업 개요
KSM 26.08.05The Global Crane Market was valued at USD 25.7 billion in 2025 and is estimated to grow at a CAGR of 5.4% to reach USD 43.4 billion by 2035.
Market expansion is supported by sustained infrastructure development, rising industrial construction activity, and increasing investments in energy and logistics projects across global economies. Demand is being shaped by a combination of traditional construction requirements and the growing need for heavy lifting equipment in renewable energy installations, manufacturing facilities, and large-scale infrastructure development. The market is also witnessing a gradual shift toward modernized crane fleets, with operators replacing older diesel-powered systems with hybrid and electric alternatives to improve efficiency and meet tightening emission standards. Strong demand continuity is further supported by diversified end-use industries, which include construction, oil and gas, shipbuilding, logistics, and industrial manufacturing. This broad application base helps stabilize demand across economic cycles, ensuring that slowdowns in one sector are often balanced by growth in another. As global urbanization accelerates and infrastructure networks expand, cranes remain essential for material handling and project execution across complex construction environments.
| Market Scope | |
|---|---|
| Start Year | 2025 |
| Forecast Year | 2026-2035 |
| Start Value | $25.7 Billion |
| Forecast Value | $43.4 Billion |
| CAGR | 5.4% |
The mobile crane segment accounted for 59.5% share in 2025, generating USD 15.26 billion, and is projected to grow at a CAGR of 5.2% through 2035. This segment maintains its leading position due to its flexibility, ease of deployment, and suitability across a wide range of construction and industrial applications. Mobile cranes are widely preferred by contractors and rental service providers because they require minimal setup time and can be efficiently used across multiple job sites, making them a practical solution for dynamic project environments.
The all-terrain crane segment held 38.3% share in 2025, valued at USD 5.84 billion, and is forecast to grow at a CAGR of 5.2% through 2035. This segment benefits from its ability to combine on-road mobility with high lifting capacity, enabling use across infrastructure, industrial, and energy projects. Increasing demand for flexible lifting solutions capable of operating in both urban and remote project sites continues to support adoption across multiple construction environments.
Asia Pacific Crane Market accounted for 40.4% share in 2025, generating USD 10.36 billion, and is expected to grow at a CAGR of 6.5%, reaching USD 19.46 billion by 2035. Regional growth is driven by large-scale infrastructure development, rapid urban expansion, and strong industrial investment activity. China remains the dominant national market, supported by large domestic manufacturing capacity and continued infrastructure development programs that reinforce demand for advanced lifting equipment.
Major companies operating in the global crane market include Liebherr Group, XCMG Group, SANY Group Co., Ltd., Tadano Ltd., Zoomlion Heavy Industry Science and Technology Co., Ltd., Palfinger AG, and The Manitowoc Company (Grove). Companies operating in the crane market are focusing on technological innovation, electrification, and hybrid power systems to meet evolving environmental regulations and improve operational efficiency. Manufacturers are investing heavily in R&D to develop high-capacity cranes with advanced automation, telematics, and remote monitoring capabilities. Strategic partnerships with construction firms, energy developers, and rental service providers are helping expand market reach and ensure steady equipment utilization. Companies are also increasing production capacity and expanding regional manufacturing bases to improve supply chain efficiency and reduce lead times. Product portfolio diversification, including the development of all-terrain and specialized cranes for renewable energy projects, is strengthening competitiveness.
Table of Contents
Chapter 1 Methodology & Scope
- 1.1 Research approach
- 1.2 Quality Commitments
- 1.2.1 GMI AI policy & data integrity commitment
- 1.2.1.1 Source consistency protocol
- 1.2.1 GMI AI policy & data integrity commitment
- 1.3 Research Trail & Confidence Scoring
- 1.3.1 Research Trail Components
- 1.3.2 Scoring Components
- 1.4 Data Collection
- 1.4.1 Partial list of primary sources
- 1.5 Data mining sources
- 1.5.1 Paid sources
- 1.5.1.1 Sources, by region
- 1.5.1 Paid sources
- 1.6 Base estimates and calculations
- 1.6.1 Base year calculation
- 1.7 Forecast model
- 1.7.1 Quantified market impact analysis
- 1.7.1.1 Mathematical impact of growth parameters on forecast
- 1.7.1 Quantified market impact analysis
- 1.8 Research transparency addendum
- 1.8.1 Source attribution framework
- 1.8.2 Quality assurance metrics
- 1.8.3 Our commitment to trust
Chapter 2 Executive Summary
- 2.1 Industry 360° synopsis
- 2.2 Key market trends
- 2.2.1 Type
- 2.2.2 Mobile Crane
- 2.2.3 Fixed Crane
- 2.3 TAM Analysis, 2026-2035
- 2.4 CXO perspectives: Strategic imperatives
Chapter 3 Industry Insights
- 3.1 Industry ecosystem analysis
- 3.1.1 Supplier landscape
- 3.1.2 Cost structure
- 3.1.3 Profit margin
- 3.1.4 Value addition at each stage
- 3.1.5 Vertical integration trends
- 3.1.6 Disruptors
- 3.2 Industry impact forces
- 3.2.1 Growth drivers
- 3.2.1.1 Rising Infrastructure Investments
- 3.2.1.2 Renewable Energy Expansion
- 3.2.1.3 Industrial & Logistics Growth
- 3.2.2 Industry pitfalls & challenges
- 3.2.2.1 High Ownership Costs
- 3.2.2.2 Supply Chain & Raw Material Volatility
- 3.2.2.3 Regulatory & Workforce Constraints
- 3.2.3 Market opportunities
- 3.2.3.1 Infrastructure Modernization Programs
- 3.2.3.2 Renewable Energy & Offshore Wind Projects
- 3.2.3.3 Electrification & Smart Crane Technologies
- 3.2.1 Growth drivers
- 3.3 Growth potential analysis
- 3.4 Technology and Innovation landscape
- 3.4.1 Current technologies
- 3.4.2 Emerging technologies
- 3.5 Pricing Analysis (Driven by Primary Research)
- 3.5.1 Historical Price Trend Analysis
- 3.5.2 Pricing Strategy by Player Type (Premium / Value / Cost-plus)
- 3.6 Regulatory landscape
- 3.6.1 North America
- 3.6.1.1 OSHA Crane & Derrick Standards
- 3.6.1.2 ASME B30.5 - Mobile & Locomotive Cranes
- 3.6.1.3 NCCCO Crane Operator Certification
- 3.6.1.4 CSA Z150 - Safety Code on Mobile Cranes
- 3.6.2 Europe
- 3.6.2.1 EU Machinery Regulation
- 3.6.2.2 EU Stage V Emission Standards
- 3.6.2.3 EN 13000 - Crane Safety Standard
- 3.6.2.4 LOLER - Lifting Equipment Regulations
- 3.6.3 Asia-Pacific
- 3.6.3.1 GB/T 14560 - Mobile Crane Safety Standard (China)
- 3.6.3.2 CCMA Crane Type Certification (China)
- 3.6.3.3 JCMA Safety Standards (Japan)
- 3.6.3.4 DGFASLI Crane Safety Regulations (India)
- 3.6.3.5 AS 2550.5 - Cranes Safety in Use (Australia)
- 3.6.4 Latin America
- 3.6.4.1 NR-11 & NR-12 Machinery Safety Regulations (Brazil)
- 3.6.4.2 NOM-009-STPS Lifting Equipment Regulations (Mexico)
- 3.6.5 Middle East & Africa
- 3.6.5.1 OSHAD Lifting Operations Code (UAE)
- 3.6.5.2 Saudi Aramco Lifting Equipment Standards
- 3.6.5.3 South Africa Lifting Machinery Regulations (SANS)
- 3.6.1 North America
- 3.7 Porter's analysis
- 3.8 PESTEL analysis
- 3.9 Patent analysis (Driven by Primary Research)
- 3.10 Trade Data Analysis (Driven by paid database)
- 3.10.1 Import/export volume & value trends
- 3.10.2 Key trade corridors & tariff impact
- 3.11 Cost breakdown analysis
- 3.12 Impact of AI & generative AI on the market
- 3.12.1 AI Driven Disruption of Existing Business Models
- 3.12.2 GenAI Use Cases and Adoption Roadmap by Segment
- 3.12.3 Risks Limitations and Regulatory Considerations
- 3.13 Capacity & Production Landscape (Driven by Primary Research)
- 3.13.1 Installed Capacity by Region & Key Producer
- 3.13.2 Capacity Utilization Rates & Expansion Pipelines
- 3.14 Forecast assumptions & scenario analysis (Driven by Primary Research)
- 3.14.1 Base Case key macro & industry variables driving CAGR
- 3.14.2 Optimistic Scenarios Favorable Macro and Industry Tailwinds
- 3.14.3 Pessimistic Scenario Macroeconomic slowdown or industry headwinds
Chapter 4 Competitive Landscape, 2025
- 4.1 Introduction
- 4.2 Company market share analysis
- 4.2.1 North America
- 4.2.2 Europe
- 4.2.3 Asia-Pacific
- 4.2.4 Latin America
- 4.2.5 Middle East & Africa
- 4.3 Competitive positioning matrix
- 4.4 Key developments
- 4.4.1 Mergers & acquisitions
- 4.4.2 Partnerships & collaborations
- 4.4.3 New product launches
- 4.4.4 Expansion plans and funding
- 4.5 Company tier benchmarking
- 4.5.1 Tier classification criteria & qualifying thresholds
- 4.5.2 Tier positioning matrix by revenue, geography & innovation
Chapter 5 Market Estimates & Forecast, By Type, 2022 - 2035 ($Mn, Units)
- 5.1 Key trends
- 5.2 Mobile Crane
- 5.3 Fixed Crane
Chapter 6 Market Estimates & Forecast, By Mobile Crane, 2022 - 2035 ($Mn, Units)
- 6.1 Key trends
- 6.2 Type
- 6.2.1 All-terrain crane
- 6.2.1.1 Below 200 Tons
- 6.2.1.2 200 to 500 Tons
- 6.2.1.3 Above 500 Tons
- 6.2.2 Crawler crane
- 6.2.2.1 Below 50 Tons
- 6.2.2.2 50 to 250 Tons
- 6.2.2.3 250 to 450 Tons
- 6.2.2.4 Above 450 Tons
- 6.2.3 Rough terrain crane
- 6.2.3.1 Below 50 Tons
- 6.2.3.2 50 to 165 Tons
- 6.2.3.3 Above 165 Tons
- 6.2.4 Truck loader crane
- 6.2.4.1 Below 6 Tons
- 6.2.4.2 7 to 20 Tons
- 6.2.4.3 21 to 80 Tons
- 6.2.4.4 Above 80 Tons
- 6.2.5 Pick-and-carry crane
- 6.2.5.1 Below to 10 Tons
- 6.2.5.2 10-25 Tons
- 6.2.5.3 Above 25 Tons
- 6.2.1 All-terrain crane
- 6.3 Propulsion
- 6.3.1 ICE (Internal Combustion Engine)
- 6.3.2 Hybrid / Electric
- 6.4 Application
- 6.4.1 Construction & Mining
- 6.4.2 Utility
- 6.4.3 Manufacturing
- 6.4.4 Transport/Shipping
- 6.4.5 Oil & Gas/Energy
- 6.4.6 Others
- 6.5 End-User
- 6.5.1 Infrastructure Contractors
- 6.5.2 Industrial & Manufacturing Facilities
- 6.5.3 Energy & Utilities Companies
- 6.5.4 Crane Rental & Service Companies
- 6.5.5 Others
Chapter 7 Market Estimates & Forecast, By Fixed Crane, 2022 - 2035 ($Mn, Units)
- 7.1 Key trends
- 7.2 Type
- 7.2.1 Tower Crane
- 7.2.1.1 Below 5 Tons
- 7.2.1.2 6 to 20 Tons
- 7.2.1.3 21 to 50 Tons
- 7.2.1.4 51 to 80 Tons
- 7.2.1.5 Above 80 Tons
- 7.2.2 Gantry Crane
- 7.2.2.1 Below 25 Tons
- 7.2.2.2 26 Tons to 50 Tons
- 7.2.2.3 51 Tons to 80 Tons
- 7.2.2.4 Above 80 Tons
- 7.2.3 Stiffleg Crane
- 7.2.3.1 Up to 25 Tons
- 7.2.3.2 26 Tons to 50 Tons
- 7.2.3.3 51 Tons to 80 Tons
- 7.2.3.4 Above 80 Tons
- 7.2.4 Monorail Crane
- 7.2.4.1 Up to 25 Tons
- 7.2.4.2 26 Tons to 50 Tons
- 7.2.4.3 51 Tons to 80 Tons
- 7.2.4.4 Above 80 Tons
- 7.2.1 Tower Crane
- 7.3 Application
- 7.3.1 Building & Construction
- 7.3.2 Port, Logistics & Shipbuilding
- 7.3.3 Industrial Manufacturing & Warehousing
- 7.3.4 Energy & Mining
- 7.3.5 Others
- 7.4 End User
- 7.4.1 Construction Companies & Real Estate Developers
- 7.4.2 Transportation, Logistics & Port Operators
- 7.4.3 Industrial Manufacturing Enterprises
- 7.4.4 Government, Municipal & Energy Utilities
- 7.4.5 Crane Rental Companies
- 7.4.6 Others
Chapter 8 Market Estimates & Forecast, By Region, 2022 - 2035 ($Mn, Units)
- 8.1 North America
- 8.1.1 US
- 8.1.2 Canada
- 8.2 Europe
- 8.2.1 UK
- 8.2.2 Germany
- 8.2.3 France
- 8.2.4 Italy
- 8.2.5 Spain
- 8.2.6 Belgium
- 8.2.7 Netherlands
- 8.2.8 Sweden
- 8.2.9 Russia
- 8.3 Asia Pacific
- 8.3.1 China
- 8.3.2 India
- 8.3.3 Japan
- 8.3.4 Australia
- 8.3.5 Singapore
- 8.3.6 South Korea
- 8.3.7 Vietnam
- 8.3.8 Indonesia
- 8.3.9 Thailand
- 8.4 Latin America
- 8.4.1 Brazil
- 8.4.2 Mexico
- 8.4.3 Argentina
- 8.5 MEA
- 8.5.1 South Africa
- 8.5.2 Saudi Arabia
- 8.5.3 UAE
- 8.5.4 Turkey
Chapter 9 Company Profiles
- 9.1 Global Players
- 9.1.1 Cargotec (Hiab)
- 9.1.2 Konecranes
- 9.1.3 Liebherr
- 9.1.4 Manitowoc (Grove)
- 9.1.5 Palfinger
- 9.1.6 SANY
- 9.1.7 Tadano
- 9.1.8 Terex
- 9.1.9 XCMG
- 9.1.10 Zoomlion
- 9.2 Regional Players
- 9.2.1 ABUS Kransysteme
- 9.2.2 GH Cranes & Components
- 9.2.3 Kobelco Construction Machinery
- 9.2.4 Nucleon Crane
- 9.2.5 Sennebogen
- 9.2.6 Weihua Group
- 9.3 Emerging Players / Disruptors
- 9.3.1 Action Construction Equipment (ACE)
- 9.3.2 Bocker Maschinenwerke
- 9.3.3 Furukawa UNIC
- 9.3.4 Maeda Seisakusho


