

|
시장보고서
상품코드
2101961
대기오염 방지 장비 시장 기회, 성장 촉진요인, 업계 동향 분석 및 예측(2026-2035년)Air Pollution Control Equipment Market Opportunity, Growth Drivers, Industry Trend Analysis, and Forecast 2026 - 2035 |
||||||

세계의 대기오염 방지 장비 시장은 2025년에 911억 달러 규모에 달하고, CAGR 5.4%로 성장하여 2035년까지 1,546억 달러에 달할 것으로 추정됩니다.
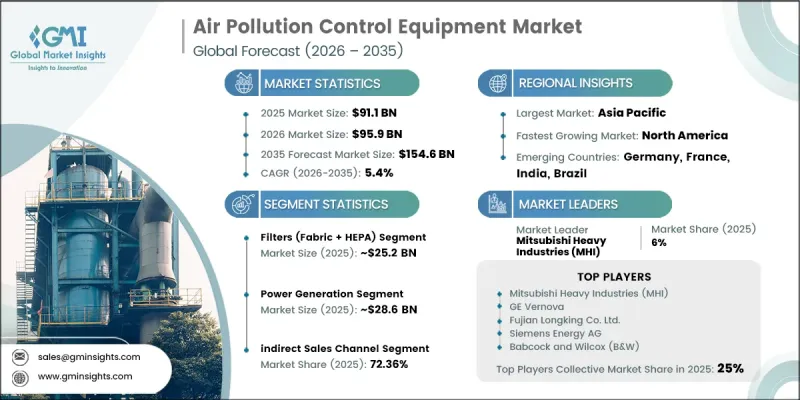
시장 확대는 발전, 시멘트, 화학, 야금 등 산업 분야의 지속적인 투자에 힘입어 이루어지고 있습니다. 이는 기업들이 점점 더 엄격해지는 환경 규제를 준수하기 위해 배출 제어 인프라를 지속적으로 업그레이드하고 있기 때문입니다. 산업 배출량 감축, 대기질 개선, 규제 준수 요건에 대한 대응이 점점 더 중요해짐에 따라 첨단 오염 방지 기술의 광범위한 도입이 촉진되고 있습니다. 많은 국가 정부가 산업 시설에 대한 배출 기준을 지속적으로 강화하고 있어, 이에 따라 최신 여과 및 배출 저감 시스템에 대한 안정적인 수요가 발생하고 있습니다. 동시에, 신흥 경제국에서의 급속한 산업화, 도시 확장 및 제조 활동의 증가는 장비 공급업체에게 새로운 기회를 창출하고 있습니다. 산업 사업자들은 미세먼지 배출 및 유해 오염 물질을 줄이면서 운영 효율을 높이는 첨단 시스템에 투자하고 있습니다. 노후화된 산업 시설의 지속적인 현대화와 더불어, 새로운 제조 플랜트 및 인프라 프로젝트에 대한 설비 투자의 증가가 장기적인 시장 성장을 더욱 뒷받침하고 있습니다. 기술 발전, 에너지 효율 향상, 디지털 모니터링 기능, 그리고 지속가능한 산업 운영에 대한 관심 증대가 선진국과 신흥 경제국 모두에서 대기오염 방지 장비 시장의 확장을 지속적으로 뒷받침하고 있습니다.
| 시장 범위 | |
|---|---|
| 시작 연도 | 2025년 |
| 예측 기간 | 2026-2035년 |
| 초기 시장 규모 | 911억 달러 |
| 예측액 | 1,546억 달러 |
| CAGR | 5.4% |
2025년, 필터 부문은 27.61%의 점유율을 차지했으며, 그 시장 규모는 252억 달러에 달했습니다. 이는 환경 규제 기준을 충족하기 위해 효과적인 미세먼지 제어가 필요한 산업 분야의 수요 증가에 힘입은 결과입니다. 여과 효율, 내구성 및 운영 성능의 지속적인 향상으로 인해, 규제 준수와 운영 생산성을 유지하기 위해 신뢰할 수 있는 배출 제어가 필수적인 산업 제조 시설에서 도입이 더욱 촉진되고 있습니다.
발전 부문은 2025년에 28.57%의 점유율을 차지하며 286억 달러에 달했으며, 2026년부터 2035년까지 연평균 성장률(CAGR) 4.8%로 성장할 것으로 전망됩니다. 시장의 성장은 발전 시설 전반에 걸친 배출 저감 기술에 대한 지속적인 투자에 힘입고 있습니다. 각 사업자는 진화하는 환경 기준을 준수하고 장기적인 운영의 지속가능성을 높이기 위해 기존 인프라를 지속적으로 업그레이드하는 한편, 신규 시설에는 첨단 오염 방지 시스템을 도입하고 있습니다.
북미 대기오염 방지 장비 시장은 2025년에 28.36%의 점유율을 차지하며 258억 달러의 시장 규모를 기록했으며, 2035년까지 연평균 성장률(CAGR) 4.5%로 성장할 것으로 전망됩니다. 이 지역의 시장은 확립된 환경 규제, 산업 시설의 지속적인 현대화, 그리고 배출 저감 기술에 대한 꾸준한 투자로 인해 계속해서 혜택을 받고 있습니다. 노후화된 공해 방지 인프라의 지속적인 갱신에 더해, 규제 준수 요건의 강화 및 산업 활동의 지속으로 인해 해당 지역 전체에서 첨단 대기 오염 방지 장치에 대한 장기적인 수요가 유지될 것으로 예상됩니다.
자주 묻는 질문
목차
제1장 조사 방법
제2장 주요 요약
제3장 업계 인사이트
제4장 경쟁 구도
제5장 시장 추정 및 예측 : 제품 유형별, 2022-2035년
제6장 시장 추정 및 예측 : 오염물질 종류별, 2022-2035년
제7장 시장 추정 및 예측 : 용도별, 2022-2035년
제8장 시장 추정 및 예측 : 설치 유형별, 2022-2035년
제9장 시장 추정 및 예측 : 유통 채널별, 2022-2035년
제10장 예측 : 지역별, 2022-2035년
제11장 기업 개요
KSM 26.08.05The Global Air Pollution Control Equipment Market was valued at USD 91.1 billion in 2025 and is estimated to grow at a CAGR of 5.4% to reach USD 154.6 billion by 2035.
Market expansion is driven by sustained investments across industries including power generation, cement, chemicals, and metallurgy as companies continue upgrading emission control infrastructure to comply with increasingly stringent environmental regulations. Growing emphasis on reducing industrial emissions, improving air quality, and meeting regulatory compliance requirements is encouraging widespread adoption of advanced pollution control technologies. Governments across numerous countries continue strengthening emission standards for industrial facilities, creating consistent demand for modern filtration and emission abatement systems. At the same time, rapid industrialization, urban expansion, and increasing manufacturing activities across emerging economies are generating new opportunities for equipment suppliers. Industrial operators are investing in advanced systems that improve operational efficiency while reducing particulate emissions and harmful pollutants. Continuous modernization of aging industrial facilities, together with rising capital expenditure on new manufacturing plants and infrastructure projects, is further supporting long-term market growth. Technological advancements, improved energy efficiency, digital monitoring capabilities, and increasing focus on sustainable industrial operations continue to reinforce the expansion of the air pollution control equipment market across both developed and emerging economies.
| Market Scope | |
|---|---|
| Start Year | 2025 |
| Forecast Year | 2026-2035 |
| Start Value | $91.1 Billion |
| Forecast Value | $154.6 Billion |
| CAGR | 5.4% |
The filters segment held 27.61% share in 2025, equivalent to USD 25.2 billion, supported by increasing demand from industries requiring effective particulate control to meet environmental compliance standards. Continuous improvements in filtration efficiency, durability, and operational performance are encouraging greater adoption across industrial manufacturing facilities where reliable emission control remains essential for maintaining regulatory compliance and operational productivity.
The power generation segment accounted for 28.57% share in 2025, representing USD 28.6 billion, and is expected to grow at a CAGR of 4.8% between 2026 and 2035. Market growth is supported by ongoing investments in emission reduction technologies across electricity generation facilities. Operators continue upgrading existing infrastructure while incorporating advanced pollution control systems into new facilities to comply with evolving environmental standards and improve long-term operational sustainability.
North America Air Pollution Control Equipment Market held 28.36% share in 2025, generating USD 25.8 billion, and is forecast to grow at a CAGR of 4.5% through 2035. The regional market continues to benefit from established environmental regulations, continuous modernization of industrial facilities, and steady investment in emission reduction technologies. Ongoing replacement of aging pollution control infrastructure, combined with increasing regulatory compliance requirements and continued industrial activity, is expected to sustain long-term demand for advanced air pollution control equipment throughout the region.
Key players in the global air pollution control equipment market Andritz AG, GEA Group AG, Siemens Energy AG, Donaldson Company, Inc., CECO Environmental Corporation, Mitsubishi Heavy Industries (MHI), Thermax Limited, Durr AG, GE Vernova, Babcock & Wilcox (B&W), John Zink Hamworthy Combustion, Hamon Group, KC Cottrell Co., Ltd., Fujian Longking Co., Ltd., Doosan Lentjes GmbH, Nederman Holding AB, Redecam Group S.p.A., Scheuch GmbH, Airnord, Anguil Environmental Systems. Companies operating in the air pollution control equipment market are strengthening their market position by investing in advanced filtration technologies, expanding product portfolios, and developing high-efficiency emission control systems that address evolving environmental standards. Manufacturers are focusing on research and development to improve energy efficiency, reduce operating costs, and enhance equipment reliability. Strategic partnerships, acquisitions, and collaborations with industrial customers are enabling companies to broaden their geographic presence and strengthen customer relationships. Businesses are also investing in digital monitoring solutions, predictive maintenance technologies, and integrated automation systems to improve equipment performance and lifecycle management.
Table of Contents
Chapter 1 Research Methodology
- 1.1 Research approach
- 1.2 Quality Commitments
- 1.2.1 GMI AI policy & data integrity commitment
- 1.2.1.1 Source consistency protocol
- 1.2.1 GMI AI policy & data integrity commitment
- 1.3 Research Trail & Confidence Scoring
- 1.3.1 Research Trail Components
- 1.3.2 Scoring Components
- 1.4 Data Collection
- 1.4.1 Partial list of primary sources
- 1.5 Data mining sources
- 1.5.1 Paid sources
- 1.5.1.1 Sources, by region
- 1.5.1 Paid sources
- 1.6 Base estimates and calculations
- 1.6.1 Base year calculation for any one approach
- 1.7 Forecast model
- 1.7.1 Quantified market impact analysis
- 1.7.1.1 Mathematical impact of growth parameters on forecast
- 1.7.1 Quantified market impact analysis
- 1.8 Research transparency addendum
- 1.8.1 Source attribution framework
- 1.8.2 Quality assurance metrics
- 1.8.3 Our commitment to trust
Chapter 2 Executive Summary
- 2.1 Industry 360° synopsis, 2022 - 2035
- 2.2 Key market trends
- 2.2.1 Regional
- 2.2.2 Product Type
- 2.2.3 Pollutant Type
- 2.2.4 Application
- 2.2.5 Installation Type
- 2.2.6 Distribution Channel
Chapter 3 Industry Insights
- 3.1 Industry ecosystem analysis
- 3.1.1 Factor affecting the value chain
- 3.1.2 Profit margin analysis
- 3.1.3 Disruptions
- 3.1.4 Future outlook
- 3.1.5 Manufacturers
- 3.1.6 Distributors
- 3.2 Supplier landscape
- 3.3 Key news & initiatives
- 3.4 Technology & Innovation Landscape
- 3.5 Regulatory landscape
- 3.6 Impact on forces
- 3.6.1 Growth drivers
- 3.6.2 Industry pitfalls & challenges
- 3.6.3 Opportunities
- 3.7 Porter's analysis
- 3.8 PESTEL analysis
- 3.9 Pricing analysis (driven by primary research)
- 3.9.1 Historical Price Trend Analysis, 2019-2024 (Driven by Primary Research)
- 3.9.2 Pricing Strategy by Player Type (Driven by Primary Research)
- 3.10 Trade data analysis (driven by paid database)
- 3.10.1 Import/Export Volume & Value Trends (Driven by Primary Research)
- 3.10.2 Key Trade Corridors & Tariff Impact (Driven by Primary Research)
- 3.11 Impact of AI & Generative AI on the Market
- 3.11.1 AI-Driven Disruption of Existing Business Models
- 3.11.2 GenAI Use Cases & Adoption Roadmap by Segment
- 3.11.3 Risks, Limitations & Regulatory Considerations
- 3.12 Capacity & Production Landscape (Driven by Primary Research)
- 3.12.1 Manufacturing Capacity Installed by Region & Key Producer (Driven by Primary Research)
- 3.12.2 Capacity Utilization Rates & Expansion Pipelines (Driven by Primary Research)
Chapter 4 Competitive Landscape, 2025
- 4.1 Introduction
- 4.2 Company market share analysis
- 4.3 Competitive positioning matrix
- 4.4 Strategic outlook matrix
- 4.5 Competitive analysis of major market players
- 4.6 Key developments
- 4.6.1 Mergers & acquisitions
- 4.6.2 Partnerships & collaborations
- 4.6.3 New product launches
- 4.6.4 Expansion plans
Chapter 5 Market Estimates and Forecast, By Product Type, 2022 - 2035 (USD Billion, Units)
- 5.1 Key trends
- 5.2 Electrostatic Precipitators (ESP)
- 5.2.1 Dry Electrostatic Precipitators
- 5.2.2 Wet Electrostatic Precipitators
- 5.3 Scrubbers
- 5.3.1 Wet Scrubbers
- 5.3.2 Dry Scrubbers
- 5.3.3 Bioscrubbers/Biofilters
- 5.4 Filters (Fabric + HEPA)
- 5.4.1 Pulse-Jet Baghouse
- 5.4.2 Reverse-Air Baghouse
- 5.4.3 Shaker Baghouse
- 5.5 Flue Gas Desulfurization (FGD) Systems
- 5.5.1 Wet FGD
- 5.5.2 Dry FGD
- 5.5.3 Semi-Dry FGD
- 5.6 Selective Catalytic Reduction (SCR) Systems
- 5.7 Oxidizers
- 5.7.1 Thermal Oxidizers
- 5.7.2 Catalytic Oxidizers
- 5.7.3 Regenerative Thermal Oxidizers (RTO)
- 5.8 Mist Collectors
- 5.9 Others (Activated Carbon Adsorption, Plasma Systems, UV Oxidation)
Chapter 6 Market Estimates and Forecast, By Pollutant Type, 2022 - 2035 (USD Billion, Units)
- 6.1 Key trends
- 6.2 Particulate Matter (PM) Control
- 6.2.1 Coarse Particulate (PM10) Control
- 6.2.2 Fine Particulate (PM2.5) Control
- 6.3 Gaseous Pollutant Control (SOx & NOx)
- 6.3.1 Sulfur Dioxide (SOx) Control
- 6.3.2 Nitrogen Oxide (NOx) Control
- 6.4 Volatile Organic Compounds (VOC) & Hazardous Air Pollutants (HAP) Control
- 6.5 Mercury & Heavy Metal Control
- 6.6 Others (Odor Control, CO Control, Multi-Pollutant Hybrid Systems)
Chapter 7 Market Estimates and Forecast, By Application, 2022 - 2035 (USD Billion, Units)
- 7.1 Key trends
- 7.2 Power Generation
- 7.3 Chemical & Petrochemical
- 7.4 Cement & Aggregates
- 7.5 Metallurgical (Steel & Non-Ferrous Metals)
- 7.6 Automotive & Metal Processing
- 7.7 Mining
- 7.8 Pharmaceuticals
- 7.9 Food & Beverage
- 7.10 Others (Waste Incineration, Pulp & Paper, Glass Manufacturing)
Chapter 8 Market Estimates and Forecast, By Installation Type, 2022 - 2035 (USD Billion, Units)
- 8.1 Key trends
- 8.2 Greenfield / New Installation
- 8.2.1 New Industrial Facility Installations
- 8.2.2 New Power Plant Installations
- 8.3 Retrofit & Upgrade
- 8.3.1 Regulatory Compliance-Driven Retrofits
- 8.3.2 Performance Upgrade & Capacity Expansion Retrofits
Chapter 9 Market Estimates and Forecast, By Distribution Channel, 2022 - 2035 (USD Billion, Units)
- 9.1 Key trends
- 9.2 Direct Sales
- 9.3 Indirect Sales
Chapter 10 Forecast, By Region, 2022 - 2035, (USD Billion, Thousand Units)
- 10.1 Key trends
- 10.2 North America
- 10.2.1 U.S.
- 10.2.2 Canada
- 10.3 Europe
- 10.3.1 Germany
- 10.3.2 U.K.
- 10.3.3 France
- 10.3.4 Italy
- 10.3.5 Spain
- 10.4 Asia Pacific
- 10.4.1 China
- 10.4.2 India
- 10.4.3 Japan
- 10.4.4 South Korea
- 10.4.5 Australia
- 10.5 Latin America
- 10.5.1 Brazil
- 10.5.2 Mexico
- 10.5.3 Argentina
- 10.6 MEA
- 10.6.1 UAE
- 10.6.2 Saudi Arabia
- 10.6.3 South Africa
Chapter 11 Company Profiles
- 11.1 Global players
- 11.1.1 Mitsubishi Heavy Industries (MHI)
- 11.1.2 GE Vernova (Steam Power Division)
- 11.1.3 Siemens Energy AG
- 11.1.4 Babcock & Wilcox (B&W)
- 11.1.5 CECO Environmental Corporation
- 11.1.6 Durr AG
- 11.1.7 GEA Group AG
- 11.1.8 Donaldson Company, Inc.
- 11.2 Regional players
- 11.2.1 Fujian Longking Co., Ltd.
- 11.2.2 Zhejiang Feida Environmental Science & Technology Co.
- 11.2.3 Thermax Limited
- 11.2.4 Andritz AG
- 11.2.5 Scheuch GmbH
- 11.2.6 Doosan Lentjes GmbH
- 11.2.7 KC Cottrell Co., Ltd.
- 11.2.8 Hamon Group
- 11.3 Emerging players
- 11.3.1 Redecam Group S.p.A.
- 11.3.2 Anguil Environmental Systems
- 11.3.3 John Zink Hamworthy Combustion
- 11.3.4 Airnord
- 11.3.5 Nederman Holding AB


