

|
시장보고서
상품코드
2101993
여객 페리 시장 기회, 성장요인, 업계 동향 분석 및 예측(2026-2035년)Passenger Ferries Market Opportunity, Growth Drivers, Industry Trend Analysis, and Forecast 2026 - 2035 |
||||||

세계의 여객 페리 시장은 2025년에 184억 달러 규모에 달하며, CAGR 7%로 성장하며, 2035년까지 364억 달러에 달할 것으로 추정되고 있습니다.
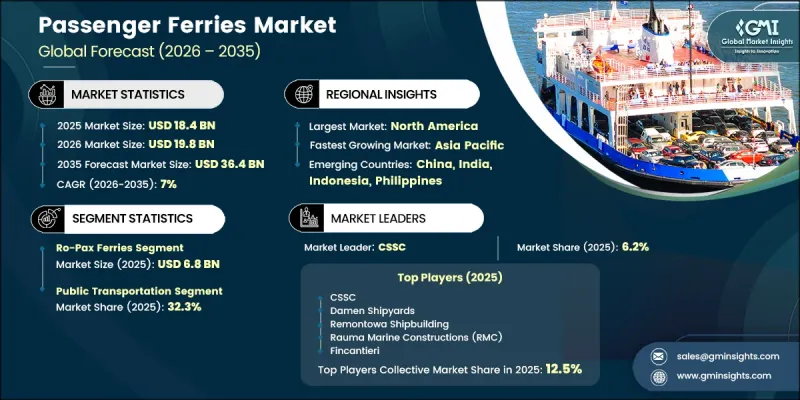
각국 정부와 민간 사업자들이 지역 간 연결성과 승객의 이동성을 향상시키기 위해 현대적인 해상 운송 시스템에 대한 투자를 확대함에 따라 여객 페리 시장은 지속적인 성장을 이어가고 있습니다. 시장 확대는 배출량 감축에 중점을 둔 선단 갱신 프로그램, 연안 및 도서 지역의 관광 활동 확대, 대중교통 인프라에 대한 투자 증가, 그리고 개발도상 지역에서의 해상 여객 서비스 상용화에 의해 지원되고 있습니다. 예측 기간 중반에는 새로 취항한 배터리식 전기 페리와 하이브리드식 전기 페리가 상업 운항을 시작하여 시장 수익을 더욱 끌어올림으로써 성장에 더욱 탄력을 받을 것으로 예상됩니다. 환경 규제 정비 및 장기적인 지속가능성 목표 수립에 따라 운항 사업자들은 노후화된 디젤 선박을 저배출·무배출 대체 선박으로 교체하도록 권장받고 있습니다. 동시에 국내외 여행 수요의 증가로 인해 연안 노선, 섬, 내륙 수로에서의 페리 운송 수요는 계속해서 강세를 보이고 있습니다. 이러한 요인들이 복합적으로 작용하여 장기적인 성장을 위한 유리한 여건이 조성되는 한편, 기술적으로 첨단이고 환경적으로 지속가능한 여객 페리 선단에 대한 지속적인 투자가 촉진되고 있습니다.
| 시장 범위 | |
|---|---|
| 시작연도 | 2025년 |
| 예측 기간 | 2026-2035년 |
| 초기 시장 규모 | 184억 달러 |
| 예측액 | 364억 달러 |
| CAGR | 7% |
Ro-Pax 부문은 2035년까지 연평균 성장률(CAGR) 6.8%로 성장할 것으로 예측됩니다. 이 부문의 시장내 주도적 지위는 주로 동일한 항해에서 여객 수송과 차량 수송 모두로부터 수익을 창출하는 능력에 의해 지원되고 있습니다. 이러한 ‘일석이조’ 운영 모델은 자산 활용도와 수익 창출을 향상시켜 많은 페리 운항 사업자에게 Ro-Pax 선박이 최적의 선택지가 되는 한편, 예측 기간 중 지속적인 수요를 지원하고 있습니다.
대중교통 부문은 해상 대중교통 네트워크의 지속적인 확대와 교통 인프라에 대한 장기적인 투자에 힘입어 2035년까지 연평균 성장률(CAGR) 6%로 성장할 것으로 예측됩니다. 정부 운영 페리 서비스 전반에 걸쳐 진행되고 있는 선단 현대화 및 수송 능력 확대 노력은 시장 수요를 더욱 강화하는 동시에 운영 효율과 여객 수송 능력 향상에도 기여하고 있습니다.
북미 여객 페리 시장은 2035년까지 연평균 성장률(CAGR) 6.2%로 성장하여 135억 달러에 달할 것으로 예상됩니다. 시장 성장은 통근 페리 네트워크, 섬 간 운송 서비스 및 지역 간 수로 연결의 확장에 힘입고 있습니다. 선단의 현대화, 전기화 프로그램, 그리고 차세대 페리 인프라에 대한 지속적인 공공 투자를 통해 첨단 여객선의 도입이 가속화되고 있으며, 이는 장기적인 지역 시장 확장을 지원하고 있습니다.
자주 묻는 질문
목차
제1장 조사 방법과 범위
제2장 개요
제3장 업계 인사이트
제4장 경쟁 구도
제5장 시장 추산·예측 : 페리 유형별, 2022-2035년
제6장 시장 추산·예측 : 추진 유형별, 2022-2035년
제7장 시장 추산·예측 : 여객 수용 능력별, 2022-2035년
제8장 시장 추산·예측 : 소유주·운영자별, 2022-2035년
제9장 시장 추산·예측 : 용도별, 2022-2035년
제10장 시장 추산·예측 : 지역별, 2022-2035년
제11장 기업 개요
KSA 26.08.06The Global Passenger Ferries Market was valued at USD 18.4 billion in 2025 and is estimated to grow at a CAGR of 7% to reach USD 36.4 billion by 2035.
The Passenger Ferries Market continues to witness growth as governments and private operators increase investments in modern marine transportation systems to improve regional connectivity and passenger mobility. Market expansion is being supported by fleet replacement programs focused on reducing emissions, growing tourism activities across coastal and island destinations, increased investment in public transportation infrastructure, and the commercialization of marine passenger services in developing regions. Growth is expected to gain additional momentum during the middle years of the forecast period as newly commissioned battery-electric and hybrid-electric ferries begin commercial operations, generating additional market revenue. Favorable environmental regulations and long-term sustainability targets are encouraging operators to replace aging diesel-powered vessels with low- and zero-emission alternatives. At the same time, rising domestic and international travel continues to strengthen demand for ferry transportation across coastal routes, islands, and inland waterways. These combined factors are creating favorable conditions for long-term growth while encouraging continuous investments in technologically advanced and environmentally sustainable passenger ferry fleets.
| Market Scope | |
|---|---|
| Start Year | 2025 |
| Forecast Year | 2026-2035 |
| Start Value | $18.4 Billion |
| Forecast Value | $36.4 Billion |
| CAGR | 7% |
The Ro-Pax segment is anticipated to grow at a CAGR of 6.8% through 2035. Its market leadership is primarily supported by the ability to generate revenue from both passenger transportation and vehicle carriage within the same voyage. This dual-purpose operating model improves asset utilization and revenue generation, making Ro-Pax vessels the preferred choice for many ferry operators while supporting sustained demand throughout the forecast period.
The public transportation segment is projected to grow at a CAGR of 6% through 2035, supported by the continued expansion of public marine transit networks and long-term investments in transportation infrastructure. Ongoing fleet modernization initiatives and capacity expansion programs across government-operated ferry services continue to strengthen market demand while improving operational efficiency and passenger transportation capabilities.
North America Passenger Ferries Market is expected to grow at a CAGR of 6.2% through 2035, reaching USD 13.5 billion. Market growth is supported by expanding commuter ferry networks, inter-island transportation services, and regional waterway connectivity. Continued public investment in fleet modernization, electrification programs, and next-generation ferry infrastructure is accelerating the adoption of advanced passenger vessels while supporting long-term regional market expansion.
Major companies operating in the Global Passenger Ferries Market include CSSC, Damen Shipyards, Remontowa Shipbuilding, Rauma Marine Constructions (RMC), Fincantieri, Hyundai Mipo Dockyard (HMD), and Brodrene Aa. Companies operating in the Passenger Ferries Market are strengthening their market position by investing in advanced vessel technologies, expanding production capabilities, and developing low-emission ferry solutions that align with evolving environmental regulations. Many manufacturers are focusing on battery-electric and hybrid-electric vessel development to support the industry's transition toward sustainable marine transportation. Strategic collaborations, long-term supply agreements, and investments in research and development are helping companies improve product innovation and broaden their global presence. Businesses are also enhancing vessel efficiency through digital technologies, automation, and advanced propulsion systems while expanding customized ferry offerings to meet diverse customer requirements.
Table of Contents
Chapter 1 Methodology & Scope
- 1.1 Research approach
- 1.2 Quality Commitments
- 1.2.1 GMI AI policy & data integrity commitment
- 1.2.1.1 Source consistency protocol
- 1.2.1 GMI AI policy & data integrity commitment
- 1.3 Research Trail & Confidence Scoring
- 1.3.1 Research Trail Components
- 1.3.2 Scoring Components
- 1.4 Data Collection
- 1.4.1 Partial list of primary sources
- 1.5 Data mining sources
- 1.5.1 Paid sources
- 1.5.1.1 Sources, by region
- 1.5.1 Paid sources
- 1.6 Base estimates and calculations
- 1.6.1 Base year calculation
- 1.7 Forecast model
- 1.7.1 Quantified market impact analysis
- 1.7.1.1 Mathematical impact of growth parameters on forecast
- 1.7.1 Quantified market impact analysis
- 1.8 Research transparency addendum
- 1.8.1 Source attribution framework
- 1.8.2 Quality assurance metrics
- 1.8.3 Our commitment to trust
Chapter 2 Executive Summary
- 2.1 Industry 360° synopsis
- 2.2 Key market trends
- 2.2.1 Ferry Type
- 2.2.2 Propulsion Type
- 2.2.3 Passenger Capacity
- 2.2.4 Ownership/Operator
- 2.2.5 Application
- 2.2.6 Region
- 2.3 TAM Analysis, 2026-2035
- 2.4 CXO perspectives: Strategic imperatives
Chapter 3 Industry Insights
- 3.1 Industry ecosystem analysis
- 3.1.1 Supplier landscape
- 3.1.2 Cost structure
- 3.1.3 Profit margin
- 3.1.4 Value addition at each stage
- 3.1.5 Vertical integration trends
- 3.1.6 Disruptors
- 3.2 Industry impact forces
- 3.2.1 Growth drivers
- 3.2.1.1 Increasing demand for sustainable maritime transportation
- 3.2.1.2 Growing tourism and coastal passenger traffic
- 3.2.1.3 Government investment in waterborne public transport
- 3.2.1.4 Improved inter-island and regional connectivity
- 3.2.2 Industry pitfalls & challenges
- 3.2.2.1 High capital and vessel construction costs
- 3.2.2.2 Limited charging and alternative fuel infrastructure
- 3.2.2.3 Stringent maritime safety and environmental regulations
- 3.2.3 Market opportunities
- 3.2.3.1 Fleet modernization and replacement programs
- 3.2.3.2 Adoption of zero-emission ferry technologies
- 3.2.3.3 Expansion of urban water transport networks
- 3.2.3.4 Digitalization and smart ferry operations
- 3.2.1 Growth drivers
- 3.3 Growth potential analysis
- 3.4 Technology and Innovation landscape
- 3.4.1 Current technologies
- 3.4.2 Emerging technologies
- 3.5 Pricing Analysis (Driven by Primary Research)
- 3.5.1 Historical Price Trend Analysis
- 3.5.2 Pricing Strategy by Player Type (Premium / Value / Cost-plus)
- 3.6 Regulatory landscape
- 3.6.1 North America
- 3.6.1.1 US Coast Guard (USCG) Passenger Vessel Regulations (US)
- 3.6.1.2 US Environmental Protection Agency (EPA) Marine Engine Emission Standards (US)
- 3.6.1.3 Transport Canada Marine Safety Regulations (Canada)
- 3.6.1.4 US Coast Guard Subchapter K Regulations for Small Passenger Vessels (US)
- 3.6.2 Europe
- 3.6.2.1 EU Directive 2009/45/EC on Safety Rules and Standards for Passenger Ships
- 3.6.2.2 Regulation (EU) 2023/1805 (FuelEU Maritime)
- 3.6.2.3 EU MRV Regulation (Monitoring, Reporting and Verification of CO2 Emissions)
- 3.6.2.4 European Maritime Safety Agency (EMSA) Passenger Ship Safety Framework
- 3.6.3 Asia-Pacific
- 3.6.3.1 China Maritime Safety Administration (MSA) Passenger Ship Regulations (China)
- 3.6.3.2 Japan Ship Safety Act (Japan)
- 3.6.3.3 Indian Merchant Shipping Act & Inland Vessels Act (India)
- 3.6.3.4 Australian National Standard for Commercial Vessels (NSCV) (Australia)
- 3.6.3.5 Marine Safety (Domestic Commercial Vessel) National Law (Australia)
- 3.6.4 Latin America
- 3.6.4.1 Brazilian Maritime Authority (NORMAM) Passenger Vessel Regulations (Brazil)
- 3.6.4.2 Mexican Merchant Marine Regulations (Mexico)
- 3.6.5 Middle East & Africa
- 3.6.5.1 UAE Maritime Transport Law & Passenger Vessel Regulations (UAE)
- 3.6.5.2 Saudi Ports Authority (Mawani) Maritime Safety Regulations (Saudi Arabia)
- 3.6.5.3 South African Merchant Shipping Act & SAMSA Passenger Ship Regulations (South Africa)
- 3.6.1 North America
- 3.7 Porter's analysis
- 3.8 PESTEL analysis
- 3.9 Patent analysis (Driven by Primary Research)
- 3.10 Trade Data Analysis (Driven by paid database)
- 3.10.1 Import/export volume & value trends
- 3.10.2 Key trade corridors & tariff impact
- 3.11 Cost breakdown analysis
- 3.12 Impact of AI & generative AI on the market
- 3.12.1 AI Driven Disruption of Existing Business Models
- 3.12.2 GenAI Use Cases and Adoption Roadmap by Segment
- 3.12.3 Risks Limitations and Regulatory Considerations
- 3.13 Capacity & Production Landscape (Driven by Primary Research)
- 3.13.1 Installed Capacity by Region & Key Producer
- 3.13.2 Capacity Utilization Rates & Expansion Pipelines
- 3.14 Sustainability and environmental aspects
- 3.14.1 Sustainable practices
- 3.14.2 Waste reduction strategies
- 3.14.3 Energy efficiency in production
- 3.14.4 Eco-friendly Initiatives
- 3.14.5 Carbon footprint considerations
- 3.15 Forecast assumptions & scenario analysis (Driven by Primary Research)
- 3.15.1 Base Case key macro & industry variables driving CAGR
- 3.15.2 Optimistic Scenarios Favorable Macro and Industry Tailwinds
- 3.15.3 Pessimistic Scenario Macroeconomic slowdown or industry headwinds
Chapter 4 Competitive Landscape, 2025
- 4.1 Introduction
- 4.2 Company market share analysis
- 4.2.1 North America
- 4.2.2 Europe
- 4.2.3 Asia-Pacific
- 4.2.4 Latin America
- 4.2.5 Middle East & Africa
- 4.3 Competitive positioning matrix
- 4.4 Key developments
- 4.4.1 Mergers & acquisitions
- 4.4.2 Partnerships & collaborations
- 4.4.3 New product launches
- 4.4.4 Expansion plans and funding
- 4.5 Company tier benchmarking
- 4.5.1 Tier classification criteria & qualifying thresholds
- 4.5.2 Tier positioning matrix by revenue, geography & innovation
Chapter 5 Market Estimates & Forecast, By Ferry Type, 2022 - 2035 ($Mn, Units)
- 5.1 Key trends
- 5.2 Ro-Pax Ferry (Roll-on/Roll-off Passenger Ferry)
- 5.3 Cruise Ferry
- 5.4 Cable/Chain Ferry
- 5.5 High-Speed Ferry
- 5.6 Others
Chapter 6 Market Estimates & Forecast, By Propulsion Type, 2022 - 2035 ($Mn, Units)
- 6.1 Key trends
- 6.2 Diesel
- 6.3 Hybrid Diesel-Electric
- 6.4 Battery Electric
- 6.5 LNG (Liquefied Natural Gas)
- 6.6 Hydrogen Fuel Cell
- 6.7 Other
Chapter 7 Market Estimates & Forecast, By Passenger Capacity, 2022 - 2035 ($Mn, Units)
- 7.1 Key trends
- 7.2 Up to 300 Passengers
- 7.3 301-1,000 Passengers
- 7.4 Above 1,000 Passengers
Chapter 8 Market Estimates & Forecast, By Ownership/Operator, 2022 - 2035 ($Mn, Units)
- 8.1 Key trends
- 8.2 Government/Public Operators
- 8.3 Private Commercial Operators
- 8.4 Public-Private Partnership (PPP) Operators
Chapter 9 Market Estimates & Forecast, By Application, 2022 - 2035 ($Mn, Units)
- 9.1 Key trends
- 9.2 Public Transportation
- 9.3 Tourism & Sightseeing
- 9.4 Island & Remote Connectivity
- 9.5 Inland Waterway Transportation
- 9.6 Cross-Border Transportation
- 9.7 Others
Chapter 10 Market Estimates & Forecast, By Region, 2022 - 2035 ($Mn, Units)
- 10.1 North America
- 10.1.1 US
- 10.1.2 Canada
- 10.2 Europe
- 10.2.1 UK
- 10.2.2 Germany
- 10.2.3 France
- 10.2.4 Italy
- 10.2.5 Spain
- 10.2.6 Belgium
- 10.2.7 Netherlands
- 10.2.8 Sweden
- 10.2.9 Russia
- 10.3 Asia Pacific
- 10.3.1 China
- 10.3.2 India
- 10.3.3 Japan
- 10.3.4 Australia
- 10.3.5 Singapore
- 10.3.6 South Korea
- 10.3.7 Vietnam
- 10.3.8 Indonesia
- 10.3.9 Thailand
- 10.4 Latin America
- 10.4.1 Brazil
- 10.4.2 Mexico
- 10.4.3 Argentina
- 10.5 MEA
- 10.5.1 South Africa
- 10.5.2 Saudi Arabia
- 10.5.3 UAE
- 10.5.4 Turkey
Chapter 11 Company Profiles
- 11.1 Global Players
- 11.1.1 Austal
- 11.1.2 Chantiers de l'Atlantique
- 11.1.3 CSSC
- 11.1.4 Damen Shipyards
- 11.1.5 Fincantieri
- 11.1.6 Hyundai Mipo Dockyard (HMD)
- 11.1.7 Incat Tasmania
- 11.1.8 Meyer Werft
- 11.1.9 Mitsubishi Heavy Industries (MHI)
- 11.1.10 VARD
- 11.2 Regional Players
- 11.2.1 Cochin Shipyard Limited (CSL)
- 11.2.2 Eastern Shipbuilding
- 11.2.3 Navantia
- 11.2.4 Nichols Brothers Boat Builders
- 11.2.5 Rauma Marine Constructions (RMC)
- 11.2.6 Remontowa Shipbuilding
- 11.3 Emerging Players / Disruptors
- 11.3.1 Brødrene Aa
- 11.3.2 Ferguson Marine
- 11.3.3 Penguin International
- 11.3.4 Strategic Marine


