
|
시장보고서
상품코드
2062187
여객 페리 시장 : 점유율 분석, 업계 동향과 통계, 성장 예측(2026-2031년)Passenger Ferries - Market Share Analysis, Industry Trends & Statistics, Growth Forecasts (2026 - 2031) |
||||||
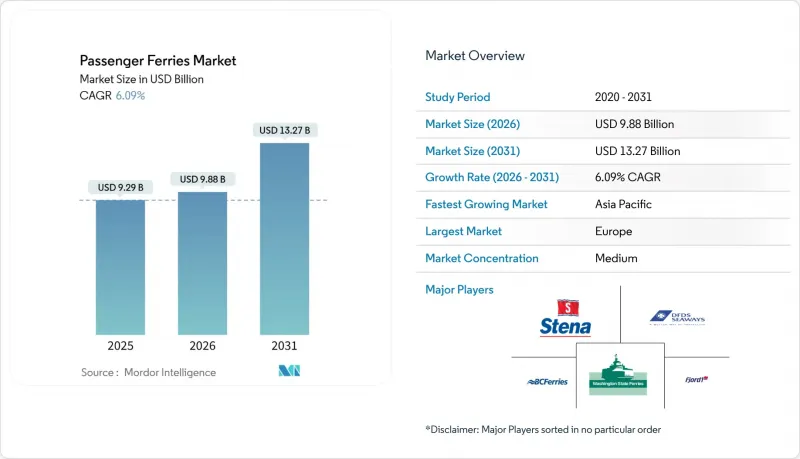
Mordor Intelligence에 의하면, 여객 페리 시장 규모는 2025년 92억 9,000만 달러, 2026년 98억 8,000만 달러에서 2031년까지 132억 7,000만 달러로 확대되어 2026년부터 2031년까지 CAGR 6.09%를 나타낼 것으로 예측됩니다.
국제해사기구(IMO)의 엄격한 탄소강도지수(CII) 규제, 정부 주도의 도서 간 교통망 확충 프로그램의 급증, 그리고 대중교통과 해상 풍력 발전소 건설에 모두 활용되는 다목적 선박에 대한 수요 증가가 여객 페리 시장을 재편하고 있습니다. 본 보고서는 페리의 유형(Ro-Pax, 고속, 크루즈, 양단 추진형, 수중익선), 추진 방식(디젤, 하이브리드, 전기, LNG, 수소), 용도(통근, 관광, 차량 수송, 도서 간 연결, 다목적), 운항 주체(정부, 민간, 혼합), 지역(북미, 남미, 아시아태평양, 유럽, 중동 및 아프리카)별로 분류되어 있습니다. 시장 전망은 금액(달러) 기준으로 제시되어 있습니다.
세계 여객 페리 시장 동향과 인사이트
정부 자금을 통한 도서 간 연결 회랑이 신규 항로 개설을 촉진
장기 공공 계약은 현금 흐름을 보장하며, 사업자가 선단을 현대화하고 항로를 확장하며, 외딴 지역 사회를 위한 합리적인 운임을 유지하도록 장려하고 있습니다. 스코틀랜드가 2028년까지 CalMac에 약속한 5억 8,000만 파운드(7억 8,000만 달러)의 지원금은 새로운 무공해 선박 도입을 뒷받침하는 동시에, 수요 변동으로부터 사업자를 보호하고 있습니다. 그리스와 인도네시아도 유사한 보조금 모델을 채택하고 있으며, 페리를 상업적인 사치품이 아닌 공공재로 전환함으로써 여객 페리 시장에 지속 가능한 수송량의 기반을 마련하고 있습니다. 예측 가능한 수입은 신용도를 높여, 신조선 프로그램의 차입 비용을 절감합니다. 정시성이나 배출량과 연계된 계약상 성과 지표는 디지털화와 에너지 효율 향상을 가속화합니다. 조선소는 대체 추진 시스템 생산 라인에 대한 투자를 정당화할 수 있는 수년까지 수주 파이프라인의 혜택을 누리고 있습니다.
다가오는 IMO CII 준수 기한이 선단 현대화를 가속화하고 있습니다.
CII(국제해사기구의 선박 탄소 효율 지표) 체계는 운항 시 탄소 효율을 매년 평가하며, 3년 연속 D 또는 E 등급에 머무르는 선박에 대해서는 시정 계획을 수립하도록 의무화하고 있습니다. 개조 비용이 잔존 가치를 초과하는 경우가 많기 때문에 운항사는 노후화된 선체를 조기에 퇴역시키고, A 또는 B 등급을 최적화한 신조선을 발주하고 있습니다. 스테나 라인의 NewMax급 선박은 최적화된 선체와 하이브리드 추진 시스템을 통해 유럽 항로의 미래 경쟁력을 확보하고, 한발 앞서 규제 대응을 실천하고 있습니다. 현재 조달 일정은 기계적 수명 주기가 아닌 CII 평가 기간에 맞추어 설정되어 있습니다. 대출 기관들이 예상 CII 점수에 금리 마진을 연동하는 사례가 늘어나고 있으며, 이로 인해 자본은 더욱 고효율 프로젝트로 집중되고 있습니다. 또한, 이 규정은 이용률이 낮은 노선에 대해 운항 횟수를 통합하도록 요구하고 있어, 여객 페리 시장의 고빈도 노선 간 경쟁을 심화시키고 있습니다.
불확실한 친환경 연료 공급망(E-메탄올/그린 수소)이 프로젝트 리스크를 높이고 있습니다.
운항사는 선체의 사용 연한이 25년인 반면, 연료 계약 기간이 10년을 초과하는 경우는 드물다는 불일치에 직면해 있습니다. 마스크가 자사의 메탄올 생산에 자금을 지원한 경험은 중소 페리 회사들이 감당하기 어려운 자본적 장벽을 여실히 드러내고 있습니다. 수소의 경우, 비용과 안전 규정이 더 엄격하기 때문에 인프라가 부족한 실정입니다. 이러한 교착 상태는 대체 연료 선박의 수주를 저해하고 있으며, 30해리 미만의 항로에서는 구매자들이 배터리 구동 방식을 선택하는 요인이 되고 있습니다. 장기 연료 공급 계약이 없기 때문에 대출 기관은 미래 현금 흐름을 할인하여 평가함으로써 프로젝트 파이낸싱 비용을 상승시키고 있습니다. 그 결과, 친환경 연료와 관련된 불확실성으로 인해 여객 페리 시장 전체의 예상 연평균 성장률(CAGR)이 1.2% 하락했습니다.
부문별 분석
2025년 여객 페리 시장 규모에서 기존 Ro-Pax 선박이 48.46%의 점유율을 차지하고 있는 것은 확립된 롤온 인프라를 활용하여 다양한 해상 조건에서 승객과 차량을 모두 수송할 수 있는 능력을 반영한 것입니다. 운항사는 선단을 전면적으로 교체하지 않고도 CII 등급을 유지하기 위해 선체의 유선형 개조 및 하이브리드 추진 장치 도입을 추진하고 있습니다. 크루즈 페리는 선내 소매 및 접객 사업을 통해 수익을 창출함으로써, 유가 변동에 따른 영향을 완화하고 있습니다. 고속선은 비싼 운임을 지불하는 것을 마다하지 않는 시간을 중시하는 통근객을 대상으로 하는 반면, 양단 선체는 선박의 선회를 필요로 하지 않아 매우 좁은 해협을 항해하는 데 탁월합니다.
연평균 성장률(CAGR) 10.03%로 성장하고 있는 수중익선 및 호버크래프트는 액티브 포일 기반 안정화 기술을 활용해 항력을 최대 80%까지 줄임으로써 에너지 소비를 대폭 절감하고, 높은 CII 등급을 확보하고 있습니다. 복합재료와 실시간 제어 알고리즘의 발전으로 인해 거친 바다에서도 운항이 가능해지면서 항로망이 확대되고 있습니다. 낮은 운영 비용이 높은 초기 투자 비용을 상쇄하기 때문에 스칸디나비아와 걸프 지역의 선단들이 포일링 서비스의 시범 운영을 진행하고 있습니다. 광범위한 여객 페리 시장에서 이 선박들은 육상 교통 수단이 여전히 혼잡한, 과거에는 수익성이 낮았던 통근 노선을 개척하고 있습니다.
디젤 엔진은 전 세계적인 연료 공급망과 항해 거리의 유연성 덕분에 여객 페리 시장 규모의 68.68%를 계속 차지하고 있지만, 배터리 가격 하락에 따라 완전 전기 추진 선박은 연평균 성장률(CAGR) 11.60%로 성장을 지속하고, 있습니다. 워싱턴주 페리 당국은 점보 마크 II형 선박을 하이브리드화함으로써 25%의 연료 절감 효과를 기대하고 있으며, 이는 이러한 전환의 가치를 입증하고 있습니다. LNG는 규제 준수에 있어 일부 완화를 가져오지만, 메탄 누출에 대한 감시가 강화되면서 수주 잔고를 감소시키고 있습니다.
배터리 구동 선박은 하루 항해 거리가 육상 충전 가능 시간과 일치하는 30해리 미만의 구간에서 뛰어난 성능을 발휘하며, 에너지 비용을 60-70% 절감하고 유지보수도 간소화됩니다. 메가와트급 충전기가 보급됨에 따라, 전기 부문 여객 페리 시장 규모는 더욱 확대될 전망입니다. 일본의 ‘하나리아’와 같은 수소 연료전지 프로토타입은 기술적 실현 가능성을 입증하고 있지만, 연료 보급 생태계가 성숙하기 전까지는 틈새 시장 수준의 존재에 그치고 있습니다.
지역별 분석
유럽이 여객 페리 시장 점유율의 35.51%를 차지하는 배경에는 해안 지역의 높은 인구 밀도, 견조한 관광 수요, 그리고 사업자들이 하이브리드 및 전기 추진 선박으로 전환하도록 유도하는 EU의 엄격한 배출 규제가 있습니다. 2026년 EU가 배출권 거래 제도(ETS)를 근해 해운으로 확대함에 따라, 디젤 선박에는 탄소 비용이 부과될 것이며, 선대 계획 담당자들은 저탄소 설계를 추구하게 될 것입니다. 북유럽에서는 수소 페리와 자율 항해 페리의 시험 항로도 운영되고 있으며, 이 지역은 여객 페리 시장에서 기술 수출의 거점으로서의 입지를 확고히 하고 있습니다.
섬 지역의 지리적 조건과 대도시의 교통 체증이 아시아태평양의 연평균 성장률(CAGR) 8.10%라는 최고 수준의 성장을 이끌고 있습니다. 인도네시아의 ASDP는 현재 총 길이 13,000km에 달하는 154개 항구를 연결하며, 지역 수요를 뒷받침하고 있습니다. 한편, 중국의 대규모 전기 선박 프로그램은 전 세계 단가 인하에 기여하고 있습니다. 일본의 조선소들은 수소 연료전지 기술력을 확대하고 있으며, 한국의 조선사들은 배터리 대응 선체 생산 라인을 가속화하고 있어, 양측이 협력하여 추진 시스템의 혁신을 주도하고 있습니다.
북미는 시장 점유율 면에서는 유럽에 뒤처져 있지만, 워싱턴주 페리의 하이브리드화나 뉴욕의 무공해 고속 페리 시범 운항과 같은 주목할 만한 프로젝트를 통해 추진 시스템 기준에 지대한 영향을 미치고 있습니다. 연방 정부의 인프라 보조금은 국내 조선 프로그램을 지원하고 조선소의 현대화를 촉진하고 있습니다. 그 밖의 지역에서는 남미와 아프리카에 미개척 잠재 수요가 존재하지만, 환율 변동, 항만 시설 부족, 자금 조달 제약과 같은 과제로 인해 그 성장이 저해되고 있습니다. 다국적 금융기관과 개발은행은 여객 페리 시장의 성장을 도모하기 위해 이러한 과제 해결을 목표로 하고 있습니다.
기타 혜택:
- 엑셀 형식 시장 예측(ME) 시트
- 3개월간의 애널리스트 지원
자주 묻는 질문
목차
제1장 서론
제2장 조사 방법
제3장 주요 요약
제4장 시장 구도
제5장 시장 규모와 성장 예측
제6장 경쟁 구도
제7장 시장 기회와 향후 전망
JHS 26.06.19According to Mordor Intelligence, the passenger ferries market size is projected to expand from USD 9.29 billion in 2025 and USD 9.88 billion in 2026 to USD 13.27 billion by 2031, registering a 6.09% CAGR between 2026 and 2031.

Stringent International Maritime Organization (IMO) Carbon Intensity Indicator (CII) rules, the surge in government-backed island-connectivity programs, and mounting demand for dual-purpose vessels that serve both public transport and offshore-wind construction are reshaping the passenger ferries market. This report is Segmented by Ferry Type (Ro-Pax, High-Speed, Cruise, Double-Ended, Hydrofoil), by Propulsion (Diesel, Hybrid, Electric, LNG, Hydrogen), by Application (Commuter, Tourism, Vehicle Transport, Island Connectivity, Mixed-Use), by Operator Type (Government, Private, Mixed), and by Region (North America, South America, Asia-Pacific, Europe, MEA). The Market Forecasts are Provided in Terms of Value (USD).
Global Passenger Ferries Market Trends and Insights
Government-Funded Island-Connectivity Corridors Catalyzing New Routes
Long-term public contracts guarantee cash flow, encouraging operators to modernize fleets, expand routes, and sustain affordable fares for remote communities. Scotland's GBP 580 million (USD 780 million) commitment to CalMac until 2028 underwrites new zero-emission tonnage and shields operators from demand volatility. Greece and Indonesia follow similar subsidy models that convert ferries into public goods rather than commercial luxuries, giving the passenger ferry market durable volume baselines. Predictable income improves credit profiles, lowering borrowing costs for new-build programs. Contractual performance metrics linked to punctuality and emissions accelerate digitalization and energy-efficiency upgrades. Shipyards benefit from multi-year order pipelines that justify investments in alternative-propulsion production lines.
Looming IMO CII Compliance Deadlines Triggering Accelerated Fleet Renewal
The CII framework rates operational carbon efficiency yearly and mandates corrective plans for vessels stuck in D or E bands for three straight years. Faced with retrofit costs that frequently exceed residual values, operators are decommissioning older hulls early and ordering new builds optimized for A or B ratings. Stena Line's NewMax class illustrates pre-emptive compliance, using optimized hulls and hybrid power to future-proof European routes. Procurement schedules are now anchored to CII windows instead of mechanical life cycles. Lenders increasingly tie interest margins to anticipated CII scores, further tilting capital toward high-efficiency projects. The rule also pressures under-utilized services to consolidate sailings, intensifying competition on high-frequency corridors within the passenger ferries market.
Uncertain Green-Fuel Supply Chains (E-Methanol / Green H2) Raising Project Risk
Operators confront a mismatch between 25-year hull lives and fuel contracts seldom extending beyond a decade. Maersk's experience financing its own methanol production spotlights the capital hurdle smaller ferry firms cannot match. Hydrogen faces steeper costs and safety protocols, making infrastructure scarce. The stalemate deters orders for alternative-fuel vessels, nudging buyers toward battery options for sub-30 nm runs. Without long-term fuel offtake agreements, lenders discount future cash flows, inflating project-finance costs. As a result, green-fuel uncertainty chips 1.2 percentage points off forecast CAGR across the passenger ferries market.
Other drivers and restraints analyzed in the detailed report include:
- Battery-As-A-Service Leasing Models Lowering Adoption Barriers for Operators
- Automated Docking & Remote-Operations Tech Shrinking Port Turnaround Times
- Rising Insurance Premiums Linked to Lithium-Battery Fire-Safety Concerns
For complete list of drivers and restraints, kindly check the Table Of Contents.
Segment Analysis
Conventional Ro-Pax vessels' 48.46% stake in the 2025 passenger ferries market size reflects their ability to carry both passengers and vehicles across varying sea states, leveraging established roll-on infrastructure. Operators pursue hull-streamlining retrofits and hybrid powerplants to protect CII ratings without wholesale fleet replacement. Cruise ferries monetize onboard retail and hospitality, cushioning fuel-price swings. High-speed craft address time-sensitive commuters willing to pay premium fares, whereas double-ended hulls excel on ultra-short straits by eliminating vessel turning.
Hydrofoil & hovercraft platforms, expanding at a 10.03% CAGR, capitalize on active-foil stabilization that cuts drag by up to 80%, slashing energy use and securing high CII grades. Advances in composite materials and real-time control algorithms now permit operations in rougher seas, enlarging their route map. Lower operating costs counterbalance higher capex, encouraging fleets in Scandinavia and the Gulf to pilot foiling services. Within the wider passenger ferries market, these craft unlock previously marginal commuter corridors where shore-based alternatives remain congested.
Diesel engines retained 68.68% of the passenger ferries market size thanks to global fuel distribution and range flexibility, yet fully electric hulls are registering an 11.60% CAGR as battery prices fall. Washington State Ferries projects 25% fuel-saving gains by converting Jumbo Mark II vessels to hybrid, underscoring transitional value. LNG offers partial compliance relief but faces methane-slip scrutiny, dampening order books.
Battery-electric craft excel on sub-30 nm sectors where daily distance aligns with shore-charging windows, delivering 60-70% lower energy costs and simplified maintenance. The passenger ferries market size for electric segments is poised to accelerate as megawatt-scale chargers proliferate. Hydrogen fuel-cell prototypes such as Japan's Hanaria prove technical feasibility yet remain niche until bunkering ecosystems mature.
Geography Analysis
Europe's 35.51% contribution to the passenger ferries market share rests on dense coastal populations, robust tourism flows, and stringent EU emission caps that push operators toward hybrid and electric tonnage. The bloc's extension of its Emissions Trading System to short-sea shipping in 2026 will impose carbon costs on diesel craft, nudging fleet planners toward low-carbon designs. Northern Europe also hosts pilot hydrogen and autonomous-ferry corridors, positioning the region as a technology export hub within the passenger ferries market.
Archipelagic geographies and megacity congestion propel Asia-Pacific's leading 8.10% CAGR. Indonesia's ASDP now links 154 ports across 13,000 km, anchoring regional demand while China's large-scale electric-vessel programs lower unit costs globally. Japanese yards are scaling hydrogen fuel-cell know-how, and South Korean builders are accelerating battery-ready hull lines, collectively advancing propulsion innovation.
North America trails Europe in share, but commands outsized influence on propulsion standards through marquee projects such as Washington State Ferries' hybrid conversions and New York's zero-emission fast-ferry trials. Federal infrastructure grants reward domestic build programs, stimulating shipyard modernization. Elsewhere, South America and Africa present untapped latent demand restrained by currency volatility, port deficits, and limited financing, challenges that multinational lenders and development banks aim to address to grow the passenger ferries market.
- Stena Line
- DFDS Seaways
- BC Ferries
- Washington State Ferries
- Fjord1
- Tallink Grupp
- Mols Linien
- P&O Ferries
- Brittany Ferries
- Red Funnel
- Wightlink
- Interislander
- NY Waterway
- Corsica Ferries
- Irish Ferries
- Balearia
- Grimaldi Lines
- Jadrolinija
- COSCO Shipping Passenger
- Mitsui O.S.K. Lines (Sunflower)
- Viking Line
Additional Benefits:
- The market estimate (ME) sheet in Excel format
- 3 months of analyst support
TABLE OF CONTENTS
1 Introduction
- 1.1 Study Assumptions & Market Definition
- 1.2 Scope of the Study
2 Research Methodology
3 Executive Summary
4 Market Landscape
- 4.1 Market Overview
- 4.2 Market Drivers
- 4.2.1 Government-Funded Island-Connectivity Corridors Catalyzing New Routes
- 4.2.2 Looming IMO CII Compliance Deadlines Triggering Accelerated Fleet Renewal
- 4.2.3 Battery-As-A-Service Leasing Models Lowering Adoption Barriers for Operators
- 4.2.4 Automated Docking & Remote-Operations Tech Shrinking Port Turnaround Times
- 4.2.5 Offshore-Wind Service Synergies Creating Dual-Purpose Passenger Transfer Demand
- 4.2.6 Modular Floating Terminals Enabling Rapid Launch of Pop-Up Commuter Services
- 4.3 Market Restraints
- 4.3.1 Uncertain Green-Fuel Supply Chains (E-Methanol / Green-H2) Raising Project Risk
- 4.3.2 Rising Insurance Premiums Linked to Lithium-Battery Fire-Safety Concerns
- 4.3.3 Berth Scarcity & Urban Port Congestion Limiting Schedule Expansion
- 4.3.4 Exchange-Rate Volatility Compressing Fare Margins in Emerging Economies
- 4.4 Value / Supply-Chain Analysis
- 4.5 Regulatory Landscape
- 4.6 Technological Outlook
- 4.7 Porter's Five Forces
- 4.7.1 Threat of New Entrants
- 4.7.2 Bargaining Power of Suppliers
- 4.7.3 Bargaining Power of Buyers
- 4.7.4 Threat of Substitutes
- 4.7.5 Competitive Rivalry
5 Market Size & Growth Forecasts
- 5.1 By Ferry Type (Value)
- 5.1.1 Conventional Ro-Pax
- 5.1.2 High-Speed Craft
- 5.1.3 Cruise Ferry
- 5.1.4 Double-Ended Ferry
- 5.1.5 Hydrofoil & Hovercraft
- 5.2 By Propulsion Type (Value)
- 5.2.1 Diesel
- 5.2.2 Diesel-Electric Hybrid
- 5.2.3 Fully Electric / Battery
- 5.2.4 LNG
- 5.2.5 Hydrogen Fuel Cell
- 5.3 By Application (Value)
- 5.3.1 Commuter & Public Transport
- 5.3.2 Tourism & Leisure
- 5.3.3 Vehicle Transport (Ro-Pax)
- 5.3.4 Island / Remote Connectivity
- 5.3.5 Mixed-Use Transport (Cargo + Passenger)
- 5.4 By Operator Type (Value)
- 5.4.1 Government / Public
- 5.4.2 Private Commercial
- 5.4.3 Mixed Public-Private
- 5.5 By Geography (Value)
- 5.5.1 North America
- 5.5.1.1 United States
- 5.5.1.2 Canada
- 5.5.1.3 Mexico
- 5.5.2 South America
- 5.5.2.1 Brazil
- 5.5.2.2 Peru
- 5.5.2.3 Chile
- 5.5.2.4 Argentina
- 5.5.2.5 Rest of South America
- 5.5.3 Asia-Pacific
- 5.5.3.1 India
- 5.5.3.2 China
- 5.5.3.3 Japan
- 5.5.3.4 Australia
- 5.5.3.5 South Korea
- 5.5.3.6 South East Asia (Singapore, Malaysia, Thailand, Indonesia, Vietnam, and Philippines)
- 5.5.3.7 Rest of Asia-Pacific
- 5.5.4 Europe
- 5.5.4.1 United Kingdom
- 5.5.4.2 Germany
- 5.5.4.3 France
- 5.5.4.4 Spain
- 5.5.4.5 Italy
- 5.5.4.6 BENELUX (Belgium, Netherlands, and Luxembourg)
- 5.5.4.7 NORDICS (Denmark, Finland, Iceland, Norway, and Sweden)
- 5.5.4.8 Rest of Europe
- 5.5.5 Middle East and Africa
- 5.5.5.1 United Arab Emirates
- 5.5.5.2 Saudi Arabia
- 5.5.5.3 South Africa
- 5.5.5.4 Nigeria
- 5.5.5.5 Rest of Middle East And Africa
- 5.5.1 North America
6 Competitive Landscape
- 6.1 Market Concentration
- 6.2 Strategic Moves
- 6.3 Market Share Analysis
- 6.4 Company Profiles (includes Global level Overview, Market level overview, Core Segments, Financials as available, Strategic Information, Market Rank/Share for key companies, Products & Services, and Recent Developments)
- 6.4.1 Stena Line
- 6.4.2 DFDS Seaways
- 6.4.3 BC Ferries
- 6.4.4 Washington State Ferries
- 6.4.5 Fjord1
- 6.4.6 Tallink Grupp
- 6.4.7 Mols Linien
- 6.4.8 P&O Ferries
- 6.4.9 Brittany Ferries
- 6.4.10 Red Funnel
- 6.4.11 Wightlink
- 6.4.12 Interislander
- 6.4.13 NY Waterway
- 6.4.14 Corsica Ferries
- 6.4.15 Irish Ferries
- 6.4.16 Balearia
- 6.4.17 Grimaldi Lines
- 6.4.18 Jadrolinija
- 6.4.19 COSCO Shipping Passenger
- 6.4.20 Mitsui O.S.K. Lines (Sunflower)
- 6.4.21 Viking Line
7 Market Opportunities & Future Outlook
- 7.1 White-space & Unmet-Need Assessment
