

|
시장보고서
상품코드
2109272
재활용 가능한 컵 시장 : 시장 비즈니스 기회, 성장요인, 업계 동향 분석 및 예측(2026-2035년)Recyclable Cups Market Opportunity, Growth Drivers, Industry Trend Analysis, and Forecast 2026 - 2035 |
||||||

세계의 재활용 가능한 컵 시장은 2025년에 211억 달러 규모로 평가되었고, CAGR 6.3%로 성장할 전망이며, 2035년까지 387억 달러에 이를 것으로 추정되고 있습니다.
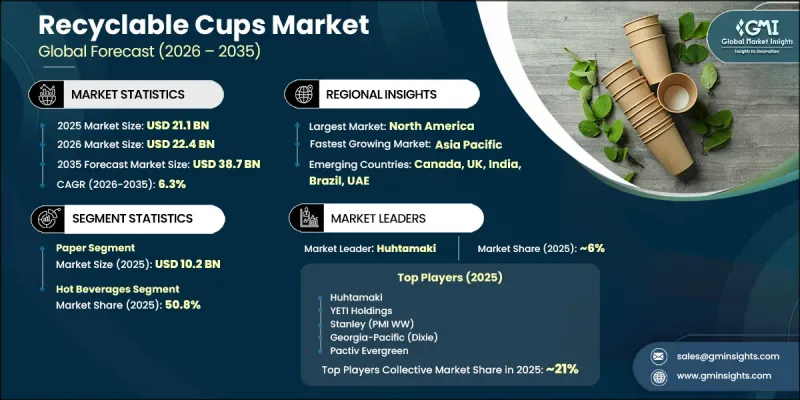
이 시장의 확대는 단순히 소비량 증가뿐만 아니라, 규제에 따른 소재 전환의 영향도 받고 있습니다. 기존 플라스틱 제품에 대한 규제 강화로 인해 주요 시장 전반에서 인증된 재활용 가능한 컵으로의 전환이 가속화되고 있습니다. 기업의 지속가능성 노력 강화, 소비자의 환경 의식 고취, 그리고 폐기물 관리 관행의 변화가 재활용 가능한 포장 형태로의 전환을 더욱 뒷받침하고 있습니다. 기업들이 환경 기준을 충족하면서도 업무 효율을 유지하는 데 주력하는 가운데, 재활용 가능한 컵은 현대 푸드서비스 포장 전략에서 필수적인 요소로 자리 잡고 있습니다. 정부 규제와 지속가능성 노력이 맞물리면서, 종이 및 기타 재활용 가능한 컵 소재에 장기적인 기회가 창출되고 있습니다. 플라스틱 대체품으로의 전환이 지속됨에 따라, 전 세계 공급망 전반에 걸쳐 친환경 컵 솔루션에 대한 수요가 더욱 높아질 것으로 예측됩니다.
| 시장 범위 | |
|---|---|
| 개시 연도 | 2025년 |
| 예측 기간 | 2026-2035년 |
| 개시 연도 시장 규모 | 211억 달러 |
| 예측액 | 387억 달러 |
| CAGR | 6.3% |
종이컵 시장은 2025년에 102억 달러 시장 규모를 기록한 것으로 평가되었으며, 2035년까지 연평균 성장률(CAGR) 5.7%로 성장할 것으로 전망됩니다. 종이컵은 잘 구축된 제조 생태계, 폭넓은 접근성, 그리고 지속가능성을 중시하는 포장 체계 내에서의 높은 수용성 덕분에 계속해서 주도적인 위치를 유지하고 있습니다. 기업들이 재활용 인프라 및 환경 목표에 부합하는 대체재를 모색함에 따라, 섬유 기반 컵 형태에 대한 지지가 지속적으로 높아지고 있습니다. 이 부문의 성장은 인증된 재활용 가능한 배리어 코팅 종이컵의 채택 확대에 힘입고 있으며, 이러한 제품들은 일반적으로 기존의 플라스틱 라이닝이 적용된 대체품에 비해 높은 부가가치를 지니고 있습니다. 수요 증가는 대체 수요와 성능이 향상된 재활용 가능한 포장 솔루션에 대한 선호도 상승에 의해 주도되고 있습니다.
2025년에는 뜨거운 음료 하위 부문이 시장 점유율의 50.8%를 차지한 것으로 평가되었으며, 2035년까지 연평균 성장률(CAGR) 6.1%로 성장할 것으로 전망됩니다. 이 부문의 견고한 시장 입지는 재활용 가능한 포장 도입이 현저히 진전되고 있는 커피 소매업체, 외식업체, 음료 체인점의 안정적인 수요에 힘입고 있습니다. 따뜻한 음료에 사용되는 종이컵의 디자인은 단열성, 내구성, 내습성을 갖추도록 개발되어 재활용 가능한 컵 산업의 주요 혁신 동력이 되고 있습니다. 따뜻한 음료 용도로 개발된 배리어 코팅 기술의 발전 또한 성능 기준을 향상시킴으로써 다른 음료 카테고리에서의 더 광범위한 채택을 뒷받침하고 있습니다.
북미의 재활용 가능한 컵 시장은 2025년에 91억 달러에 달했으며, 43.2%의 점유율을 차지했습니다. 이는 확고한 입지를 갖춘 QSR(퀵서비스 레스토랑) 및 커피 소매 네트워크의 활발한 수요와 더불어, 기존의 일회용 플라스틱 포장에 대한 규제 압력이 높아진 것이 원동력이 되었습니다. 기업과 기관 사이에서 지속 가능한 조달 관행에 대한 관심이 높아지면서 재활용 가능한 컵으로의 전환이 가속화되고 있습니다. 환경 정책과 폐기물 감축 노력은 상업 및 기관용 분야에서 섬유 기반 및 기타 재활용 가능한 포장 형태에 대한 수요를 증가시킴으로써 시장의 전환을 더욱 촉진하고 있습니다.
자주 묻는 질문
목차
제1장 조사 방법 및 범위
제2장 주요 요약
제3장 업계 인사이트
제4장 경쟁 구도
제5장 시장 추산 및 예측 : 소재 유형별(2022-2035년)
제6장 시장 추산 및 예측 : 용량별(2022-2035년)
제7장 시장 추산 및 예측 : 폐쇄 방식별(2022-2035년)
제8장 시장 추산 및 예측 : 용도별(2022-2035년)
제9장 시장 추산 및 예측 : 최종 사용자별(2022-2035년)
제10장 시장 추산 및 예측 : 유통 채널별(2022-2035년)
제11장 시장 추산 및 예측 : 지역별(2022-2035년)
제12장 기업 개요
AJY 26.08.18The Global Recyclable Cups Market was valued at USD 21.1 billion in 2025 and is estimated to grow at a CAGR of 6.3% to reach USD 38.7 billion by 2035.
The market's expansion is influenced by regulatory-driven material conversion rather than only rising consumption volumes. Growing restrictions on conventional plastic products are accelerating the transition toward certified recyclable cup solutions across major markets. Increasing corporate sustainability commitments, stronger environmental awareness among consumers, and changing waste management practices are further supporting the shift toward recyclable packaging formats. Recyclable cups are becoming an essential component of modern foodservice packaging strategies as businesses focus on meeting environmental standards while maintaining operational efficiency. The combined impact of government regulations and sustainability initiatives is creating long-term opportunities for paper-based and other recyclable cup materials. The continued transition away from plastic-based alternatives is expected to strengthen demand for environmentally responsible cup solutions across global supply chains.
| Market Scope | |
|---|---|
| Start Year | 2025 |
| Forecast Year | 2026-2035 |
| Start Value | $21.1 Billion |
| Forecast Value | $38.7 Billion |
| CAGR | 6.3% |
The paper segment generated USD 10.2 billion in 2025 and is projected to grow at a CAGR of 5.7% through 2035. Paper cups maintain a leading position due to their well-developed manufacturing ecosystem, broad availability, and favorable acceptance within sustainability-focused packaging frameworks. Fiber-based cup formats continue to gain preference as businesses seek alternatives that align with recycling infrastructure and environmental objectives. The segment's growth is supported by increasing adoption of certified recyclable barrier-coated paper cups, which generally command higher value compared with conventional plastic-lined alternatives. Demand growth is being shaped by both replacement requirements and the increasing preference for improved-performance recyclable packaging solutions.
The hot beverages sub-segment accounted for 50.8% share in 2025 and is anticipated to grow at a CAGR of 6.1% through 2035. The segment's strong market position is supported by consistent demand from coffee retailers, foodservice operators, and beverage chains where recyclable packaging adoption has progressed significantly. Paper cup designs used for hot beverages are developed to provide thermal protection, durability, and moisture resistance, making them a key driver of innovation within the recyclable cups industry. Improvements in barrier coating technologies developed for hot beverage applications are also supporting broader adoption across other beverage categories by enhancing performance standards.
North America Recyclable Cups Market reached USD 9.1 billion, capturing a 43.2% share in 2025, driven by strong demand from established QSR and coffee retail networks along with increasing regulatory pressure on conventional single-use plastic packaging. The growing focus on sustainable procurement practices among businesses and institutions is encouraging the adoption of recyclable cup alternatives. Environmental policies and waste reduction initiatives are further supporting market conversion by increasing demand for fiber-based and other recyclable packaging formats across commercial and institutional applications.
Major players operating in the global recyclable cups market are BioPak Pty Ltd, Huhtamaki Oyj, Sabert Corporation, Graphic Packaging International, Berry Global Group, Inc., World Centric, Dart Container Corporation (Solo Cup), Stora Enso Oyj, Eco-Products (Novatek International), Pactiv Evergreen Inc., Greiner Packaging International GmbH, Footprint, Georgia-Pacific LLC (Koch Industries), Lollicup USA Inc., and WinCup Holdings. Companies operating in the recyclable cups market are adopting strategies focused on sustainable product development, manufacturing expansion, partnerships, and innovation in material technologies to strengthen their competitive position. Market participants are investing in recyclable coatings, improved barrier solutions, and advanced manufacturing processes to enhance cup performance while meeting evolving environmental requirements. Companies are also expanding their product portfolios to serve diverse end-use industries, including foodservice, beverage chains, and institutional buyers. Strategic collaborations with retailers, packaging distributors, and sustainability-focused organizations are helping manufacturers improve market penetration. Businesses are emphasizing circular economy initiatives, supply chain optimization, and the development of cost-effective recyclable solutions to maintain long-term growth.
Table of Contents
Chapter 1 Methodology & Scope
- 1.1 Market scope & definitions
- 1.2 Research design
- 1.2.1 Research approach
- 1.2.2 Data collection methods
- 1.3 Base estimates and calculations
- 1.3.1 Base year calculation
- 1.3.2 Market estimates & forecasts parameters
- 1.4 Forecast Model
- 1.4.1 Key trends for market estimates
- 1.4.2 Quantified market impact analysis
- 1.4.2.1 Mathematical impact of growth parameters on forecast
- 1.4.3 Scenario analysis framework
- 1.5 Primary research and validation
- 1.5.1 Some of the primary sources (but not limited to)
- 1.6 Data mining sources
- 1.6.1 Paid Sources
- 1.7 Primary research and validation
- 1.7.1 Primary sources
- 1.8 Research Trail & confidence scoring
- 1.8.1 Research trail components
- 1.8.2 Scoring components
- 1.9 Research transparency addendum
- 1.9.1 Source attribution framework
- 1.9.2 Quality assurance metrics
- 1.10 Our commitment to trust
Chapter 2 Executive Summary
- 2.1 Industry 360° synopsis
- 2.2 Key market trends
- 2.2.1 Material type
- 2.2.2 Capacity
- 2.2.3 Closure type
- 2.2.4 Application
- 2.2.5 End-user
- 2.2.6 Distribution channel
Chapter 3 Industry Insights
- 3.1 Industry ecosystem analysis
- 3.1.1 Supplier landscape
- 3.1.2 Profit margin
- 3.1.3 Value addition at each stage
- 3.1.4 Factor affecting the value chain
- 3.2 Industry impact forces
- 3.2.1 Growth drivers
- 3.2.1.1 Stringent regulatory bans & levies on single-use plastics driving material substitution
- 3.2.1.2 Rising consumer preference for eco-friendly & sustainable packaging
- 3.2.1.3 Corporate ESG commitments & sustainability pledges by foodservice chains
- 3.2.1.4 Growth of food delivery, takeaway culture & on-the-go consumption
- 3.2.2 Industry pitfalls & challenges
- 3.2.2.1 Fragmented & inconsistent composting/recycling certification standards across regions
- 3.2.2.2 Consumer confusion between recyclable, compostable & biodegradable cup claims
- 3.2.2.3 Raw material price volatility (pulp, PLA resin, aluminum, bamboo fiber)
- 3.2.2.4 Competition from reusable cup solutions in environmentally regulated markets
- 3.2.3 Opportunities
- 3.2.3.1 Innovation in water-based & bio-based barrier coatings enabling true recyclability
- 3.2.3.2 Deposit-return schemes (DRS) creating new market structures for reusable recyclable cups
- 3.2.3.3 Expanding beverage industry in emerging economies driving volume demand
- 3.2.3.4 Adoption of post-consumer recycled (PCR) content in cup manufacturing
- 3.2.1 Growth drivers
- 3.3 Growth potential analysis
- 3.4 Future market trends
- 3.5 Technology and innovation landscape
- 3.5.1 Current technological trends
- 3.5.2 Emerging technologies
- 3.6 Regulatory landscape
- 3.6.1 Standards and compliance requirements
- 3.6.2 Regional regulatory frameworks
- 3.6.3 Certification standards
- 3.7 Trade data analysis (HS Code 3924.10)
- 3.7.1 Import/export volume & value trends
- 3.7.2 Key trade corridors & tariff impact
- 3.8 Pricing analysis
- 3.8.1 Historical price trend analysis (driven by primary research)
- 3.8.2 Pricing strategy by player type (premium / value / mass market)
- 3.9 Impact of AI & generative AI on the market
- 3.9.1 AI-driven disruption of existing business models
- 3.9.2 GenAI use cases & adoption roadmap by segment
- 3.9.3 Risks, limitations & regulatory considerations
- 3.10 Porter's analysis
- 3.11 PESTEL analysis
Chapter 4 Competitive Landscape, 2025
- 4.1 Introduction
- 4.2 Company market share analysis
- 4.2.1 By Region
- 4.2.1.1 North America
- 4.2.1.2 Europe
- 4.2.1.3 Asia Pacific
- 4.2.1.4 Latin America
- 4.2.1.5 Middle East & Africa
- 4.2.1 By Region
- 4.3 Company matrix analysis
- 4.4 Competitive analysis of major market players
- 4.5 Competitive positioning matrix
- 4.6 Key developments
- 4.6.1 Mergers & acquisitions
- 4.6.2 Partnerships & collaborations
- 4.6.3 New product launches
- 4.6.4 Expansion plans
Chapter 5 Market Estimates & Forecast, By Material Type, 2022 - 2035, (USD Billion) (Million Units)
- 5.1 Key trends
- 5.2 Paper
- 5.3 Bioplastics
- 5.4 Glass
- 5.5 Bamboo
- 5.6 Metal
Chapter 6 Market Estimates & Forecast, By Capacity, 2022 - 2035, (USD Billion) (Million Units)
- 6.1 Key trends
- 6.2 Up to 8 oz
- 6.3 9-16 oz
- 6.4 17-24 oz
- 6.5 Above 24 oz
Chapter 7 Market Estimates & Forecast, By Closure Type, 2022 - 2035, (USD Billion) (Million Units)
- 7.1 Key trends
- 7.2 Flat lids
- 7.3 Domed lids
- 7.4 Strawless lids
- 7.5 No lid (open-top)
Chapter 8 Market Estimates & Forecast, By Application, 2022 - 2035, (USD Billion) (Million Units)
- 8.1 Key trends
- 8.2 Hot beverages
- 8.3 Cold beverages
- 8.4 Food packaging
Chapter 9 Market Estimates & Forecast, By End-User, 2022 - 2035, (USD Billion) (Million Units)
- 9.1 Key trends
- 9.2 Food service
- 9.2.1 Restaurants
- 9.2.2 Cafes
- 9.2.3 Coffee chains
- 9.2.4 Quick service restaurants (QSRs)
- 9.3 Institutional
- 9.3.1 Schools
- 9.3.2 Universities
- 9.3.3 Hospitals
- 9.4 Retail
- 9.5 Household
Chapter 10 Market Estimates & Forecast, By Distribution Channel, 2022 - 2035, (USD Billion) (Million Units)
- 10.1 Key trends
- 10.2 Online
- 10.2.1 Company websites
- 10.2.2 E-commerce
- 10.3 Offline
- 10.3.1 Supermarkets/hypermarkets
- 10.3.2 Specialty stores
- 10.3.3 Others (foodservice suppliers etc.)
Chapter 11 Market Estimates & Forecast, By Region, 2022 - 2035, (USD Billion) (Million Units)
- 11.1 Key trends
- 11.2 North America
- 11.2.1 U.S.
- 11.2.2 Canada
- 11.3 Europe
- 11.3.1 Germany
- 11.3.2 UK
- 11.3.3 France
- 11.3.4 Italy
- 11.3.5 Spain
- 11.4 Asia Pacific
- 11.4.1 China
- 11.4.2 India
- 11.4.3 Japan
- 11.4.4 South Korea
- 11.4.5 Australia
- 11.4.6 Indonesia
- 11.4.7 Malaysia
- 11.5 Latin America
- 11.5.1 Brazil
- 11.5.2 Mexico
- 11.5.3 Argentina
- 11.6 MEA
- 11.6.1 Saudi Arabia
- 11.6.2 UAE
- 11.6.3 South Africa
Chapter 12 Company Profiles
- 12.1 Huhtamaki Oyj
- 12.2 Dart Container Corporation (Solo Cup)
- 12.3 Berry Global Group, Inc.
- 12.4 Pactiv Evergreen Inc.
- 12.5 Georgia-Pacific LLC (Koch Industries)
- 12.6 Graphic Packaging International
- 12.7 Stora Enso Oyj
- 12.8 Sabert Corporation
- 12.9 Greiner Packaging International GmbH
- 12.10 Lollicup USA Inc.
- 12.11 Eco-Products (Novatek International)
- 12.12 WinCup Holdings
- 12.13 Footprint
- 12.14 World Centric
- 12.15 BioPak Pty Ltd


