|
시장보고서
상품코드
1731900
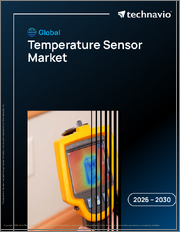
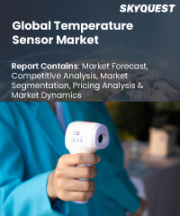
온도 탐지 화면 시장Temperature Detection Screens |
||||||
세계의 온도 탐지 화면 시장은 2030년까지 13억 달러에 달할 전망
2024년에 7억 540만 달러로 추정되는 세계의 온도 탐지 화면 시장은 2024-2030년에 CAGR 10.7%로 성장하며, 2030년에는 13억 달러에 달할 것으로 예측됩니다. 이 리포트에서 분석한 부문의 하나인 핸드헬드/휴대용 플랫폼은 CAGR 11.9%를 기록하며, 분석 기간 종료시에는 9억 1,870만 달러에 달할 것으로 예측됩니다. 스마트/고정 포지션 플랫폼 분야의 성장률은 분석 기간 중 CAGR 8.0%로 추정됩니다.
미국 시장은 추정 1억 9,220만 달러, 중국은 CAGR 14.7%로 성장 예측
미국의 온도 탐지 화면 시장은 2024년에 1억 9,220만 달러로 추정됩니다. 세계 2위의 경제대국인 중국은 분석 기간인 2024-2030년의 CAGR이 14.7%로, 2030년까지 2억 6,980만 달러의 시장 규모에 달할 것으로 예측됩니다. 기타 주목할 만한 지역별 시장으로는 일본과 캐나다가 있으며, 분석 기간 중 CAGR은 각각 7.6%와 9.5%로 예측됩니다. 유럽에서는 독일이 CAGR 약 8.4%로 성장할 것으로 예측됩니다.
세계의 온도 탐지 화면 시장 - 주요 동향과 촉진요인 정리
온도 감지 화면이 안전 보건 기술의 최전선으로 떠오르는 이유는 무엇인가?
실시간으로 체온을 측정하도록 설계된 비접촉식 디지털 시스템인 온도 감지 스크린은 공중 보건 모니터링 및 직장 안전 전략의 핵심 요소로 자리 잡고 있습니다. 전염병의 위협에 대응하기 위해 광범위하게 도입된 이 장비는 체온이 상승하는 개인을 신속하고 위생적이며 비침습적으로 식별할 수 있는 수단을 제공합니다. 대규모 인원을 효율적으로 검사할 수 있으며, 교통량이 많은 환경에서 선호되는 선택이 되고 있습니다.
이러한 시스템은 공항, 병원, 기업 캠퍼스, 학교, 소매 센터, 산업 현장 등에서 업무 흐름을 방해하지 않고 건강 모니터링 프로토콜을 지원하기 위해 점점 더 많이 사용되고 있습니다. 온도 감지 화면은 수작업에 의한 온도 점검을 줄이고 인적 오류를 최소화하여 위험 관리를 강화하고 건강 규정 준수를 보장합니다. 또한 물리적 출입 관리 시스템에 통합하여 자동화된 출입 제한을 가능하게 하여 민감한 인프라 및 공공시설의 바이오 보안을 강화할 수 있습니다.
AI 통합 및 열화상 기술은 어떻게 감지 정확도와 사용 편의성을 향상시킬 수 있는가?
첨단 온도 감지 화면에는 고해상도 적외선 센서, 적외선(IR) 카메라, 인공지능(AI) 알고리즘이 내장되어 있으며, 감지 정확도를 향상시키고 동적 환경에 적응할 수 있습니다. 이러한 기술을 통해 변동하는 주변 온도에서도 ±;0.3℃ 이내의 정확한 측정이 가능해졌습니다. 얼굴 인식과 AI 기반 보정을 통해 사람의 체온과 다른 열원을 구별하여 오경보를 최소화하고 사용자 처리량을 향상시킵니다.
터치리스 기능, 다중 사용자 감지 기능, 음성 안내 인터페이스는 빠르게 변화하는 환경에서의 사용 편의성을 더욱 향상시킵니다. 페이스 마스크 감지 및 자동 데이터 로깅 기능과의 통합은 공중 보건 모니터링에 대한 다층적 접근을 가능하게 합니다. 이러한 기능 강화로 인해 온도 감지 화면은 응급 헬스케어뿐만 아니라 장기적인 시설 관리, 산업 보건 및 기업급 안전 인프라에 대한 채택이 증가하고 있으며, 온도 감지 화면은 보다 광범위한 디지털 건강 생태계의 일부로 자리매김하고 있습니다.
온도 감지 스크린 수요를 촉진하는 최종사용자 분야와 배포 환경은?
기업 사무실, 의료 시설, 교통 기관, 교육 기관은 팬데믹 이후 안전한 재입국 및 업무 지속의 필요성으로 인해 온도 감지 스크린의 주요 개발처로 부상하고 있습니다. 이러한 시스템은 제조 및 물류 분야에서도 현장 근로자를 보호하고 엄격한 보건 의무에 따라 생산성을 유지하기 위해 사용되고 있습니다. 컴플라이언스 보고 및 산업 보건 프로토콜에서 이러한 시스템의 역할은 중요한 인프라 툴로 자리 매김하고 있습니다.
소매업과 접객업에서는 소비자의 신뢰를 회복하기 위해 이러한 시스템을 도입하여 눈에 보이는 안전 보장 및 출입구에서 실시간 모니터링을 제공합니다. 국방 시설, 정부 건물, 데이터센터와 같은 첨단 보안 구역에서는 생체인식 출입 시스템과 통합된 고급 모델을 채택하고 있습니다. 작업장 위생 보안에 대한 사회적 인식이 높아짐에 따라 공공 및 민간 부문 모두에서 작고 빠르게 배치할 수 있으며 다용도로 사용할 수 있는 선별 기술에 대한 수요가 증가하고 있습니다.
규제에 대한 기대, 프라이버시에 대한 우려, 비용에 대한 고려가 시장 역학을 어떻게 형성하고 있는가?
공중 보건 및 산업 안전 기관의 규제 지침은 특히 데이터 보존, 교정 정확도 및 윤리적 사용과 관련하여 온도 스크리닝을 수행하는 방법을 형성하고 있습니다. 이러한 시스템은 진단 툴은 아니지만, 특히 얼굴 인식 및 데이터 저장 기능과 결합된 경우 GDPR(EU 개인정보보호규정) 및 HIPAA와 같은 개인 정보 보호법에 따라 배치되어야 합니다. 조직은 공중보건 우선순위와 개인의 권리 및 투명성 사이에서 균형을 맞추어야 합니다.
특히 과도한 자본 지출 없이 스크리닝을 수행하고자 하는 중소기업의 경우, 저렴한 가격과 확장성 또한 중요한 고려사항입니다. 벤더들은 모듈형 제품, 클라우드 기반 분석 대시보드, 초기 비용을 절감하는 구독 기반 서비스 모델로 대응하고 있습니다. 시장은 단기적인 요구를 충족시키는 기본 플러그 앤 플레이 장비와 분석, 컴플라이언스 보고, 빌딩 관리 시스템과의 통합을 지원하는 기업급 솔루션으로 양분되고 있습니다.
온도 감지 스크린 시장의 성장을 가속하는 요인은 무엇인가?
온도 감지 스크린 시장은 조직이 비즈니스 연속성, 공공안전 및 규제 준수를 보장하기 위해 건강 모니터링 기술을 제도화함에 따라 성장하고 있습니다. 팬데믹 대비, 건강 인식 증가, 시설 관리의 디지털 혁신이 결합되면서 상시 및 비상 계획 프레임워크에서 이러한 시스템의 관련성이 강화되고 있으며, AI, 출입 통제 및 분석 플랫폼과의 통합은 열화상 검사 이상의 유용성을 제공합니다. 유용성을 높이고 있습니다.
앞으로의 성장은 공급업체들이 온도 감지 기술을 보다 광범위한 웰빙, 보안 및 운영 모니터링 목표를 지원하는 다목적 플랫폼으로 얼마나 발전시킬 수 있는지에 달려 있습니다. 이러한 시스템이 다양한 환경에서 확장 가능하고, 프라이버시를 보호하며, 다양한 환경에서 정밀한 솔루션을 제공할 수 있는지 여부가 사전 예방적 건강 모니터링과 스마트 시설 관리의 미래를 형성하는 데 있으며, 지속적인 영향력을 발휘할 수 있을 것입니다.
부문
플랫폼(핸드헬드/휴대용, 스마트/고정 위치), 테크놀러지(비접촉 적외선 테크놀러지, 적외선 영상 시스템), 애플리케이션(생체, 기기/기계, 기타 애플리케이션), 업계별(헬스케어·생명과학, 주택·상업 빌딩, 군·방위, 운송·물류, 발전, 석유 및 가스, 제조, 기타 업계)
조사 대상 기업의 예(총 48건)
- 3M Company
- AMETEK Land
- Axis Communications AB
- BAE Systems plc
- Cadi Scientific Pte Ltd
- Dahua Technology Co., Ltd.
- D-Link Corporation
- Emerson Electric Co.
- Exergen Corporation
- Fluke Corporation
- FLIR Systems, Inc.
- Honeywell International Inc.
- Leonardo S.p.A.
- L3Harris Technologies, Inc.
- NEC Corporation
- Opgal Optronic Industries Ltd.
- OptoTherm, Inc.
- Raytheon Technologies Corp.
- Seek Thermal, Inc.
- Thermoteknix Systems Ltd
관세 영향 계수
Global Industry Analysts는 본사의 국가, 제조거점, 수출입(완제품 및 OEM)을 기반으로 기업의 경쟁력 변화를 예측했습니다. 이러한 복잡하고 다면적인 시장 역학은 인위적인 수입원가 증가, 수익성 감소, 공급망 재편 등 미시적 및 거시적 시장 역학 중에서도 특히 경쟁사들에게 영향을 미칠 것으로 예측됩니다.
Global Industry Analysts는 세계 주요 수석 이코노미스트(1,4,949명), 싱크탱크(62개 기관), 무역 및 산업 단체(171개 기관)의 전문가들의 의견을 면밀히 검토하여 생태계에 미치는 영향을 평가하고 새로운 시장 현실에 대응하고 있습니다. 모든 주요 국가의 전문가와 경제학자들이 관세와 그것이 자국에 미치는 영향에 대한 의견을 추적 조사했습니다.
Global Industry Analysts는 이러한 혼란이 향후 2-3개월 내에 마무리되고 새로운 세계 질서가 보다 명확하게 확립될 것으로 예상하고 있으며, Global Industry Analysts는 이러한 상황을 실시간으로 추적하고 있습니다.
2025년 4월: 협상 단계
이번 4월 보고서에서는 관세가 세계 시장 전체에 미치는 영향과 지역별 시장 조정에 대해 소개합니다. 당사의 예측은 과거 데이터와 진화하는 시장 영향요인을 기반으로 합니다.
2025년 7월: 최종 관세 재설정
무료 업데이트 각국의 최종 리셋이 발표된 후, 7월에 무료 업데이트 버전을 고객님들께 제공해 드립니다. 최종 업데이트 버전에는 명확하게 정의된 관세 영향 분석이 포함되어 있습니다.
상호 및 양자 간 무역과 관세의 영향 분석 :
미국 <gt; 중국 <gt; 멕시코 <gt; 캐나다 <gt;EU <gt; 일본 <gt; 인도 <gt; 기타 176개국
업계 최고의 이코노미스트: Global Industry Analysts의 지식 기반은 국가, 싱크탱크, 무역 및 산업 단체, 대기업, 그리고 세계 계량 경제 상황의 전례 없는 패러다임 전환의 영향을 공유하는 분야별 전문가 등 가장 영향력 있는 수석 이코노미스트를 포함한 14,949명의 이코노미스트를 추적하고 있습니다. 16,491개 이상의 보고서 대부분에 마일스톤에 기반한 2단계 출시 일정이 적용되어 있습니다.
목차
제1장 조사 방법
제2장 개요
- 시장 개요
- 주요 기업
- 시장 동향과 촉진요인
- 세계 시장 전망
제3장 시장 분석
- 미국
- 캐나다
- 일본
- 중국
- 유럽
- 프랑스
- 독일
- 이탈리아
- 영국
- 스페인
- 러시아
- 기타 유럽
- 아시아태평양
- 호주
- 인도
- 한국
- 기타 아시아태평양
- 라틴아메리카
- 아르헨티나
- 브라질
- 멕시코
- 기타 라틴아메리카
- 중동
- 이란
- 이스라엘
- 사우디아라비아
- 아랍에미리트
- 기타 중동
- 아프리카
제4장 경쟁
KSA 25.06.09Global Temperature Detection Screens Market to Reach US$1.3 Billion by 2030
The global market for Temperature Detection Screens estimated at US$705.4 Million in the year 2024, is expected to reach US$1.3 Billion by 2030, growing at a CAGR of 10.7% over the analysis period 2024-2030. Handheld / Portable Platform, one of the segments analyzed in the report, is expected to record a 11.9% CAGR and reach US$918.7 Million by the end of the analysis period. Growth in the Smart / Fixed Position Platform segment is estimated at 8.0% CAGR over the analysis period.
The U.S. Market is Estimated at US$192.2 Million While China is Forecast to Grow at 14.7% CAGR
The Temperature Detection Screens market in the U.S. is estimated at US$192.2 Million in the year 2024. China, the world's second largest economy, is forecast to reach a projected market size of US$269.8 Million by the year 2030 trailing a CAGR of 14.7% over the analysis period 2024-2030. Among the other noteworthy geographic markets are Japan and Canada, each forecast to grow at a CAGR of 7.6% and 9.5% respectively over the analysis period. Within Europe, Germany is forecast to grow at approximately 8.4% CAGR.
Global Temperature Detection Screens Market - Key Trends & Drivers Summarized
Why Are Temperature Detection Screens Gaining Ground as a Frontline Health and Safety Technology?
Temperature detection screens-non-contact digital systems designed to measure body temperature in real time-have become a critical component of public health surveillance and workplace safety strategies. Deployed widely in response to pandemic threats, these devices offer a rapid, hygienic, and non-invasive means of identifying individuals with elevated body temperatures, which can indicate underlying infection or illness. Their utility in screening large groups efficiently has made them a preferred option in high-traffic environments.
These systems are increasingly used at airports, hospitals, corporate campuses, schools, retail centers, and industrial sites to support health monitoring protocols without disrupting operational flow. By reducing reliance on manual temperature checks and minimizing human error, temperature detection screens enhance risk management and ensure compliance with health regulations. Their integration into physical access control systems also enables automated entry restrictions, strengthening biosecurity across sensitive infrastructure and public facilities.
How Are AI Integration and Thermal Imaging Technologies Improving Detection Accuracy and Usability?
Advanced temperature detection screens now incorporate high-resolution thermal imaging sensors, infrared (IR) cameras, and artificial intelligence (AI) algorithms to improve detection precision and adapt to dynamic environments. These technologies enable accurate measurement within ±0.3°C, even in fluctuating ambient temperatures. Facial recognition and AI-based calibration help distinguish between human body heat and other heat sources, minimizing false alarms and enhancing user throughput.
Touchless functionality, multi-person detection capabilities, and voice guidance interfaces further improve usability in fast-paced settings. Integration with facial mask detection and automatic data logging functions provides a multi-layered approach to public health monitoring. These enhancements are driving adoption beyond emergency health situations toward long-term facility management, occupational health, and enterprise-grade safety infrastructure-positioning temperature detection screens as part of the broader digital health ecosystem.
Which End-Use Sectors and Deployment Environments Are Fueling Demand for Temperature Detection Screens?
Corporate offices, healthcare facilities, transportation hubs, and educational institutions have emerged as primary adopters of temperature detection screens, driven by the need to ensure safe reentry and operational continuity post-pandemic. These systems are also being used in the manufacturing and logistics sectors to safeguard frontline workforces and maintain productivity under stringent health mandates. Their role in compliance reporting and occupational health protocols is reinforcing their position as critical infrastructure tools.
Retail and hospitality environments are increasingly deploying these systems to restore consumer confidence, offering visible safety assurance and real-time monitoring at entrances. High-security zones such as defense installations, government buildings, and data centers are adopting more advanced models integrated with biometric access systems. As public awareness of workplace health security grows, demand for compact, rapid-deployment, and multi-use screening technologies is gaining momentum across both public and private sectors.
How Are Regulatory Expectations, Privacy Concerns, and Cost Considerations Shaping Market Dynamics?
Regulatory guidance from public health agencies and occupational safety bodies is shaping how temperature screening is implemented, particularly regarding data retention, calibration accuracy, and ethical usage. While these systems are not diagnostic tools, their deployment must align with privacy laws such as GDPR or HIPAA, especially when combined with facial recognition or data storage features. Organizations must balance public health priorities with individual rights and transparency.
Affordability and scalability are also major considerations, especially for small and mid-sized enterprises looking to implement screening without excessive capital expenditure. Vendors are responding with modular product offerings, cloud-based analytics dashboards, and subscription-based service models that reduce upfront costs. The market is seeing a bifurcation between basic plug-and-play devices for short-term needs and enterprise-grade solutions that support analytics, compliance reporting, and integration with building management systems.
What Are the Factors Driving Growth in the Temperature Detection Screens Market?
The temperature detection screens market is growing as organizations institutionalize health monitoring technologies to ensure business continuity, public safety, and regulatory adherence. The confluence of pandemic preparedness, rising health awareness, and digital transformation of facility management is reinforcing the relevance of these systems in both permanent and contingency planning frameworks. Their integration with AI, access control, and analytics platforms enhances their utility beyond thermal screening.
Looking ahead, growth will depend on how well suppliers can evolve temperature detection technologies into multipurpose platforms supporting broader wellness, security, and operational monitoring goals. Whether these systems can deliver scalable, privacy-compliant, and high-accuracy solutions across diverse settings will determine their lasting impact in shaping the future of proactive health surveillance and smart facility management.
SCOPE OF STUDY:
The report analyzes the Temperature Detection Screens market in terms of units by the following Segments, and Geographic Regions/Countries:
Segments:
Platform (Handheld / Portable, Smart / Fixed Position); Technology (Non-Contact Infrared Technology, Thermal Imaging Systems); Application (Living Beings, Equipment / Machines, Other Applications); Vertical (Healthcare & Life Sciences, Residential & Commercial Buildings, Military & Defense, Transportation & Logistics, Power Generation, Oil & Gas, Manufacturing, Other Verticals)
Geographic Regions/Countries:
World; United States; Canada; Japan; China; Europe (France; Germany; Italy; United Kingdom; Spain; Russia; and Rest of Europe); Asia-Pacific (Australia; India; South Korea; and Rest of Asia-Pacific); Latin America (Argentina; Brazil; Mexico; and Rest of Latin America); Middle East (Iran; Israel; Saudi Arabia; United Arab Emirates; and Rest of Middle East); and Africa.
Select Competitors (Total 48 Featured) -
- 3M Company
- AMETEK Land
- Axis Communications AB
- BAE Systems plc
- Cadi Scientific Pte Ltd
- Dahua Technology Co., Ltd.
- D-Link Corporation
- Emerson Electric Co.
- Exergen Corporation
- Fluke Corporation
- FLIR Systems, Inc.
- Honeywell International Inc.
- Leonardo S.p.A.
- L3Harris Technologies, Inc.
- NEC Corporation
- Opgal Optronic Industries Ltd.
- OptoTherm, Inc.
- Raytheon Technologies Corp.
- Seek Thermal, Inc.
- Thermoteknix Systems Ltd
TARIFF IMPACT FACTOR
Our new release incorporates impact of tariffs on geographical markets as we predict a shift in competitiveness of companies based on HQ country, manufacturing base, exports and imports (finished goods and OEM). This intricate and multifaceted market reality will impact competitors by artificially increasing the COGS, reducing profitability, reconfiguring supply chains, amongst other micro and macro market dynamics.
We are diligently following expert opinions of leading Chief Economists (14,949), Think Tanks (62), Trade & Industry bodies (171) worldwide, as they assess impact and address new market realities for their ecosystems. Experts and economists from every major country are tracked for their opinions on tariffs and how they will impact their countries.
We expect this chaos to play out over the next 2-3 months and a new world order is established with more clarity. We are tracking these developments on a real time basis.
As we release this report, U.S. Trade Representatives are pushing their counterparts in 183 countries for an early closure to bilateral tariff negotiations. Most of the major trading partners also have initiated trade agreements with other key trading nations, outside of those in the works with the United States. We are tracking such secondary fallouts as supply chains shift.
To our valued clients, we say, we have your back. We will present a simplified market reassessment by incorporating these changes!
APRIL 2025: NEGOTIATION PHASE
Our April release addresses the impact of tariffs on the overall global market and presents market adjustments by geography. Our trajectories are based on historic data and evolving market impacting factors.
JULY 2025 FINAL TARIFF RESET
Complimentary Update: Our clients will also receive a complimentary update in July after a final reset is announced between nations. The final updated version incorporates clearly defined Tariff Impact Analyses.
Reciprocal and Bilateral Trade & Tariff Impact Analyses:
USA <> CHINA <> MEXICO <> CANADA <> EU <> JAPAN <> INDIA <> 176 OTHER COUNTRIES.
Leading Economists - Our knowledge base tracks 14,949 economists including a select group of most influential Chief Economists of nations, think tanks, trade and industry bodies, big enterprises, and domain experts who are sharing views on the fallout of this unprecedented paradigm shift in the global econometric landscape. Most of our 16,491+ reports have incorporated this two-stage release schedule based on milestones.
COMPLIMENTARY PREVIEW
Contact your sales agent to request an online 300+ page complimentary preview of this research project. Our preview will present full stack sources, and validated domain expert data transcripts. Deep dive into our interactive data-driven online platform.
TABLE OF CONTENTS
I. METHODOLOGY
II. EXECUTIVE SUMMARY
- 1. MARKET OVERVIEW
- Influencer Market Insights
- World Market Trajectories
- Temperature Detection Screens - Global Key Competitors Percentage Market Share in 2025 (E)
- Competitive Market Presence - Strong/Active/Niche/Trivial for Players Worldwide in 2025 (E)
- 2. FOCUS ON SELECT PLAYERS
- 3. MARKET TRENDS & DRIVERS
- Public Health Protocols and Workplace Safety Standards Sustain Use of Temperature Detection Screens
- IR Thermography and Facial Recognition Integration Enable Contactless, High-Volume Screening
- OEMs Enhance Accuracy With AI Algorithms and Environmental Compensation Technology
- Deployments Expand Beyond Healthcare to Education, Manufacturing, and Transportation Hubs
- Kiosk-Based and Wall-Mount Models Cater to Facility Entry Points With High Footfall
- Integration With Access Control, Visitor Management, and Attendance Systems Adds Value
- Growing Use in Events, Hospitality, and Retail for Passive Wellness Monitoring
- Product Innovation Focuses on Multi-Person Scanning and Real-Time Alert Systems
- Global Surveillance Infrastructure Investments Strengthen Temperature Screening Ecosystem
- Data Privacy Regulations Influence UI Design and Thermal Image Storage Policies
- 4. GLOBAL MARKET PERSPECTIVE
- TABLE 1: World Temperature Detection Screens Market Analysis of Annual Sales in US$ Thousand for Years 2015 through 2030
- TABLE 2: World Recent Past, Current & Future Analysis for Temperature Detection Screens by Geographic Region - USA, Canada, Japan, China, Europe, Asia-Pacific, Latin America, Middle East and Africa Markets - Independent Analysis of Annual Sales in US$ Thousand for Years 2024 through 2030 and % CAGR
- TABLE 3: World Historic Review for Temperature Detection Screens by Geographic Region - USA, Canada, Japan, China, Europe, Asia-Pacific, Latin America, Middle East and Africa Markets - Independent Analysis of Annual Sales in US$ Thousand for Years 2015 through 2023 and % CAGR
- TABLE 4: World 15-Year Perspective for Temperature Detection Screens by Geographic Region - Percentage Breakdown of Value Sales for USA, Canada, Japan, China, Europe, Asia-Pacific, Latin America, Middle East and Africa Markets for Years 2015, 2025 & 2030
- TABLE 5: World Recent Past, Current & Future Analysis for Handheld / Portable by Geographic Region - USA, Canada, Japan, China, Europe, Asia-Pacific, Latin America, Middle East and Africa Markets - Independent Analysis of Annual Sales in US$ Thousand for Years 2024 through 2030 and % CAGR
- TABLE 6: World Historic Review for Handheld / Portable by Geographic Region - USA, Canada, Japan, China, Europe, Asia-Pacific, Latin America, Middle East and Africa Markets - Independent Analysis of Annual Sales in US$ Thousand for Years 2015 through 2023 and % CAGR
- TABLE 7: World 15-Year Perspective for Handheld / Portable by Geographic Region - Percentage Breakdown of Value Sales for USA, Canada, Japan, China, Europe, Asia-Pacific, Latin America, Middle East and Africa for Years 2015, 2025 & 2030
- TABLE 8: World Recent Past, Current & Future Analysis for Smart / Fixed Position by Geographic Region - USA, Canada, Japan, China, Europe, Asia-Pacific, Latin America, Middle East and Africa Markets - Independent Analysis of Annual Sales in US$ Thousand for Years 2024 through 2030 and % CAGR
- TABLE 9: World Historic Review for Smart / Fixed Position by Geographic Region - USA, Canada, Japan, China, Europe, Asia-Pacific, Latin America, Middle East and Africa Markets - Independent Analysis of Annual Sales in US$ Thousand for Years 2015 through 2023 and % CAGR
- TABLE 10: World 15-Year Perspective for Smart / Fixed Position by Geographic Region - Percentage Breakdown of Value Sales for USA, Canada, Japan, China, Europe, Asia-Pacific, Latin America, Middle East and Africa for Years 2015, 2025 & 2030
- TABLE 11: World Recent Past, Current & Future Analysis for Military & Defense by Geographic Region - USA, Canada, Japan, China, Europe, Asia-Pacific, Latin America, Middle East and Africa Markets - Independent Analysis of Annual Sales in US$ Thousand for Years 2024 through 2030 and % CAGR
- TABLE 12: World Historic Review for Military & Defense by Geographic Region - USA, Canada, Japan, China, Europe, Asia-Pacific, Latin America, Middle East and Africa Markets - Independent Analysis of Annual Sales in US$ Thousand for Years 2015 through 2023 and % CAGR
- TABLE 13: World 15-Year Perspective for Military & Defense by Geographic Region - Percentage Breakdown of Value Sales for USA, Canada, Japan, China, Europe, Asia-Pacific, Latin America, Middle East and Africa for Years 2015, 2025 & 2030
- TABLE 14: World Recent Past, Current & Future Analysis for Transportation & Logistics by Geographic Region - USA, Canada, Japan, China, Europe, Asia-Pacific, Latin America, Middle East and Africa Markets - Independent Analysis of Annual Sales in US$ Thousand for Years 2024 through 2030 and % CAGR
- TABLE 15: World Historic Review for Transportation & Logistics by Geographic Region - USA, Canada, Japan, China, Europe, Asia-Pacific, Latin America, Middle East and Africa Markets - Independent Analysis of Annual Sales in US$ Thousand for Years 2015 through 2023 and % CAGR
- TABLE 16: World 15-Year Perspective for Transportation & Logistics by Geographic Region - Percentage Breakdown of Value Sales for USA, Canada, Japan, China, Europe, Asia-Pacific, Latin America, Middle East and Africa for Years 2015, 2025 & 2030
- TABLE 17: World Recent Past, Current & Future Analysis for Power Generation by Geographic Region - USA, Canada, Japan, China, Europe, Asia-Pacific, Latin America, Middle East and Africa Markets - Independent Analysis of Annual Sales in US$ Thousand for Years 2024 through 2030 and % CAGR
- TABLE 18: World Historic Review for Power Generation by Geographic Region - USA, Canada, Japan, China, Europe, Asia-Pacific, Latin America, Middle East and Africa Markets - Independent Analysis of Annual Sales in US$ Thousand for Years 2015 through 2023 and % CAGR
- TABLE 19: World 15-Year Perspective for Power Generation by Geographic Region - Percentage Breakdown of Value Sales for USA, Canada, Japan, China, Europe, Asia-Pacific, Latin America, Middle East and Africa for Years 2015, 2025 & 2030
- TABLE 20: World Recent Past, Current & Future Analysis for Oil & Gas by Geographic Region - USA, Canada, Japan, China, Europe, Asia-Pacific, Latin America, Middle East and Africa Markets - Independent Analysis of Annual Sales in US$ Thousand for Years 2024 through 2030 and % CAGR
- TABLE 21: World Historic Review for Oil & Gas by Geographic Region - USA, Canada, Japan, China, Europe, Asia-Pacific, Latin America, Middle East and Africa Markets - Independent Analysis of Annual Sales in US$ Thousand for Years 2015 through 2023 and % CAGR
- TABLE 22: World 15-Year Perspective for Oil & Gas by Geographic Region - Percentage Breakdown of Value Sales for USA, Canada, Japan, China, Europe, Asia-Pacific, Latin America, Middle East and Africa for Years 2015, 2025 & 2030
- TABLE 23: World Recent Past, Current & Future Analysis for Manufacturing by Geographic Region - USA, Canada, Japan, China, Europe, Asia-Pacific, Latin America, Middle East and Africa Markets - Independent Analysis of Annual Sales in US$ Thousand for Years 2024 through 2030 and % CAGR
- TABLE 24: World Historic Review for Manufacturing by Geographic Region - USA, Canada, Japan, China, Europe, Asia-Pacific, Latin America, Middle East and Africa Markets - Independent Analysis of Annual Sales in US$ Thousand for Years 2015 through 2023 and % CAGR
- TABLE 25: World 15-Year Perspective for Manufacturing by Geographic Region - Percentage Breakdown of Value Sales for USA, Canada, Japan, China, Europe, Asia-Pacific, Latin America, Middle East and Africa for Years 2015, 2025 & 2030
- TABLE 26: World Recent Past, Current & Future Analysis for Other Verticals by Geographic Region - USA, Canada, Japan, China, Europe, Asia-Pacific, Latin America, Middle East and Africa Markets - Independent Analysis of Annual Sales in US$ Thousand for Years 2024 through 2030 and % CAGR
- TABLE 27: World Historic Review for Other Verticals by Geographic Region - USA, Canada, Japan, China, Europe, Asia-Pacific, Latin America, Middle East and Africa Markets - Independent Analysis of Annual Sales in US$ Thousand for Years 2015 through 2023 and % CAGR
- TABLE 28: World 15-Year Perspective for Other Verticals by Geographic Region - Percentage Breakdown of Value Sales for USA, Canada, Japan, China, Europe, Asia-Pacific, Latin America, Middle East and Africa for Years 2015, 2025 & 2030
- TABLE 29: World Recent Past, Current & Future Analysis for Healthcare & Life Sciences by Geographic Region - USA, Canada, Japan, China, Europe, Asia-Pacific, Latin America, Middle East and Africa Markets - Independent Analysis of Annual Sales in US$ Thousand for Years 2024 through 2030 and % CAGR
- TABLE 30: World Historic Review for Healthcare & Life Sciences by Geographic Region - USA, Canada, Japan, China, Europe, Asia-Pacific, Latin America, Middle East and Africa Markets - Independent Analysis of Annual Sales in US$ Thousand for Years 2015 through 2023 and % CAGR
- TABLE 31: World 15-Year Perspective for Healthcare & Life Sciences by Geographic Region - Percentage Breakdown of Value Sales for USA, Canada, Japan, China, Europe, Asia-Pacific, Latin America, Middle East and Africa for Years 2015, 2025 & 2030
- TABLE 32: World Recent Past, Current & Future Analysis for Residential & Commercial Buildings by Geographic Region - USA, Canada, Japan, China, Europe, Asia-Pacific, Latin America, Middle East and Africa Markets - Independent Analysis of Annual Sales in US$ Thousand for Years 2024 through 2030 and % CAGR
- TABLE 33: World Historic Review for Residential & Commercial Buildings by Geographic Region - USA, Canada, Japan, China, Europe, Asia-Pacific, Latin America, Middle East and Africa Markets - Independent Analysis of Annual Sales in US$ Thousand for Years 2015 through 2023 and % CAGR
- TABLE 34: World 15-Year Perspective for Residential & Commercial Buildings by Geographic Region - Percentage Breakdown of Value Sales for USA, Canada, Japan, China, Europe, Asia-Pacific, Latin America, Middle East and Africa for Years 2015, 2025 & 2030
- TABLE 35: World Recent Past, Current & Future Analysis for Non-Contact Infrared Technology by Geographic Region - USA, Canada, Japan, China, Europe, Asia-Pacific, Latin America, Middle East and Africa Markets - Independent Analysis of Annual Sales in US$ Thousand for Years 2024 through 2030 and % CAGR
- TABLE 36: World Historic Review for Non-Contact Infrared Technology by Geographic Region - USA, Canada, Japan, China, Europe, Asia-Pacific, Latin America, Middle East and Africa Markets - Independent Analysis of Annual Sales in US$ Thousand for Years 2015 through 2023 and % CAGR
- TABLE 37: World 15-Year Perspective for Non-Contact Infrared Technology by Geographic Region - Percentage Breakdown of Value Sales for USA, Canada, Japan, China, Europe, Asia-Pacific, Latin America, Middle East and Africa for Years 2015, 2025 & 2030
- TABLE 38: World Recent Past, Current & Future Analysis for Thermal Imaging Systems by Geographic Region - USA, Canada, Japan, China, Europe, Asia-Pacific, Latin America, Middle East and Africa Markets - Independent Analysis of Annual Sales in US$ Thousand for Years 2024 through 2030 and % CAGR
- TABLE 39: World Historic Review for Thermal Imaging Systems by Geographic Region - USA, Canada, Japan, China, Europe, Asia-Pacific, Latin America, Middle East and Africa Markets - Independent Analysis of Annual Sales in US$ Thousand for Years 2015 through 2023 and % CAGR
- TABLE 40: World 15-Year Perspective for Thermal Imaging Systems by Geographic Region - Percentage Breakdown of Value Sales for USA, Canada, Japan, China, Europe, Asia-Pacific, Latin America, Middle East and Africa for Years 2015, 2025 & 2030
- TABLE 41: World Recent Past, Current & Future Analysis for Living Beings by Geographic Region - USA, Canada, Japan, China, Europe, Asia-Pacific, Latin America, Middle East and Africa Markets - Independent Analysis of Annual Sales in US$ Thousand for Years 2024 through 2030 and % CAGR
- TABLE 42: World Historic Review for Living Beings by Geographic Region - USA, Canada, Japan, China, Europe, Asia-Pacific, Latin America, Middle East and Africa Markets - Independent Analysis of Annual Sales in US$ Thousand for Years 2015 through 2023 and % CAGR
- TABLE 43: World 15-Year Perspective for Living Beings by Geographic Region - Percentage Breakdown of Value Sales for USA, Canada, Japan, China, Europe, Asia-Pacific, Latin America, Middle East and Africa for Years 2015, 2025 & 2030
- TABLE 44: World Recent Past, Current & Future Analysis for Equipment / Machines by Geographic Region - USA, Canada, Japan, China, Europe, Asia-Pacific, Latin America, Middle East and Africa Markets - Independent Analysis of Annual Sales in US$ Thousand for Years 2024 through 2030 and % CAGR
- TABLE 45: World Historic Review for Equipment / Machines by Geographic Region - USA, Canada, Japan, China, Europe, Asia-Pacific, Latin America, Middle East and Africa Markets - Independent Analysis of Annual Sales in US$ Thousand for Years 2015 through 2023 and % CAGR
- TABLE 46: World 15-Year Perspective for Equipment / Machines by Geographic Region - Percentage Breakdown of Value Sales for USA, Canada, Japan, China, Europe, Asia-Pacific, Latin America, Middle East and Africa for Years 2015, 2025 & 2030
- TABLE 47: World Recent Past, Current & Future Analysis for Other Applications by Geographic Region - USA, Canada, Japan, China, Europe, Asia-Pacific, Latin America, Middle East and Africa Markets - Independent Analysis of Annual Sales in US$ Thousand for Years 2024 through 2030 and % CAGR
- TABLE 48: World Historic Review for Other Applications by Geographic Region - USA, Canada, Japan, China, Europe, Asia-Pacific, Latin America, Middle East and Africa Markets - Independent Analysis of Annual Sales in US$ Thousand for Years 2015 through 2023 and % CAGR
- TABLE 49: World 15-Year Perspective for Other Applications by Geographic Region - Percentage Breakdown of Value Sales for USA, Canada, Japan, China, Europe, Asia-Pacific, Latin America, Middle East and Africa for Years 2015, 2025 & 2030
III. MARKET ANALYSIS
- UNITED STATES
- Temperature Detection Screens Market Presence - Strong/Active/Niche/Trivial - Key Competitors in the United States for 2025 (E)
- TABLE 50: USA Recent Past, Current & Future Analysis for Temperature Detection Screens by Platform - Handheld / Portable and Smart / Fixed Position - Independent Analysis of Annual Sales in US$ Thousand for the Years 2024 through 2030 and % CAGR
- TABLE 51: USA Historic Review for Temperature Detection Screens by Platform - Handheld / Portable and Smart / Fixed Position Markets - Independent Analysis of Annual Sales in US$ Thousand for Years 2015 through 2023 and % CAGR
- TABLE 52: USA 15-Year Perspective for Temperature Detection Screens by Platform - Percentage Breakdown of Value Sales for Handheld / Portable and Smart / Fixed Position for the Years 2015, 2025 & 2030
- TABLE 53: USA Recent Past, Current & Future Analysis for Temperature Detection Screens by Vertical - Military & Defense, Transportation & Logistics, Power Generation, Oil & Gas, Manufacturing, Other Verticals, Healthcare & Life Sciences and Residential & Commercial Buildings - Independent Analysis of Annual Sales in US$ Thousand for the Years 2024 through 2030 and % CAGR
- TABLE 54: USA Historic Review for Temperature Detection Screens by Vertical - Military & Defense, Transportation & Logistics, Power Generation, Oil & Gas, Manufacturing, Other Verticals, Healthcare & Life Sciences and Residential & Commercial Buildings Markets - Independent Analysis of Annual Sales in US$ Thousand for Years 2015 through 2023 and % CAGR
- TABLE 55: USA 15-Year Perspective for Temperature Detection Screens by Vertical - Percentage Breakdown of Value Sales for Military & Defense, Transportation & Logistics, Power Generation, Oil & Gas, Manufacturing, Other Verticals, Healthcare & Life Sciences and Residential & Commercial Buildings for the Years 2015, 2025 & 2030
- TABLE 56: USA Recent Past, Current & Future Analysis for Temperature Detection Screens by Technology - Non-Contact Infrared Technology and Thermal Imaging Systems - Independent Analysis of Annual Sales in US$ Thousand for the Years 2024 through 2030 and % CAGR
- TABLE 57: USA Historic Review for Temperature Detection Screens by Technology - Non-Contact Infrared Technology and Thermal Imaging Systems Markets - Independent Analysis of Annual Sales in US$ Thousand for Years 2015 through 2023 and % CAGR
- TABLE 58: USA 15-Year Perspective for Temperature Detection Screens by Technology - Percentage Breakdown of Value Sales for Non-Contact Infrared Technology and Thermal Imaging Systems for the Years 2015, 2025 & 2030
- TABLE 59: USA Recent Past, Current & Future Analysis for Temperature Detection Screens by Application - Living Beings, Equipment / Machines and Other Applications - Independent Analysis of Annual Sales in US$ Thousand for the Years 2024 through 2030 and % CAGR
- TABLE 60: USA Historic Review for Temperature Detection Screens by Application - Living Beings, Equipment / Machines and Other Applications Markets - Independent Analysis of Annual Sales in US$ Thousand for Years 2015 through 2023 and % CAGR
- TABLE 61: USA 15-Year Perspective for Temperature Detection Screens by Application - Percentage Breakdown of Value Sales for Living Beings, Equipment / Machines and Other Applications for the Years 2015, 2025 & 2030
- CANADA
- TABLE 62: Canada Recent Past, Current & Future Analysis for Temperature Detection Screens by Platform - Handheld / Portable and Smart / Fixed Position - Independent Analysis of Annual Sales in US$ Thousand for the Years 2024 through 2030 and % CAGR
- TABLE 63: Canada Historic Review for Temperature Detection Screens by Platform - Handheld / Portable and Smart / Fixed Position Markets - Independent Analysis of Annual Sales in US$ Thousand for Years 2015 through 2023 and % CAGR
- TABLE 64: Canada 15-Year Perspective for Temperature Detection Screens by Platform - Percentage Breakdown of Value Sales for Handheld / Portable and Smart / Fixed Position for the Years 2015, 2025 & 2030
- TABLE 65: Canada Recent Past, Current & Future Analysis for Temperature Detection Screens by Vertical - Military & Defense, Transportation & Logistics, Power Generation, Oil & Gas, Manufacturing, Other Verticals, Healthcare & Life Sciences and Residential & Commercial Buildings - Independent Analysis of Annual Sales in US$ Thousand for the Years 2024 through 2030 and % CAGR
- TABLE 66: Canada Historic Review for Temperature Detection Screens by Vertical - Military & Defense, Transportation & Logistics, Power Generation, Oil & Gas, Manufacturing, Other Verticals, Healthcare & Life Sciences and Residential & Commercial Buildings Markets - Independent Analysis of Annual Sales in US$ Thousand for Years 2015 through 2023 and % CAGR
- TABLE 67: Canada 15-Year Perspective for Temperature Detection Screens by Vertical - Percentage Breakdown of Value Sales for Military & Defense, Transportation & Logistics, Power Generation, Oil & Gas, Manufacturing, Other Verticals, Healthcare & Life Sciences and Residential & Commercial Buildings for the Years 2015, 2025 & 2030
- TABLE 68: Canada Recent Past, Current & Future Analysis for Temperature Detection Screens by Technology - Non-Contact Infrared Technology and Thermal Imaging Systems - Independent Analysis of Annual Sales in US$ Thousand for the Years 2024 through 2030 and % CAGR
- TABLE 69: Canada Historic Review for Temperature Detection Screens by Technology - Non-Contact Infrared Technology and Thermal Imaging Systems Markets - Independent Analysis of Annual Sales in US$ Thousand for Years 2015 through 2023 and % CAGR
- TABLE 70: Canada 15-Year Perspective for Temperature Detection Screens by Technology - Percentage Breakdown of Value Sales for Non-Contact Infrared Technology and Thermal Imaging Systems for the Years 2015, 2025 & 2030
- TABLE 71: Canada Recent Past, Current & Future Analysis for Temperature Detection Screens by Application - Living Beings, Equipment / Machines and Other Applications - Independent Analysis of Annual Sales in US$ Thousand for the Years 2024 through 2030 and % CAGR
- TABLE 72: Canada Historic Review for Temperature Detection Screens by Application - Living Beings, Equipment / Machines and Other Applications Markets - Independent Analysis of Annual Sales in US$ Thousand for Years 2015 through 2023 and % CAGR
- TABLE 73: Canada 15-Year Perspective for Temperature Detection Screens by Application - Percentage Breakdown of Value Sales for Living Beings, Equipment / Machines and Other Applications for the Years 2015, 2025 & 2030
- JAPAN
- Temperature Detection Screens Market Presence - Strong/Active/Niche/Trivial - Key Competitors in Japan for 2025 (E)
- TABLE 74: Japan Recent Past, Current & Future Analysis for Temperature Detection Screens by Platform - Handheld / Portable and Smart / Fixed Position - Independent Analysis of Annual Sales in US$ Thousand for the Years 2024 through 2030 and % CAGR
- TABLE 75: Japan Historic Review for Temperature Detection Screens by Platform - Handheld / Portable and Smart / Fixed Position Markets - Independent Analysis of Annual Sales in US$ Thousand for Years 2015 through 2023 and % CAGR
- TABLE 76: Japan 15-Year Perspective for Temperature Detection Screens by Platform - Percentage Breakdown of Value Sales for Handheld / Portable and Smart / Fixed Position for the Years 2015, 2025 & 2030
- TABLE 77: Japan Recent Past, Current & Future Analysis for Temperature Detection Screens by Vertical - Military & Defense, Transportation & Logistics, Power Generation, Oil & Gas, Manufacturing, Other Verticals, Healthcare & Life Sciences and Residential & Commercial Buildings - Independent Analysis of Annual Sales in US$ Thousand for the Years 2024 through 2030 and % CAGR
- TABLE 78: Japan Historic Review for Temperature Detection Screens by Vertical - Military & Defense, Transportation & Logistics, Power Generation, Oil & Gas, Manufacturing, Other Verticals, Healthcare & Life Sciences and Residential & Commercial Buildings Markets - Independent Analysis of Annual Sales in US$ Thousand for Years 2015 through 2023 and % CAGR
- TABLE 79: Japan 15-Year Perspective for Temperature Detection Screens by Vertical - Percentage Breakdown of Value Sales for Military & Defense, Transportation & Logistics, Power Generation, Oil & Gas, Manufacturing, Other Verticals, Healthcare & Life Sciences and Residential & Commercial Buildings for the Years 2015, 2025 & 2030
- TABLE 80: Japan Recent Past, Current & Future Analysis for Temperature Detection Screens by Technology - Non-Contact Infrared Technology and Thermal Imaging Systems - Independent Analysis of Annual Sales in US$ Thousand for the Years 2024 through 2030 and % CAGR
- TABLE 81: Japan Historic Review for Temperature Detection Screens by Technology - Non-Contact Infrared Technology and Thermal Imaging Systems Markets - Independent Analysis of Annual Sales in US$ Thousand for Years 2015 through 2023 and % CAGR
- TABLE 82: Japan 15-Year Perspective for Temperature Detection Screens by Technology - Percentage Breakdown of Value Sales for Non-Contact Infrared Technology and Thermal Imaging Systems for the Years 2015, 2025 & 2030
- TABLE 83: Japan Recent Past, Current & Future Analysis for Temperature Detection Screens by Application - Living Beings, Equipment / Machines and Other Applications - Independent Analysis of Annual Sales in US$ Thousand for the Years 2024 through 2030 and % CAGR
- TABLE 84: Japan Historic Review for Temperature Detection Screens by Application - Living Beings, Equipment / Machines and Other Applications Markets - Independent Analysis of Annual Sales in US$ Thousand for Years 2015 through 2023 and % CAGR
- TABLE 85: Japan 15-Year Perspective for Temperature Detection Screens by Application - Percentage Breakdown of Value Sales for Living Beings, Equipment / Machines and Other Applications for the Years 2015, 2025 & 2030
- CHINA
- Temperature Detection Screens Market Presence - Strong/Active/Niche/Trivial - Key Competitors in China for 2025 (E)
- TABLE 86: China Recent Past, Current & Future Analysis for Temperature Detection Screens by Platform - Handheld / Portable and Smart / Fixed Position - Independent Analysis of Annual Sales in US$ Thousand for the Years 2024 through 2030 and % CAGR
- TABLE 87: China Historic Review for Temperature Detection Screens by Platform - Handheld / Portable and Smart / Fixed Position Markets - Independent Analysis of Annual Sales in US$ Thousand for Years 2015 through 2023 and % CAGR
- TABLE 88: China 15-Year Perspective for Temperature Detection Screens by Platform - Percentage Breakdown of Value Sales for Handheld / Portable and Smart / Fixed Position for the Years 2015, 2025 & 2030
- TABLE 89: China Recent Past, Current & Future Analysis for Temperature Detection Screens by Vertical - Military & Defense, Transportation & Logistics, Power Generation, Oil & Gas, Manufacturing, Other Verticals, Healthcare & Life Sciences and Residential & Commercial Buildings - Independent Analysis of Annual Sales in US$ Thousand for the Years 2024 through 2030 and % CAGR
- TABLE 90: China Historic Review for Temperature Detection Screens by Vertical - Military & Defense, Transportation & Logistics, Power Generation, Oil & Gas, Manufacturing, Other Verticals, Healthcare & Life Sciences and Residential & Commercial Buildings Markets - Independent Analysis of Annual Sales in US$ Thousand for Years 2015 through 2023 and % CAGR
- TABLE 91: China 15-Year Perspective for Temperature Detection Screens by Vertical - Percentage Breakdown of Value Sales for Military & Defense, Transportation & Logistics, Power Generation, Oil & Gas, Manufacturing, Other Verticals, Healthcare & Life Sciences and Residential & Commercial Buildings for the Years 2015, 2025 & 2030
- TABLE 92: China Recent Past, Current & Future Analysis for Temperature Detection Screens by Technology - Non-Contact Infrared Technology and Thermal Imaging Systems - Independent Analysis of Annual Sales in US$ Thousand for the Years 2024 through 2030 and % CAGR
- TABLE 93: China Historic Review for Temperature Detection Screens by Technology - Non-Contact Infrared Technology and Thermal Imaging Systems Markets - Independent Analysis of Annual Sales in US$ Thousand for Years 2015 through 2023 and % CAGR
- TABLE 94: China 15-Year Perspective for Temperature Detection Screens by Technology - Percentage Breakdown of Value Sales for Non-Contact Infrared Technology and Thermal Imaging Systems for the Years 2015, 2025 & 2030
- TABLE 95: China Recent Past, Current & Future Analysis for Temperature Detection Screens by Application - Living Beings, Equipment / Machines and Other Applications - Independent Analysis of Annual Sales in US$ Thousand for the Years 2024 through 2030 and % CAGR
- TABLE 96: China Historic Review for Temperature Detection Screens by Application - Living Beings, Equipment / Machines and Other Applications Markets - Independent Analysis of Annual Sales in US$ Thousand for Years 2015 through 2023 and % CAGR
- TABLE 97: China 15-Year Perspective for Temperature Detection Screens by Application - Percentage Breakdown of Value Sales for Living Beings, Equipment / Machines and Other Applications for the Years 2015, 2025 & 2030
- EUROPE
- Temperature Detection Screens Market Presence - Strong/Active/Niche/Trivial - Key Competitors in Europe for 2025 (E)
- TABLE 98: Europe Recent Past, Current & Future Analysis for Temperature Detection Screens by Geographic Region - France, Germany, Italy, UK, Spain, Russia and Rest of Europe Markets - Independent Analysis of Annual Sales in US$ Thousand for Years 2024 through 2030 and % CAGR
- TABLE 99: Europe Historic Review for Temperature Detection Screens by Geographic Region - France, Germany, Italy, UK, Spain, Russia and Rest of Europe Markets - Independent Analysis of Annual Sales in US$ Thousand for Years 2015 through 2023 and % CAGR
- TABLE 100: Europe 15-Year Perspective for Temperature Detection Screens by Geographic Region - Percentage Breakdown of Value Sales for France, Germany, Italy, UK, Spain, Russia and Rest of Europe Markets for Years 2015, 2025 & 2030
- TABLE 101: Europe Recent Past, Current & Future Analysis for Temperature Detection Screens by Platform - Handheld / Portable and Smart / Fixed Position - Independent Analysis of Annual Sales in US$ Thousand for the Years 2024 through 2030 and % CAGR
- TABLE 102: Europe Historic Review for Temperature Detection Screens by Platform - Handheld / Portable and Smart / Fixed Position Markets - Independent Analysis of Annual Sales in US$ Thousand for Years 2015 through 2023 and % CAGR
- TABLE 103: Europe 15-Year Perspective for Temperature Detection Screens by Platform - Percentage Breakdown of Value Sales for Handheld / Portable and Smart / Fixed Position for the Years 2015, 2025 & 2030
- TABLE 104: Europe Recent Past, Current & Future Analysis for Temperature Detection Screens by Vertical - Military & Defense, Transportation & Logistics, Power Generation, Oil & Gas, Manufacturing, Other Verticals, Healthcare & Life Sciences and Residential & Commercial Buildings - Independent Analysis of Annual Sales in US$ Thousand for the Years 2024 through 2030 and % CAGR
- TABLE 105: Europe Historic Review for Temperature Detection Screens by Vertical - Military & Defense, Transportation & Logistics, Power Generation, Oil & Gas, Manufacturing, Other Verticals, Healthcare & Life Sciences and Residential & Commercial Buildings Markets - Independent Analysis of Annual Sales in US$ Thousand for Years 2015 through 2023 and % CAGR
- TABLE 106: Europe 15-Year Perspective for Temperature Detection Screens by Vertical - Percentage Breakdown of Value Sales for Military & Defense, Transportation & Logistics, Power Generation, Oil & Gas, Manufacturing, Other Verticals, Healthcare & Life Sciences and Residential & Commercial Buildings for the Years 2015, 2025 & 2030
- TABLE 107: Europe Recent Past, Current & Future Analysis for Temperature Detection Screens by Technology - Non-Contact Infrared Technology and Thermal Imaging Systems - Independent Analysis of Annual Sales in US$ Thousand for the Years 2024 through 2030 and % CAGR
- TABLE 108: Europe Historic Review for Temperature Detection Screens by Technology - Non-Contact Infrared Technology and Thermal Imaging Systems Markets - Independent Analysis of Annual Sales in US$ Thousand for Years 2015 through 2023 and % CAGR
- TABLE 109: Europe 15-Year Perspective for Temperature Detection Screens by Technology - Percentage Breakdown of Value Sales for Non-Contact Infrared Technology and Thermal Imaging Systems for the Years 2015, 2025 & 2030
- TABLE 110: Europe Recent Past, Current & Future Analysis for Temperature Detection Screens by Application - Living Beings, Equipment / Machines and Other Applications - Independent Analysis of Annual Sales in US$ Thousand for the Years 2024 through 2030 and % CAGR
- TABLE 111: Europe Historic Review for Temperature Detection Screens by Application - Living Beings, Equipment / Machines and Other Applications Markets - Independent Analysis of Annual Sales in US$ Thousand for Years 2015 through 2023 and % CAGR
- TABLE 112: Europe 15-Year Perspective for Temperature Detection Screens by Application - Percentage Breakdown of Value Sales for Living Beings, Equipment / Machines and Other Applications for the Years 2015, 2025 & 2030
- FRANCE
- Temperature Detection Screens Market Presence - Strong/Active/Niche/Trivial - Key Competitors in France for 2025 (E)
- TABLE 113: France Recent Past, Current & Future Analysis for Temperature Detection Screens by Platform - Handheld / Portable and Smart / Fixed Position - Independent Analysis of Annual Sales in US$ Thousand for the Years 2024 through 2030 and % CAGR
- TABLE 114: France Historic Review for Temperature Detection Screens by Platform - Handheld / Portable and Smart / Fixed Position Markets - Independent Analysis of Annual Sales in US$ Thousand for Years 2015 through 2023 and % CAGR
- TABLE 115: France 15-Year Perspective for Temperature Detection Screens by Platform - Percentage Breakdown of Value Sales for Handheld / Portable and Smart / Fixed Position for the Years 2015, 2025 & 2030
- TABLE 116: France Recent Past, Current & Future Analysis for Temperature Detection Screens by Vertical - Military & Defense, Transportation & Logistics, Power Generation, Oil & Gas, Manufacturing, Other Verticals, Healthcare & Life Sciences and Residential & Commercial Buildings - Independent Analysis of Annual Sales in US$ Thousand for the Years 2024 through 2030 and % CAGR
- TABLE 117: France Historic Review for Temperature Detection Screens by Vertical - Military & Defense, Transportation & Logistics, Power Generation, Oil & Gas, Manufacturing, Other Verticals, Healthcare & Life Sciences and Residential & Commercial Buildings Markets - Independent Analysis of Annual Sales in US$ Thousand for Years 2015 through 2023 and % CAGR
- TABLE 118: France 15-Year Perspective for Temperature Detection Screens by Vertical - Percentage Breakdown of Value Sales for Military & Defense, Transportation & Logistics, Power Generation, Oil & Gas, Manufacturing, Other Verticals, Healthcare & Life Sciences and Residential & Commercial Buildings for the Years 2015, 2025 & 2030
- TABLE 119: France Recent Past, Current & Future Analysis for Temperature Detection Screens by Technology - Non-Contact Infrared Technology and Thermal Imaging Systems - Independent Analysis of Annual Sales in US$ Thousand for the Years 2024 through 2030 and % CAGR
- TABLE 120: France Historic Review for Temperature Detection Screens by Technology - Non-Contact Infrared Technology and Thermal Imaging Systems Markets - Independent Analysis of Annual Sales in US$ Thousand for Years 2015 through 2023 and % CAGR
- TABLE 121: France 15-Year Perspective for Temperature Detection Screens by Technology - Percentage Breakdown of Value Sales for Non-Contact Infrared Technology and Thermal Imaging Systems for the Years 2015, 2025 & 2030
- TABLE 122: France Recent Past, Current & Future Analysis for Temperature Detection Screens by Application - Living Beings, Equipment / Machines and Other Applications - Independent Analysis of Annual Sales in US$ Thousand for the Years 2024 through 2030 and % CAGR
- TABLE 123: France Historic Review for Temperature Detection Screens by Application - Living Beings, Equipment / Machines and Other Applications Markets - Independent Analysis of Annual Sales in US$ Thousand for Years 2015 through 2023 and % CAGR
- TABLE 124: France 15-Year Perspective for Temperature Detection Screens by Application - Percentage Breakdown of Value Sales for Living Beings, Equipment / Machines and Other Applications for the Years 2015, 2025 & 2030
- GERMANY
- Temperature Detection Screens Market Presence - Strong/Active/Niche/Trivial - Key Competitors in Germany for 2025 (E)
- TABLE 125: Germany Recent Past, Current & Future Analysis for Temperature Detection Screens by Platform - Handheld / Portable and Smart / Fixed Position - Independent Analysis of Annual Sales in US$ Thousand for the Years 2024 through 2030 and % CAGR
- TABLE 126: Germany Historic Review for Temperature Detection Screens by Platform - Handheld / Portable and Smart / Fixed Position Markets - Independent Analysis of Annual Sales in US$ Thousand for Years 2015 through 2023 and % CAGR
- TABLE 127: Germany 15-Year Perspective for Temperature Detection Screens by Platform - Percentage Breakdown of Value Sales for Handheld / Portable and Smart / Fixed Position for the Years 2015, 2025 & 2030
- TABLE 128: Germany Recent Past, Current & Future Analysis for Temperature Detection Screens by Vertical - Military & Defense, Transportation & Logistics, Power Generation, Oil & Gas, Manufacturing, Other Verticals, Healthcare & Life Sciences and Residential & Commercial Buildings - Independent Analysis of Annual Sales in US$ Thousand for the Years 2024 through 2030 and % CAGR
- TABLE 129: Germany Historic Review for Temperature Detection Screens by Vertical - Military & Defense, Transportation & Logistics, Power Generation, Oil & Gas, Manufacturing, Other Verticals, Healthcare & Life Sciences and Residential & Commercial Buildings Markets - Independent Analysis of Annual Sales in US$ Thousand for Years 2015 through 2023 and % CAGR
- TABLE 130: Germany 15-Year Perspective for Temperature Detection Screens by Vertical - Percentage Breakdown of Value Sales for Military & Defense, Transportation & Logistics, Power Generation, Oil & Gas, Manufacturing, Other Verticals, Healthcare & Life Sciences and Residential & Commercial Buildings for the Years 2015, 2025 & 2030
- TABLE 131: Germany Recent Past, Current & Future Analysis for Temperature Detection Screens by Technology - Non-Contact Infrared Technology and Thermal Imaging Systems - Independent Analysis of Annual Sales in US$ Thousand for the Years 2024 through 2030 and % CAGR
- TABLE 132: Germany Historic Review for Temperature Detection Screens by Technology - Non-Contact Infrared Technology and Thermal Imaging Systems Markets - Independent Analysis of Annual Sales in US$ Thousand for Years 2015 through 2023 and % CAGR
- TABLE 133: Germany 15-Year Perspective for Temperature Detection Screens by Technology - Percentage Breakdown of Value Sales for Non-Contact Infrared Technology and Thermal Imaging Systems for the Years 2015, 2025 & 2030
- TABLE 134: Germany Recent Past, Current & Future Analysis for Temperature Detection Screens by Application - Living Beings, Equipment / Machines and Other Applications - Independent Analysis of Annual Sales in US$ Thousand for the Years 2024 through 2030 and % CAGR
- TABLE 135: Germany Historic Review for Temperature Detection Screens by Application - Living Beings, Equipment / Machines and Other Applications Markets - Independent Analysis of Annual Sales in US$ Thousand for Years 2015 through 2023 and % CAGR
- TABLE 136: Germany 15-Year Perspective for Temperature Detection Screens by Application - Percentage Breakdown of Value Sales for Living Beings, Equipment / Machines and Other Applications for the Years 2015, 2025 & 2030
- ITALY
- TABLE 137: Italy Recent Past, Current & Future Analysis for Temperature Detection Screens by Platform - Handheld / Portable and Smart / Fixed Position - Independent Analysis of Annual Sales in US$ Thousand for the Years 2024 through 2030 and % CAGR
- TABLE 138: Italy Historic Review for Temperature Detection Screens by Platform - Handheld / Portable and Smart / Fixed Position Markets - Independent Analysis of Annual Sales in US$ Thousand for Years 2015 through 2023 and % CAGR
- TABLE 139: Italy 15-Year Perspective for Temperature Detection Screens by Platform - Percentage Breakdown of Value Sales for Handheld / Portable and Smart / Fixed Position for the Years 2015, 2025 & 2030
- TABLE 140: Italy Recent Past, Current & Future Analysis for Temperature Detection Screens by Vertical - Military & Defense, Transportation & Logistics, Power Generation, Oil & Gas, Manufacturing, Other Verticals, Healthcare & Life Sciences and Residential & Commercial Buildings - Independent Analysis of Annual Sales in US$ Thousand for the Years 2024 through 2030 and % CAGR
- TABLE 141: Italy Historic Review for Temperature Detection Screens by Vertical - Military & Defense, Transportation & Logistics, Power Generation, Oil & Gas, Manufacturing, Other Verticals, Healthcare & Life Sciences and Residential & Commercial Buildings Markets - Independent Analysis of Annual Sales in US$ Thousand for Years 2015 through 2023 and % CAGR
- TABLE 142: Italy 15-Year Perspective for Temperature Detection Screens by Vertical - Percentage Breakdown of Value Sales for Military & Defense, Transportation & Logistics, Power Generation, Oil & Gas, Manufacturing, Other Verticals, Healthcare & Life Sciences and Residential & Commercial Buildings for the Years 2015, 2025 & 2030
- TABLE 143: Italy Recent Past, Current & Future Analysis for Temperature Detection Screens by Technology - Non-Contact Infrared Technology and Thermal Imaging Systems - Independent Analysis of Annual Sales in US$ Thousand for the Years 2024 through 2030 and % CAGR
- TABLE 144: Italy Historic Review for Temperature Detection Screens by Technology - Non-Contact Infrared Technology and Thermal Imaging Systems Markets - Independent Analysis of Annual Sales in US$ Thousand for Years 2015 through 2023 and % CAGR
- TABLE 145: Italy 15-Year Perspective for Temperature Detection Screens by Technology - Percentage Breakdown of Value Sales for Non-Contact Infrared Technology and Thermal Imaging Systems for the Years 2015, 2025 & 2030
- TABLE 146: Italy Recent Past, Current & Future Analysis for Temperature Detection Screens by Application - Living Beings, Equipment / Machines and Other Applications - Independent Analysis of Annual Sales in US$ Thousand for the Years 2024 through 2030 and % CAGR
- TABLE 147: Italy Historic Review for Temperature Detection Screens by Application - Living Beings, Equipment / Machines and Other Applications Markets - Independent Analysis of Annual Sales in US$ Thousand for Years 2015 through 2023 and % CAGR
- TABLE 148: Italy 15-Year Perspective for Temperature Detection Screens by Application - Percentage Breakdown of Value Sales for Living Beings, Equipment / Machines and Other Applications for the Years 2015, 2025 & 2030
- UNITED KINGDOM
- Temperature Detection Screens Market Presence - Strong/Active/Niche/Trivial - Key Competitors in the United Kingdom for 2025 (E)
- TABLE 149: UK Recent Past, Current & Future Analysis for Temperature Detection Screens by Platform - Handheld / Portable and Smart / Fixed Position - Independent Analysis of Annual Sales in US$ Thousand for the Years 2024 through 2030 and % CAGR
- TABLE 150: UK Historic Review for Temperature Detection Screens by Platform - Handheld / Portable and Smart / Fixed Position Markets - Independent Analysis of Annual Sales in US$ Thousand for Years 2015 through 2023 and % CAGR
- TABLE 151: UK 15-Year Perspective for Temperature Detection Screens by Platform - Percentage Breakdown of Value Sales for Handheld / Portable and Smart / Fixed Position for the Years 2015, 2025 & 2030
- TABLE 152: UK Recent Past, Current & Future Analysis for Temperature Detection Screens by Vertical - Military & Defense, Transportation & Logistics, Power Generation, Oil & Gas, Manufacturing, Other Verticals, Healthcare & Life Sciences and Residential & Commercial Buildings - Independent Analysis of Annual Sales in US$ Thousand for the Years 2024 through 2030 and % CAGR
- TABLE 153: UK Historic Review for Temperature Detection Screens by Vertical - Military & Defense, Transportation & Logistics, Power Generation, Oil & Gas, Manufacturing, Other Verticals, Healthcare & Life Sciences and Residential & Commercial Buildings Markets - Independent Analysis of Annual Sales in US$ Thousand for Years 2015 through 2023 and % CAGR
- TABLE 154: UK 15-Year Perspective for Temperature Detection Screens by Vertical - Percentage Breakdown of Value Sales for Military & Defense, Transportation & Logistics, Power Generation, Oil & Gas, Manufacturing, Other Verticals, Healthcare & Life Sciences and Residential & Commercial Buildings for the Years 2015, 2025 & 2030
- TABLE 155: UK Recent Past, Current & Future Analysis for Temperature Detection Screens by Technology - Non-Contact Infrared Technology and Thermal Imaging Systems - Independent Analysis of Annual Sales in US$ Thousand for the Years 2024 through 2030 and % CAGR
- TABLE 156: UK Historic Review for Temperature Detection Screens by Technology - Non-Contact Infrared Technology and Thermal Imaging Systems Markets - Independent Analysis of Annual Sales in US$ Thousand for Years 2015 through 2023 and % CAGR
- TABLE 157: UK 15-Year Perspective for Temperature Detection Screens by Technology - Percentage Breakdown of Value Sales for Non-Contact Infrared Technology and Thermal Imaging Systems for the Years 2015, 2025 & 2030
- TABLE 158: UK Recent Past, Current & Future Analysis for Temperature Detection Screens by Application - Living Beings, Equipment / Machines and Other Applications - Independent Analysis of Annual Sales in US$ Thousand for the Years 2024 through 2030 and % CAGR
- TABLE 159: UK Historic Review for Temperature Detection Screens by Application - Living Beings, Equipment / Machines and Other Applications Markets - Independent Analysis of Annual Sales in US$ Thousand for Years 2015 through 2023 and % CAGR
- TABLE 160: UK 15-Year Perspective for Temperature Detection Screens by Application - Percentage Breakdown of Value Sales for Living Beings, Equipment / Machines and Other Applications for the Years 2015, 2025 & 2030
- SPAIN
- TABLE 161: Spain Recent Past, Current & Future Analysis for Temperature Detection Screens by Platform - Handheld / Portable and Smart / Fixed Position - Independent Analysis of Annual Sales in US$ Thousand for the Years 2024 through 2030 and % CAGR
- TABLE 162: Spain Historic Review for Temperature Detection Screens by Platform - Handheld / Portable and Smart / Fixed Position Markets - Independent Analysis of Annual Sales in US$ Thousand for Years 2015 through 2023 and % CAGR
- TABLE 163: Spain 15-Year Perspective for Temperature Detection Screens by Platform - Percentage Breakdown of Value Sales for Handheld / Portable and Smart / Fixed Position for the Years 2015, 2025 & 2030
- TABLE 164: Spain Recent Past, Current & Future Analysis for Temperature Detection Screens by Vertical - Military & Defense, Transportation & Logistics, Power Generation, Oil & Gas, Manufacturing, Other Verticals, Healthcare & Life Sciences and Residential & Commercial Buildings - Independent Analysis of Annual Sales in US$ Thousand for the Years 2024 through 2030 and % CAGR
- TABLE 165: Spain Historic Review for Temperature Detection Screens by Vertical - Military & Defense, Transportation & Logistics, Power Generation, Oil & Gas, Manufacturing, Other Verticals, Healthcare & Life Sciences and Residential & Commercial Buildings Markets - Independent Analysis of Annual Sales in US$ Thousand for Years 2015 through 2023 and % CAGR
- TABLE 166: Spain 15-Year Perspective for Temperature Detection Screens by Vertical - Percentage Breakdown of Value Sales for Military & Defense, Transportation & Logistics, Power Generation, Oil & Gas, Manufacturing, Other Verticals, Healthcare & Life Sciences and Residential & Commercial Buildings for the Years 2015, 2025 & 2030
- TABLE 167: Spain Recent Past, Current & Future Analysis for Temperature Detection Screens by Technology - Non-Contact Infrared Technology and Thermal Imaging Systems - Independent Analysis of Annual Sales in US$ Thousand for the Years 2024 through 2030 and % CAGR
- TABLE 168: Spain Historic Review for Temperature Detection Screens by Technology - Non-Contact Infrared Technology and Thermal Imaging Systems Markets - Independent Analysis of Annual Sales in US$ Thousand for Years 2015 through 2023 and % CAGR
- TABLE 169: Spain 15-Year Perspective for Temperature Detection Screens by Technology - Percentage Breakdown of Value Sales for Non-Contact Infrared Technology and Thermal Imaging Systems for the Years 2015, 2025 & 2030
- TABLE 170: Spain Recent Past, Current & Future Analysis for Temperature Detection Screens by Application - Living Beings, Equipment / Machines and Other Applications - Independent Analysis of Annual Sales in US$ Thousand for the Years 2024 through 2030 and % CAGR
- TABLE 171: Spain Historic Review for Temperature Detection Screens by Application - Living Beings, Equipment / Machines and Other Applications Markets - Independent Analysis of Annual Sales in US$ Thousand for Years 2015 through 2023 and % CAGR
- TABLE 172: Spain 15-Year Perspective for Temperature Detection Screens by Application - Percentage Breakdown of Value Sales for Living Beings, Equipment / Machines and Other Applications for the Years 2015, 2025 & 2030
- RUSSIA
- TABLE 173: Russia Recent Past, Current & Future Analysis for Temperature Detection Screens by Platform - Handheld / Portable and Smart / Fixed Position - Independent Analysis of Annual Sales in US$ Thousand for the Years 2024 through 2030 and % CAGR
- TABLE 174: Russia Historic Review for Temperature Detection Screens by Platform - Handheld / Portable and Smart / Fixed Position Markets - Independent Analysis of Annual Sales in US$ Thousand for Years 2015 through 2023 and % CAGR
- TABLE 175: Russia 15-Year Perspective for Temperature Detection Screens by Platform - Percentage Breakdown of Value Sales for Handheld / Portable and Smart / Fixed Position for the Years 2015, 2025 & 2030
- TABLE 176: Russia Recent Past, Current & Future Analysis for Temperature Detection Screens by Vertical - Military & Defense, Transportation & Logistics, Power Generation, Oil & Gas, Manufacturing, Other Verticals, Healthcare & Life Sciences and Residential & Commercial Buildings - Independent Analysis of Annual Sales in US$ Thousand for the Years 2024 through 2030 and % CAGR
- TABLE 177: Russia Historic Review for Temperature Detection Screens by Vertical - Military & Defense, Transportation & Logistics, Power Generation, Oil & Gas, Manufacturing, Other Verticals, Healthcare & Life Sciences and Residential & Commercial Buildings Markets - Independent Analysis of Annual Sales in US$ Thousand for Years 2015 through 2023 and % CAGR
- TABLE 178: Russia 15-Year Perspective for Temperature Detection Screens by Vertical - Percentage Breakdown of Value Sales for Military & Defense, Transportation & Logistics, Power Generation, Oil & Gas, Manufacturing, Other Verticals, Healthcare & Life Sciences and Residential & Commercial Buildings for the Years 2015, 2025 & 2030
- TABLE 179: Russia Recent Past, Current & Future Analysis for Temperature Detection Screens by Technology - Non-Contact Infrared Technology and Thermal Imaging Systems - Independent Analysis of Annual Sales in US$ Thousand for the Years 2024 through 2030 and % CAGR
- TABLE 180: Russia Historic Review for Temperature Detection Screens by Technology - Non-Contact Infrared Technology and Thermal Imaging Systems Markets - Independent Analysis of Annual Sales in US$ Thousand for Years 2015 through 2023 and % CAGR
- TABLE 181: Russia 15-Year Perspective for Temperature Detection Screens by Technology - Percentage Breakdown of Value Sales for Non-Contact Infrared Technology and Thermal Imaging Systems for the Years 2015, 2025 & 2030
- TABLE 182: Russia Recent Past, Current & Future Analysis for Temperature Detection Screens by Application - Living Beings, Equipment / Machines and Other Applications - Independent Analysis of Annual Sales in US$ Thousand for the Years 2024 through 2030 and % CAGR
- TABLE 183: Russia Historic Review for Temperature Detection Screens by Application - Living Beings, Equipment / Machines and Other Applications Markets - Independent Analysis of Annual Sales in US$ Thousand for Years 2015 through 2023 and % CAGR
- TABLE 184: Russia 15-Year Perspective for Temperature Detection Screens by Application - Percentage Breakdown of Value Sales for Living Beings, Equipment / Machines and Other Applications for the Years 2015, 2025 & 2030
- REST OF EUROPE
- TABLE 185: Rest of Europe Recent Past, Current & Future Analysis for Temperature Detection Screens by Platform - Handheld / Portable and Smart / Fixed Position - Independent Analysis of Annual Sales in US$ Thousand for the Years 2024 through 2030 and % CAGR
- TABLE 186: Rest of Europe Historic Review for Temperature Detection Screens by Platform - Handheld / Portable and Smart / Fixed Position Markets - Independent Analysis of Annual Sales in US$ Thousand for Years 2015 through 2023 and % CAGR
- TABLE 187: Rest of Europe 15-Year Perspective for Temperature Detection Screens by Platform - Percentage Breakdown of Value Sales for Handheld / Portable and Smart / Fixed Position for the Years 2015, 2025 & 2030
- TABLE 188: Rest of Europe Recent Past, Current & Future Analysis for Temperature Detection Screens by Vertical - Military & Defense, Transportation & Logistics, Power Generation, Oil & Gas, Manufacturing, Other Verticals, Healthcare & Life Sciences and Residential & Commercial Buildings - Independent Analysis of Annual Sales in US$ Thousand for the Years 2024 through 2030 and % CAGR
- TABLE 189: Rest of Europe Historic Review for Temperature Detection Screens by Vertical - Military & Defense, Transportation & Logistics, Power Generation, Oil & Gas, Manufacturing, Other Verticals, Healthcare & Life Sciences and Residential & Commercial Buildings Markets - Independent Analysis of Annual Sales in US$ Thousand for Years 2015 through 2023 and % CAGR
- TABLE 190: Rest of Europe 15-Year Perspective for Temperature Detection Screens by Vertical - Percentage Breakdown of Value Sales for Military & Defense, Transportation & Logistics, Power Generation, Oil & Gas, Manufacturing, Other Verticals, Healthcare & Life Sciences and Residential & Commercial Buildings for the Years 2015, 2025 & 2030
- TABLE 191: Rest of Europe Recent Past, Current & Future Analysis for Temperature Detection Screens by Technology - Non-Contact Infrared Technology and Thermal Imaging Systems - Independent Analysis of Annual Sales in US$ Thousand for the Years 2024 through 2030 and % CAGR
- TABLE 192: Rest of Europe Historic Review for Temperature Detection Screens by Technology - Non-Contact Infrared Technology and Thermal Imaging Systems Markets - Independent Analysis of Annual Sales in US$ Thousand for Years 2015 through 2023 and % CAGR
- TABLE 193: Rest of Europe 15-Year Perspective for Temperature Detection Screens by Technology - Percentage Breakdown of Value Sales for Non-Contact Infrared Technology and Thermal Imaging Systems for the Years 2015, 2025 & 2030
- TABLE 194: Rest of Europe Recent Past, Current & Future Analysis for Temperature Detection Screens by Application - Living Beings, Equipment / Machines and Other Applications - Independent Analysis of Annual Sales in US$ Thousand for the Years 2024 through 2030 and % CAGR
- TABLE 195: Rest of Europe Historic Review for Temperature Detection Screens by Application - Living Beings, Equipment / Machines and Other Applications Markets - Independent Analysis of Annual Sales in US$ Thousand for Years 2015 through 2023 and % CAGR
- TABLE 196: Rest of Europe 15-Year Perspective for Temperature Detection Screens by Application - Percentage Breakdown of Value Sales for Living Beings, Equipment / Machines and Other Applications for the Years 2015, 2025 & 2030
- ASIA-PACIFIC
- Temperature Detection Screens Market Presence - Strong/Active/Niche/Trivial - Key Competitors in Asia-Pacific for 2025 (E)
- TABLE 197: Asia-Pacific Recent Past, Current & Future Analysis for Temperature Detection Screens by Geographic Region - Australia, India, South Korea and Rest of Asia-Pacific Markets - Independent Analysis of Annual Sales in US$ Thousand for Years 2024 through 2030 and % CAGR
- TABLE 198: Asia-Pacific Historic Review for Temperature Detection Screens by Geographic Region - Australia, India, South Korea and Rest of Asia-Pacific Markets - Independent Analysis of Annual Sales in US$ Thousand for Years 2015 through 2023 and % CAGR
- TABLE 199: Asia-Pacific 15-Year Perspective for Temperature Detection Screens by Geographic Region - Percentage Breakdown of Value Sales for Australia, India, South Korea and Rest of Asia-Pacific Markets for Years 2015, 2025 & 2030
- TABLE 200: Asia-Pacific Recent Past, Current & Future Analysis for Temperature Detection Screens by Platform - Handheld / Portable and Smart / Fixed Position - Independent Analysis of Annual Sales in US$ Thousand for the Years 2024 through 2030 and % CAGR
- TABLE 201: Asia-Pacific Historic Review for Temperature Detection Screens by Platform - Handheld / Portable and Smart / Fixed Position Markets - Independent Analysis of Annual Sales in US$ Thousand for Years 2015 through 2023 and % CAGR
- TABLE 202: Asia-Pacific 15-Year Perspective for Temperature Detection Screens by Platform - Percentage Breakdown of Value Sales for Handheld / Portable and Smart / Fixed Position for the Years 2015, 2025 & 2030
- TABLE 203: Asia-Pacific Recent Past, Current & Future Analysis for Temperature Detection Screens by Vertical - Military & Defense, Transportation & Logistics, Power Generation, Oil & Gas, Manufacturing, Other Verticals, Healthcare & Life Sciences and Residential & Commercial Buildings - Independent Analysis of Annual Sales in US$ Thousand for the Years 2024 through 2030 and % CAGR
- TABLE 204: Asia-Pacific Historic Review for Temperature Detection Screens by Vertical - Military & Defense, Transportation & Logistics, Power Generation, Oil & Gas, Manufacturing, Other Verticals, Healthcare & Life Sciences and Residential & Commercial Buildings Markets - Independent Analysis of Annual Sales in US$ Thousand for Years 2015 through 2023 and % CAGR
- TABLE 205: Asia-Pacific 15-Year Perspective for Temperature Detection Screens by Vertical - Percentage Breakdown of Value Sales for Military & Defense, Transportation & Logistics, Power Generation, Oil & Gas, Manufacturing, Other Verticals, Healthcare & Life Sciences and Residential & Commercial Buildings for the Years 2015, 2025 & 2030
- TABLE 206: Asia-Pacific Recent Past, Current & Future Analysis for Temperature Detection Screens by Technology - Non-Contact Infrared Technology and Thermal Imaging Systems - Independent Analysis of Annual Sales in US$ Thousand for the Years 2024 through 2030 and % CAGR
- TABLE 207: Asia-Pacific Historic Review for Temperature Detection Screens by Technology - Non-Contact Infrared Technology and Thermal Imaging Systems Markets - Independent Analysis of Annual Sales in US$ Thousand for Years 2015 through 2023 and % CAGR
- TABLE 208: Asia-Pacific 15-Year Perspective for Temperature Detection Screens by Technology - Percentage Breakdown of Value Sales for Non-Contact Infrared Technology and Thermal Imaging Systems for the Years 2015, 2025 & 2030
- TABLE 209: Asia-Pacific Recent Past, Current & Future Analysis for Temperature Detection Screens by Application - Living Beings, Equipment / Machines and Other Applications - Independent Analysis of Annual Sales in US$ Thousand for the Years 2024 through 2030 and % CAGR
- TABLE 210: Asia-Pacific Historic Review for Temperature Detection Screens by Application - Living Beings, Equipment / Machines and Other Applications Markets - Independent Analysis of Annual Sales in US$ Thousand for Years 2015 through 2023 and % CAGR
- TABLE 211: Asia-Pacific 15-Year Perspective for Temperature Detection Screens by Application - Percentage Breakdown of Value Sales for Living Beings, Equipment / Machines and Other Applications for the Years 2015, 2025 & 2030
- AUSTRALIA
- Temperature Detection Screens Market Presence - Strong/Active/Niche/Trivial - Key Competitors in Australia for 2025 (E)
- TABLE 212: Australia Recent Past, Current & Future Analysis for Temperature Detection Screens by Platform - Handheld / Portable and Smart / Fixed Position - Independent Analysis of Annual Sales in US$ Thousand for the Years 2024 through 2030 and % CAGR
- TABLE 213: Australia Historic Review for Temperature Detection Screens by Platform - Handheld / Portable and Smart / Fixed Position Markets - Independent Analysis of Annual Sales in US$ Thousand for Years 2015 through 2023 and % CAGR
- TABLE 214: Australia 15-Year Perspective for Temperature Detection Screens by Platform - Percentage Breakdown of Value Sales for Handheld / Portable and Smart / Fixed Position for the Years 2015, 2025 & 2030
- TABLE 215: Australia Recent Past, Current & Future Analysis for Temperature Detection Screens by Vertical - Military & Defense, Transportation & Logistics, Power Generation, Oil & Gas, Manufacturing, Other Verticals, Healthcare & Life Sciences and Residential & Commercial Buildings - Independent Analysis of Annual Sales in US$ Thousand for the Years 2024 through 2030 and % CAGR
- TABLE 216: Australia Historic Review for Temperature Detection Screens by Vertical - Military & Defense, Transportation & Logistics, Power Generation, Oil & Gas, Manufacturing, Other Verticals, Healthcare & Life Sciences and Residential & Commercial Buildings Markets - Independent Analysis of Annual Sales in US$ Thousand for Years 2015 through 2023 and % CAGR
- TABLE 217: Australia 15-Year Perspective for Temperature Detection Screens by Vertical - Percentage Breakdown of Value Sales for Military & Defense, Transportation & Logistics, Power Generation, Oil & Gas, Manufacturing, Other Verticals, Healthcare & Life Sciences and Residential & Commercial Buildings for the Years 2015, 2025 & 2030
- TABLE 218: Australia Recent Past, Current & Future Analysis for Temperature Detection Screens by Technology - Non-Contact Infrared Technology and Thermal Imaging Systems - Independent Analysis of Annual Sales in US$ Thousand for the Years 2024 through 2030 and % CAGR
- TABLE 219: Australia Historic Review for Temperature Detection Screens by Technology - Non-Contact Infrared Technology and Thermal Imaging Systems Markets - Independent Analysis of Annual Sales in US$ Thousand for Years 2015 through 2023 and % CAGR
- TABLE 220: Australia 15-Year Perspective for Temperature Detection Screens by Technology - Percentage Breakdown of Value Sales for Non-Contact Infrared Technology and Thermal Imaging Systems for the Years 2015, 2025 & 2030
- TABLE 221: Australia Recent Past, Current & Future Analysis for Temperature Detection Screens by Application - Living Beings, Equipment / Machines and Other Applications - Independent Analysis of Annual Sales in US$ Thousand for the Years 2024 through 2030 and % CAGR
- TABLE 222: Australia Historic Review for Temperature Detection Screens by Application - Living Beings, Equipment / Machines and Other Applications Markets - Independent Analysis of Annual Sales in US$ Thousand for Years 2015 through 2023 and % CAGR
- TABLE 223: Australia 15-Year Perspective for Temperature Detection Screens by Application - Percentage Breakdown of Value Sales for Living Beings, Equipment / Machines and Other Applications for the Years 2015, 2025 & 2030
- INDIA
- Temperature Detection Screens Market Presence - Strong/Active/Niche/Trivial - Key Competitors in India for 2025 (E)
- TABLE 224: India Recent Past, Current & Future Analysis for Temperature Detection Screens by Platform - Handheld / Portable and Smart / Fixed Position - Independent Analysis of Annual Sales in US$ Thousand for the Years 2024 through 2030 and % CAGR
- TABLE 225: India Historic Review for Temperature Detection Screens by Platform - Handheld / Portable and Smart / Fixed Position Markets - Independent Analysis of Annual Sales in US$ Thousand for Years 2015 through 2023 and % CAGR
- TABLE 226: India 15-Year Perspective for Temperature Detection Screens by Platform - Percentage Breakdown of Value Sales for Handheld / Portable and Smart / Fixed Position for the Years 2015, 2025 & 2030
- TABLE 227: India Recent Past, Current & Future Analysis for Temperature Detection Screens by Vertical - Military & Defense, Transportation & Logistics, Power Generation, Oil & Gas, Manufacturing, Other Verticals, Healthcare & Life Sciences and Residential & Commercial Buildings - Independent Analysis of Annual Sales in US$ Thousand for the Years 2024 through 2030 and % CAGR
- TABLE 228: India Historic Review for Temperature Detection Screens by Vertical - Military & Defense, Transportation & Logistics, Power Generation, Oil & Gas, Manufacturing, Other Verticals, Healthcare & Life Sciences and Residential & Commercial Buildings Markets - Independent Analysis of Annual Sales in US$ Thousand for Years 2015 through 2023 and % CAGR
- TABLE 229: India 15-Year Perspective for Temperature Detection Screens by Vertical - Percentage Breakdown of Value Sales for Military & Defense, Transportation & Logistics, Power Generation, Oil & Gas, Manufacturing, Other Verticals, Healthcare & Life Sciences and Residential & Commercial Buildings for the Years 2015, 2025 & 2030
- TABLE 230: India Recent Past, Current & Future Analysis for Temperature Detection Screens by Technology - Non-Contact Infrared Technology and Thermal Imaging Systems - Independent Analysis of Annual Sales in US$ Thousand for the Years 2024 through 2030 and % CAGR
- TABLE 231: India Historic Review for Temperature Detection Screens by Technology - Non-Contact Infrared Technology and Thermal Imaging Systems Markets - Independent Analysis of Annual Sales in US$ Thousand for Years 2015 through 2023 and % CAGR
- TABLE 232: India 15-Year Perspective for Temperature Detection Screens by Technology - Percentage Breakdown of Value Sales for Non-Contact Infrared Technology and Thermal Imaging Systems for the Years 2015, 2025 & 2030
- TABLE 233: India Recent Past, Current & Future Analysis for Temperature Detection Screens by Application - Living Beings, Equipment / Machines and Other Applications - Independent Analysis of Annual Sales in US$ Thousand for the Years 2024 through 2030 and % CAGR
- TABLE 234: India Historic Review for Temperature Detection Screens by Application - Living Beings, Equipment / Machines and Other Applications Markets - Independent Analysis of Annual Sales in US$ Thousand for Years 2015 through 2023 and % CAGR
- TABLE 235: India 15-Year Perspective for Temperature Detection Screens by Application - Percentage Breakdown of Value Sales for Living Beings, Equipment / Machines and Other Applications for the Years 2015, 2025 & 2030
- SOUTH KOREA
- TABLE 236: South Korea Recent Past, Current & Future Analysis for Temperature Detection Screens by Platform - Handheld / Portable and Smart / Fixed Position - Independent Analysis of Annual Sales in US$ Thousand for the Years 2024 through 2030 and % CAGR
- TABLE 237: South Korea Historic Review for Temperature Detection Screens by Platform - Handheld / Portable and Smart / Fixed Position Markets - Independent Analysis of Annual Sales in US$ Thousand for Years 2015 through 2023 and % CAGR
- TABLE 238: South Korea 15-Year Perspective for Temperature Detection Screens by Platform - Percentage Breakdown of Value Sales for Handheld / Portable and Smart / Fixed Position for the Years 2015, 2025 & 2030
- TABLE 239: South Korea Recent Past, Current & Future Analysis for Temperature Detection Screens by Vertical - Military & Defense, Transportation & Logistics, Power Generation, Oil & Gas, Manufacturing, Other Verticals, Healthcare & Life Sciences and Residential & Commercial Buildings - Independent Analysis of Annual Sales in US$ Thousand for the Years 2024 through 2030 and % CAGR
- TABLE 240: South Korea Historic Review for Temperature Detection Screens by Vertical - Military & Defense, Transportation & Logistics, Power Generation, Oil & Gas, Manufacturing, Other Verticals, Healthcare & Life Sciences and Residential & Commercial Buildings Markets - Independent Analysis of Annual Sales in US$ Thousand for Years 2015 through 2023 and % CAGR
- TABLE 241: South Korea 15-Year Perspective for Temperature Detection Screens by Vertical - Percentage Breakdown of Value Sales for Military & Defense, Transportation & Logistics, Power Generation, Oil & Gas, Manufacturing, Other Verticals, Healthcare & Life Sciences and Residential & Commercial Buildings for the Years 2015, 2025 & 2030
- TABLE 242: South Korea Recent Past, Current & Future Analysis for Temperature Detection Screens by Technology - Non-Contact Infrared Technology and Thermal Imaging Systems - Independent Analysis of Annual Sales in US$ Thousand for the Years 2024 through 2030 and % CAGR
- TABLE 243: South Korea Historic Review for Temperature Detection Screens by Technology - Non-Contact Infrared Technology and Thermal Imaging Systems Markets - Independent Analysis of Annual Sales in US$ Thousand for Years 2015 through 2023 and % CAGR
- TABLE 244: South Korea 15-Year Perspective for Temperature Detection Screens by Technology - Percentage Breakdown of Value Sales for Non-Contact Infrared Technology and Thermal Imaging Systems for the Years 2015, 2025 & 2030
- TABLE 245: South Korea Recent Past, Current & Future Analysis for Temperature Detection Screens by Application - Living Beings, Equipment / Machines and Other Applications - Independent Analysis of Annual Sales in US$ Thousand for the Years 2024 through 2030 and % CAGR
- TABLE 246: South Korea Historic Review for Temperature Detection Screens by Application - Living Beings, Equipment / Machines and Other Applications Markets - Independent Analysis of Annual Sales in US$ Thousand for Years 2015 through 2023 and % CAGR
- TABLE 247: South Korea 15-Year Perspective for Temperature Detection Screens by Application - Percentage Breakdown of Value Sales for Living Beings, Equipment / Machines and Other Applications for the Years 2015, 2025 & 2030
- REST OF ASIA-PACIFIC
- TABLE 248: Rest of Asia-Pacific Recent Past, Current & Future Analysis for Temperature Detection Screens by Platform - Handheld / Portable and Smart / Fixed Position - Independent Analysis of Annual Sales in US$ Thousand for the Years 2024 through 2030 and % CAGR
- TABLE 249: Rest of Asia-Pacific Historic Review for Temperature Detection Screens by Platform - Handheld / Portable and Smart / Fixed Position Markets - Independent Analysis of Annual Sales in US$ Thousand for Years 2015 through 2023 and % CAGR
- TABLE 250: Rest of Asia-Pacific 15-Year Perspective for Temperature Detection Screens by Platform - Percentage Breakdown of Value Sales for Handheld / Portable and Smart / Fixed Position for the Years 2015, 2025 & 2030
- TABLE 251: Rest of Asia-Pacific Recent Past, Current & Future Analysis for Temperature Detection Screens by Vertical - Military & Defense, Transportation & Logistics, Power Generation, Oil & Gas, Manufacturing, Other Verticals, Healthcare & Life Sciences and Residential & Commercial Buildings - Independent Analysis of Annual Sales in US$ Thousand for the Years 2024 through 2030 and % CAGR
- TABLE 252: Rest of Asia-Pacific Historic Review for Temperature Detection Screens by Vertical - Military & Defense, Transportation & Logistics, Power Generation, Oil & Gas, Manufacturing, Other Verticals, Healthcare & Life Sciences and Residential & Commercial Buildings Markets - Independent Analysis of Annual Sales in US$ Thousand for Years 2015 through 2023 and % CAGR
- TABLE 253: Rest of Asia-Pacific 15-Year Perspective for Temperature Detection Screens by Vertical - Percentage Breakdown of Value Sales for Military & Defense, Transportation & Logistics, Power Generation, Oil & Gas, Manufacturing, Other Verticals, Healthcare & Life Sciences and Residential & Commercial Buildings for the Years 2015, 2025 & 2030
- TABLE 254: Rest of Asia-Pacific Recent Past, Current & Future Analysis for Temperature Detection Screens by Technology - Non-Contact Infrared Technology and Thermal Imaging Systems - Independent Analysis of Annual Sales in US$ Thousand for the Years 2024 through 2030 and % CAGR
- TABLE 255: Rest of Asia-Pacific Historic Review for Temperature Detection Screens by Technology - Non-Contact Infrared Technology and Thermal Imaging Systems Markets - Independent Analysis of Annual Sales in US$ Thousand for Years 2015 through 2023 and % CAGR
- TABLE 256: Rest of Asia-Pacific 15-Year Perspective for Temperature Detection Screens by Technology - Percentage Breakdown of Value Sales for Non-Contact Infrared Technology and Thermal Imaging Systems for the Years 2015, 2025 & 2030
- TABLE 257: Rest of Asia-Pacific Recent Past, Current & Future Analysis for Temperature Detection Screens by Application - Living Beings, Equipment / Machines and Other Applications - Independent Analysis of Annual Sales in US$ Thousand for the Years 2024 through 2030 and % CAGR
- TABLE 258: Rest of Asia-Pacific Historic Review for Temperature Detection Screens by Application - Living Beings, Equipment / Machines and Other Applications Markets - Independent Analysis of Annual Sales in US$ Thousand for Years 2015 through 2023 and % CAGR
- TABLE 259: Rest of Asia-Pacific 15-Year Perspective for Temperature Detection Screens by Application - Percentage Breakdown of Value Sales for Living Beings, Equipment / Machines and Other Applications for the Years 2015, 2025 & 2030
- LATIN AMERICA
- Temperature Detection Screens Market Presence - Strong/Active/Niche/Trivial - Key Competitors in Latin America for 2025 (E)
- TABLE 260: Latin America Recent Past, Current & Future Analysis for Temperature Detection Screens by Geographic Region - Argentina, Brazil, Mexico and Rest of Latin America Markets - Independent Analysis of Annual Sales in US$ Thousand for Years 2024 through 2030 and % CAGR
- TABLE 261: Latin America Historic Review for Temperature Detection Screens by Geographic Region - Argentina, Brazil, Mexico and Rest of Latin America Markets - Independent Analysis of Annual Sales in US$ Thousand for Years 2015 through 2023 and % CAGR
- TABLE 262: Latin America 15-Year Perspective for Temperature Detection Screens by Geographic Region - Percentage Breakdown of Value Sales for Argentina, Brazil, Mexico and Rest of Latin America Markets for Years 2015, 2025 & 2030
- TABLE 263: Latin America Recent Past, Current & Future Analysis for Temperature Detection Screens by Platform - Handheld / Portable and Smart / Fixed Position - Independent Analysis of Annual Sales in US$ Thousand for the Years 2024 through 2030 and % CAGR
- TABLE 264: Latin America Historic Review for Temperature Detection Screens by Platform - Handheld / Portable and Smart / Fixed Position Markets - Independent Analysis of Annual Sales in US$ Thousand for Years 2015 through 2023 and % CAGR
- TABLE 265: Latin America 15-Year Perspective for Temperature Detection Screens by Platform - Percentage Breakdown of Value Sales for Handheld / Portable and Smart / Fixed Position for the Years 2015, 2025 & 2030
- TABLE 266: Latin America Recent Past, Current & Future Analysis for Temperature Detection Screens by Vertical - Military & Defense, Transportation & Logistics, Power Generation, Oil & Gas, Manufacturing, Other Verticals, Healthcare & Life Sciences and Residential & Commercial Buildings - Independent Analysis of Annual Sales in US$ Thousand for the Years 2024 through 2030 and % CAGR
- TABLE 267: Latin America Historic Review for Temperature Detection Screens by Vertical - Military & Defense, Transportation & Logistics, Power Generation, Oil & Gas, Manufacturing, Other Verticals, Healthcare & Life Sciences and Residential & Commercial Buildings Markets - Independent Analysis of Annual Sales in US$ Thousand for Years 2015 through 2023 and % CAGR
- TABLE 268: Latin America 15-Year Perspective for Temperature Detection Screens by Vertical - Percentage Breakdown of Value Sales for Military & Defense, Transportation & Logistics, Power Generation, Oil & Gas, Manufacturing, Other Verticals, Healthcare & Life Sciences and Residential & Commercial Buildings for the Years 2015, 2025 & 2030
- TABLE 269: Latin America Recent Past, Current & Future Analysis for Temperature Detection Screens by Technology - Non-Contact Infrared Technology and Thermal Imaging Systems - Independent Analysis of Annual Sales in US$ Thousand for the Years 2024 through 2030 and % CAGR
- TABLE 270: Latin America Historic Review for Temperature Detection Screens by Technology - Non-Contact Infrared Technology and Thermal Imaging Systems Markets - Independent Analysis of Annual Sales in US$ Thousand for Years 2015 through 2023 and % CAGR
- TABLE 271: Latin America 15-Year Perspective for Temperature Detection Screens by Technology - Percentage Breakdown of Value Sales for Non-Contact Infrared Technology and Thermal Imaging Systems for the Years 2015, 2025 & 2030
- TABLE 272: Latin America Recent Past, Current & Future Analysis for Temperature Detection Screens by Application - Living Beings, Equipment / Machines and Other Applications - Independent Analysis of Annual Sales in US$ Thousand for the Years 2024 through 2030 and % CAGR
- TABLE 273: Latin America Historic Review for Temperature Detection Screens by Application - Living Beings, Equipment / Machines and Other Applications Markets - Independent Analysis of Annual Sales in US$ Thousand for Years 2015 through 2023 and % CAGR
- TABLE 274: Latin America 15-Year Perspective for Temperature Detection Screens by Application - Percentage Breakdown of Value Sales for Living Beings, Equipment / Machines and Other Applications for the Years 2015, 2025 & 2030
- ARGENTINA
- TABLE 275: Argentina Recent Past, Current & Future Analysis for Temperature Detection Screens by Platform - Handheld / Portable and Smart / Fixed Position - Independent Analysis of Annual Sales in US$ Thousand for the Years 2024 through 2030 and % CAGR
- TABLE 276: Argentina Historic Review for Temperature Detection Screens by Platform - Handheld / Portable and Smart / Fixed Position Markets - Independent Analysis of Annual Sales in US$ Thousand for Years 2015 through 2023 and % CAGR
- TABLE 277: Argentina 15-Year Perspective for Temperature Detection Screens by Platform - Percentage Breakdown of Value Sales for Handheld / Portable and Smart / Fixed Position for the Years 2015, 2025 & 2030
- TABLE 278: Argentina Recent Past, Current & Future Analysis for Temperature Detection Screens by Vertical - Military & Defense, Transportation & Logistics, Power Generation, Oil & Gas, Manufacturing, Other Verticals, Healthcare & Life Sciences and Residential & Commercial Buildings - Independent Analysis of Annual Sales in US$ Thousand for the Years 2024 through 2030 and % CAGR
- TABLE 279: Argentina Historic Review for Temperature Detection Screens by Vertical - Military & Defense, Transportation & Logistics, Power Generation, Oil & Gas, Manufacturing, Other Verticals, Healthcare & Life Sciences and Residential & Commercial Buildings Markets - Independent Analysis of Annual Sales in US$ Thousand for Years 2015 through 2023 and % CAGR
- TABLE 280: Argentina 15-Year Perspective for Temperature Detection Screens by Vertical - Percentage Breakdown of Value Sales for Military & Defense, Transportation & Logistics, Power Generation, Oil & Gas, Manufacturing, Other Verticals, Healthcare & Life Sciences and Residential & Commercial Buildings for the Years 2015, 2025 & 2030
- TABLE 281: Argentina Recent Past, Current & Future Analysis for Temperature Detection Screens by Technology - Non-Contact Infrared Technology and Thermal Imaging Systems - Independent Analysis of Annual Sales in US$ Thousand for the Years 2024 through 2030 and % CAGR
- TABLE 282: Argentina Historic Review for Temperature Detection Screens by Technology - Non-Contact Infrared Technology and Thermal Imaging Systems Markets - Independent Analysis of Annual Sales in US$ Thousand for Years 2015 through 2023 and % CAGR
- TABLE 283: Argentina 15-Year Perspective for Temperature Detection Screens by Technology - Percentage Breakdown of Value Sales for Non-Contact Infrared Technology and Thermal Imaging Systems for the Years 2015, 2025 & 2030
- TABLE 284: Argentina Recent Past, Current & Future Analysis for Temperature Detection Screens by Application - Living Beings, Equipment / Machines and Other Applications - Independent Analysis of Annual Sales in US$ Thousand for the Years 2024 through 2030 and % CAGR
- TABLE 285: Argentina Historic Review for Temperature Detection Screens by Application - Living Beings, Equipment / Machines and Other Applications Markets - Independent Analysis of Annual Sales in US$ Thousand for Years 2015 through 2023 and % CAGR
- TABLE 286: Argentina 15-Year Perspective for Temperature Detection Screens by Application - Percentage Breakdown of Value Sales for Living Beings, Equipment / Machines and Other Applications for the Years 2015, 2025 & 2030
- BRAZIL
- TABLE 287: Brazil Recent Past, Current & Future Analysis for Temperature Detection Screens by Platform - Handheld / Portable and Smart / Fixed Position - Independent Analysis of Annual Sales in US$ Thousand for the Years 2024 through 2030 and % CAGR
- TABLE 288: Brazil Historic Review for Temperature Detection Screens by Platform - Handheld / Portable and Smart / Fixed Position Markets - Independent Analysis of Annual Sales in US$ Thousand for Years 2015 through 2023 and % CAGR
- TABLE 289: Brazil 15-Year Perspective for Temperature Detection Screens by Platform - Percentage Breakdown of Value Sales for Handheld / Portable and Smart / Fixed Position for the Years 2015, 2025 & 2030
- TABLE 290: Brazil Recent Past, Current & Future Analysis for Temperature Detection Screens by Vertical - Military & Defense, Transportation & Logistics, Power Generation, Oil & Gas, Manufacturing, Other Verticals, Healthcare & Life Sciences and Residential & Commercial Buildings - Independent Analysis of Annual Sales in US$ Thousand for the Years 2024 through 2030 and % CAGR
- TABLE 291: Brazil Historic Review for Temperature Detection Screens by Vertical - Military & Defense, Transportation & Logistics, Power Generation, Oil & Gas, Manufacturing, Other Verticals, Healthcare & Life Sciences and Residential & Commercial Buildings Markets - Independent Analysis of Annual Sales in US$ Thousand for Years 2015 through 2023 and % CAGR
- TABLE 292: Brazil 15-Year Perspective for Temperature Detection Screens by Vertical - Percentage Breakdown of Value Sales for Military & Defense, Transportation & Logistics, Power Generation, Oil & Gas, Manufacturing, Other Verticals, Healthcare & Life Sciences and Residential & Commercial Buildings for the Years 2015, 2025 & 2030
- TABLE 293: Brazil Recent Past, Current & Future Analysis for Temperature Detection Screens by Technology - Non-Contact Infrared Technology and Thermal Imaging Systems - Independent Analysis of Annual Sales in US$ Thousand for the Years 2024 through 2030 and % CAGR
- TABLE 294: Brazil Historic Review for Temperature Detection Screens by Technology - Non-Contact Infrared Technology and Thermal Imaging Systems Markets - Independent Analysis of Annual Sales in US$ Thousand for Years 2015 through 2023 and % CAGR
- TABLE 295: Brazil 15-Year Perspective for Temperature Detection Screens by Technology - Percentage Breakdown of Value Sales for Non-Contact Infrared Technology and Thermal Imaging Systems for the Years 2015, 2025 & 2030
- TABLE 296: Brazil Recent Past, Current & Future Analysis for Temperature Detection Screens by Application - Living Beings, Equipment / Machines and Other Applications - Independent Analysis of Annual Sales in US$ Thousand for the Years 2024 through 2030 and % CAGR
- TABLE 297: Brazil Historic Review for Temperature Detection Screens by Application - Living Beings, Equipment / Machines and Other Applications Markets - Independent Analysis of Annual Sales in US$ Thousand for Years 2015 through 2023 and % CAGR
- TABLE 298: Brazil 15-Year Perspective for Temperature Detection Screens by Application - Percentage Breakdown of Value Sales for Living Beings, Equipment / Machines and Other Applications for the Years 2015, 2025 & 2030
- MEXICO
- TABLE 299: Mexico Recent Past, Current & Future Analysis for Temperature Detection Screens by Platform - Handheld / Portable and Smart / Fixed Position - Independent Analysis of Annual Sales in US$ Thousand for the Years 2024 through 2030 and % CAGR
- TABLE 300: Mexico Historic Review for Temperature Detection Screens by Platform - Handheld / Portable and Smart / Fixed Position Markets - Independent Analysis of Annual Sales in US$ Thousand for Years 2015 through 2023 and % CAGR
- TABLE 301: Mexico 15-Year Perspective for Temperature Detection Screens by Platform - Percentage Breakdown of Value Sales for Handheld / Portable and Smart / Fixed Position for the Years 2015, 2025 & 2030
- TABLE 302: Mexico Recent Past, Current & Future Analysis for Temperature Detection Screens by Vertical - Military & Defense, Transportation & Logistics, Power Generation, Oil & Gas, Manufacturing, Other Verticals, Healthcare & Life Sciences and Residential & Commercial Buildings - Independent Analysis of Annual Sales in US$ Thousand for the Years 2024 through 2030 and % CAGR
- TABLE 303: Mexico Historic Review for Temperature Detection Screens by Vertical - Military & Defense, Transportation & Logistics, Power Generation, Oil & Gas, Manufacturing, Other Verticals, Healthcare & Life Sciences and Residential & Commercial Buildings Markets - Independent Analysis of Annual Sales in US$ Thousand for Years 2015 through 2023 and % CAGR
- TABLE 304: Mexico 15-Year Perspective for Temperature Detection Screens by Vertical - Percentage Breakdown of Value Sales for Military & Defense, Transportation & Logistics, Power Generation, Oil & Gas, Manufacturing, Other Verticals, Healthcare & Life Sciences and Residential & Commercial Buildings for the Years 2015, 2025 & 2030
- TABLE 305: Mexico Recent Past, Current & Future Analysis for Temperature Detection Screens by Technology - Non-Contact Infrared Technology and Thermal Imaging Systems - Independent Analysis of Annual Sales in US$ Thousand for the Years 2024 through 2030 and % CAGR
- TABLE 306: Mexico Historic Review for Temperature Detection Screens by Technology - Non-Contact Infrared Technology and Thermal Imaging Systems Markets - Independent Analysis of Annual Sales in US$ Thousand for Years 2015 through 2023 and % CAGR
- TABLE 307: Mexico 15-Year Perspective for Temperature Detection Screens by Technology - Percentage Breakdown of Value Sales for Non-Contact Infrared Technology and Thermal Imaging Systems for the Years 2015, 2025 & 2030
- TABLE 308: Mexico Recent Past, Current & Future Analysis for Temperature Detection Screens by Application - Living Beings, Equipment / Machines and Other Applications - Independent Analysis of Annual Sales in US$ Thousand for the Years 2024 through 2030 and % CAGR
- TABLE 309: Mexico Historic Review for Temperature Detection Screens by Application - Living Beings, Equipment / Machines and Other Applications Markets - Independent Analysis of Annual Sales in US$ Thousand for Years 2015 through 2023 and % CAGR
- TABLE 310: Mexico 15-Year Perspective for Temperature Detection Screens by Application - Percentage Breakdown of Value Sales for Living Beings, Equipment / Machines and Other Applications for the Years 2015, 2025 & 2030
- REST OF LATIN AMERICA
- TABLE 311: Rest of Latin America Recent Past, Current & Future Analysis for Temperature Detection Screens by Platform - Handheld / Portable and Smart / Fixed Position - Independent Analysis of Annual Sales in US$ Thousand for the Years 2024 through 2030 and % CAGR
- TABLE 312: Rest of Latin America Historic Review for Temperature Detection Screens by Platform - Handheld / Portable and Smart / Fixed Position Markets - Independent Analysis of Annual Sales in US$ Thousand for Years 2015 through 2023 and % CAGR
- TABLE 313: Rest of Latin America 15-Year Perspective for Temperature Detection Screens by Platform - Percentage Breakdown of Value Sales for Handheld / Portable and Smart / Fixed Position for the Years 2015, 2025 & 2030
- TABLE 314: Rest of Latin America Recent Past, Current & Future Analysis for Temperature Detection Screens by Vertical - Military & Defense, Transportation & Logistics, Power Generation, Oil & Gas, Manufacturing, Other Verticals, Healthcare & Life Sciences and Residential & Commercial Buildings - Independent Analysis of Annual Sales in US$ Thousand for the Years 2024 through 2030 and % CAGR
- TABLE 315: Rest of Latin America Historic Review for Temperature Detection Screens by Vertical - Military & Defense, Transportation & Logistics, Power Generation, Oil & Gas, Manufacturing, Other Verticals, Healthcare & Life Sciences and Residential & Commercial Buildings Markets - Independent Analysis of Annual Sales in US$ Thousand for Years 2015 through 2023 and % CAGR
- TABLE 316: Rest of Latin America 15-Year Perspective for Temperature Detection Screens by Vertical - Percentage Breakdown of Value Sales for Military & Defense, Transportation & Logistics, Power Generation, Oil & Gas, Manufacturing, Other Verticals, Healthcare & Life Sciences and Residential & Commercial Buildings for the Years 2015, 2025 & 2030
- TABLE 317: Rest of Latin America Recent Past, Current & Future Analysis for Temperature Detection Screens by Technology - Non-Contact Infrared Technology and Thermal Imaging Systems - Independent Analysis of Annual Sales in US$ Thousand for the Years 2024 through 2030 and % CAGR
- TABLE 318: Rest of Latin America Historic Review for Temperature Detection Screens by Technology - Non-Contact Infrared Technology and Thermal Imaging Systems Markets - Independent Analysis of Annual Sales in US$ Thousand for Years 2015 through 2023 and % CAGR
- TABLE 319: Rest of Latin America 15-Year Perspective for Temperature Detection Screens by Technology - Percentage Breakdown of Value Sales for Non-Contact Infrared Technology and Thermal Imaging Systems for the Years 2015, 2025 & 2030
- TABLE 320: Rest of Latin America Recent Past, Current & Future Analysis for Temperature Detection Screens by Application - Living Beings, Equipment / Machines and Other Applications - Independent Analysis of Annual Sales in US$ Thousand for the Years 2024 through 2030 and % CAGR
- TABLE 321: Rest of Latin America Historic Review for Temperature Detection Screens by Application - Living Beings, Equipment / Machines and Other Applications Markets - Independent Analysis of Annual Sales in US$ Thousand for Years 2015 through 2023 and % CAGR
- TABLE 322: Rest of Latin America 15-Year Perspective for Temperature Detection Screens by Application - Percentage Breakdown of Value Sales for Living Beings, Equipment / Machines and Other Applications for the Years 2015, 2025 & 2030
- MIDDLE EAST
- Temperature Detection Screens Market Presence - Strong/Active/Niche/Trivial - Key Competitors in Middle East for 2025 (E)
- TABLE 323: Middle East Recent Past, Current & Future Analysis for Temperature Detection Screens by Geographic Region - Iran, Israel, Saudi Arabia, UAE and Rest of Middle East Markets - Independent Analysis of Annual Sales in US$ Thousand for Years 2024 through 2030 and % CAGR
- TABLE 324: Middle East Historic Review for Temperature Detection Screens by Geographic Region - Iran, Israel, Saudi Arabia, UAE and Rest of Middle East Markets - Independent Analysis of Annual Sales in US$ Thousand for Years 2015 through 2023 and % CAGR
- TABLE 325: Middle East 15-Year Perspective for Temperature Detection Screens by Geographic Region - Percentage Breakdown of Value Sales for Iran, Israel, Saudi Arabia, UAE and Rest of Middle East Markets for Years 2015, 2025 & 2030
- TABLE 326: Middle East Recent Past, Current & Future Analysis for Temperature Detection Screens by Platform - Handheld / Portable and Smart / Fixed Position - Independent Analysis of Annual Sales in US$ Thousand for the Years 2024 through 2030 and % CAGR
- TABLE 327: Middle East Historic Review for Temperature Detection Screens by Platform - Handheld / Portable and Smart / Fixed Position Markets - Independent Analysis of Annual Sales in US$ Thousand for Years 2015 through 2023 and % CAGR
- TABLE 328: Middle East 15-Year Perspective for Temperature Detection Screens by Platform - Percentage Breakdown of Value Sales for Handheld / Portable and Smart / Fixed Position for the Years 2015, 2025 & 2030
- TABLE 329: Middle East Recent Past, Current & Future Analysis for Temperature Detection Screens by Vertical - Military & Defense, Transportation & Logistics, Power Generation, Oil & Gas, Manufacturing, Other Verticals, Healthcare & Life Sciences and Residential & Commercial Buildings - Independent Analysis of Annual Sales in US$ Thousand for the Years 2024 through 2030 and % CAGR
- TABLE 330: Middle East Historic Review for Temperature Detection Screens by Vertical - Military & Defense, Transportation & Logistics, Power Generation, Oil & Gas, Manufacturing, Other Verticals, Healthcare & Life Sciences and Residential & Commercial Buildings Markets - Independent Analysis of Annual Sales in US$ Thousand for Years 2015 through 2023 and % CAGR
- TABLE 331: Middle East 15-Year Perspective for Temperature Detection Screens by Vertical - Percentage Breakdown of Value Sales for Military & Defense, Transportation & Logistics, Power Generation, Oil & Gas, Manufacturing, Other Verticals, Healthcare & Life Sciences and Residential & Commercial Buildings for the Years 2015, 2025 & 2030
- TABLE 332: Middle East Recent Past, Current & Future Analysis for Temperature Detection Screens by Technology - Non-Contact Infrared Technology and Thermal Imaging Systems - Independent Analysis of Annual Sales in US$ Thousand for the Years 2024 through 2030 and % CAGR
- TABLE 333: Middle East Historic Review for Temperature Detection Screens by Technology - Non-Contact Infrared Technology and Thermal Imaging Systems Markets - Independent Analysis of Annual Sales in US$ Thousand for Years 2015 through 2023 and % CAGR
- TABLE 334: Middle East 15-Year Perspective for Temperature Detection Screens by Technology - Percentage Breakdown of Value Sales for Non-Contact Infrared Technology and Thermal Imaging Systems for the Years 2015, 2025 & 2030
- TABLE 335: Middle East Recent Past, Current & Future Analysis for Temperature Detection Screens by Application - Living Beings, Equipment / Machines and Other Applications - Independent Analysis of Annual Sales in US$ Thousand for the Years 2024 through 2030 and % CAGR
- TABLE 336: Middle East Historic Review for Temperature Detection Screens by Application - Living Beings, Equipment / Machines and Other Applications Markets - Independent Analysis of Annual Sales in US$ Thousand for Years 2015 through 2023 and % CAGR
- TABLE 337: Middle East 15-Year Perspective for Temperature Detection Screens by Application - Percentage Breakdown of Value Sales for Living Beings, Equipment / Machines and Other Applications for the Years 2015, 2025 & 2030
- IRAN
- TABLE 338: Iran Recent Past, Current & Future Analysis for Temperature Detection Screens by Platform - Handheld / Portable and Smart / Fixed Position - Independent Analysis of Annual Sales in US$ Thousand for the Years 2024 through 2030 and % CAGR
- TABLE 339: Iran Historic Review for Temperature Detection Screens by Platform - Handheld / Portable and Smart / Fixed Position Markets - Independent Analysis of Annual Sales in US$ Thousand for Years 2015 through 2023 and % CAGR
- TABLE 340: Iran 15-Year Perspective for Temperature Detection Screens by Platform - Percentage Breakdown of Value Sales for Handheld / Portable and Smart / Fixed Position for the Years 2015, 2025 & 2030
- TABLE 341: Iran Recent Past, Current & Future Analysis for Temperature Detection Screens by Vertical - Military & Defense, Transportation & Logistics, Power Generation, Oil & Gas, Manufacturing, Other Verticals, Healthcare & Life Sciences and Residential & Commercial Buildings - Independent Analysis of Annual Sales in US$ Thousand for the Years 2024 through 2030 and % CAGR
- TABLE 342: Iran Historic Review for Temperature Detection Screens by Vertical - Military & Defense, Transportation & Logistics, Power Generation, Oil & Gas, Manufacturing, Other Verticals, Healthcare & Life Sciences and Residential & Commercial Buildings Markets - Independent Analysis of Annual Sales in US$ Thousand for Years 2015 through 2023 and % CAGR
- TABLE 343: Iran 15-Year Perspective for Temperature Detection Screens by Vertical - Percentage Breakdown of Value Sales for Military & Defense, Transportation & Logistics, Power Generation, Oil & Gas, Manufacturing, Other Verticals, Healthcare & Life Sciences and Residential & Commercial Buildings for the Years 2015, 2025 & 2030
- TABLE 344: Iran Recent Past, Current & Future Analysis for Temperature Detection Screens by Technology - Non-Contact Infrared Technology and Thermal Imaging Systems - Independent Analysis of Annual Sales in US$ Thousand for the Years 2024 through 2030 and % CAGR
- TABLE 345: Iran Historic Review for Temperature Detection Screens by Technology - Non-Contact Infrared Technology and Thermal Imaging Systems Markets - Independent Analysis of Annual Sales in US$ Thousand for Years 2015 through 2023 and % CAGR
- TABLE 346: Iran 15-Year Perspective for Temperature Detection Screens by Technology - Percentage Breakdown of Value Sales for Non-Contact Infrared Technology and Thermal Imaging Systems for the Years 2015, 2025 & 2030
- TABLE 347: Iran Recent Past, Current & Future Analysis for Temperature Detection Screens by Application - Living Beings, Equipment / Machines and Other Applications - Independent Analysis of Annual Sales in US$ Thousand for the Years 2024 through 2030 and % CAGR
- TABLE 348: Iran Historic Review for Temperature Detection Screens by Application - Living Beings, Equipment / Machines and Other Applications Markets - Independent Analysis of Annual Sales in US$ Thousand for Years 2015 through 2023 and % CAGR
- TABLE 349: Iran 15-Year Perspective for Temperature Detection Screens by Application - Percentage Breakdown of Value Sales for Living Beings, Equipment / Machines and Other Applications for the Years 2015, 2025 & 2030
- ISRAEL
- TABLE 350: Israel Recent Past, Current & Future Analysis for Temperature Detection Screens by Platform - Handheld / Portable and Smart / Fixed Position - Independent Analysis of Annual Sales in US$ Thousand for the Years 2024 through 2030 and % CAGR
- TABLE 351: Israel Historic Review for Temperature Detection Screens by Platform - Handheld / Portable and Smart / Fixed Position Markets - Independent Analysis of Annual Sales in US$ Thousand for Years 2015 through 2023 and % CAGR
- TABLE 352: Israel 15-Year Perspective for Temperature Detection Screens by Platform - Percentage Breakdown of Value Sales for Handheld / Portable and Smart / Fixed Position for the Years 2015, 2025 & 2030
- TABLE 353: Israel Recent Past, Current & Future Analysis for Temperature Detection Screens by Vertical - Military & Defense, Transportation & Logistics, Power Generation, Oil & Gas, Manufacturing, Other Verticals, Healthcare & Life Sciences and Residential & Commercial Buildings - Independent Analysis of Annual Sales in US$ Thousand for the Years 2024 through 2030 and % CAGR
- TABLE 354: Israel Historic Review for Temperature Detection Screens by Vertical - Military & Defense, Transportation & Logistics, Power Generation, Oil & Gas, Manufacturing, Other Verticals, Healthcare & Life Sciences and Residential & Commercial Buildings Markets - Independent Analysis of Annual Sales in US$ Thousand for Years 2015 through 2023 and % CAGR
- TABLE 355: Israel 15-Year Perspective for Temperature Detection Screens by Vertical - Percentage Breakdown of Value Sales for Military & Defense, Transportation & Logistics, Power Generation, Oil & Gas, Manufacturing, Other Verticals, Healthcare & Life Sciences and Residential & Commercial Buildings for the Years 2015, 2025 & 2030
- TABLE 356: Israel Recent Past, Current & Future Analysis for Temperature Detection Screens by Technology - Non-Contact Infrared Technology and Thermal Imaging Systems - Independent Analysis of Annual Sales in US$ Thousand for the Years 2024 through 2030 and % CAGR
- TABLE 357: Israel Historic Review for Temperature Detection Screens by Technology - Non-Contact Infrared Technology and Thermal Imaging Systems Markets - Independent Analysis of Annual Sales in US$ Thousand for Years 2015 through 2023 and % CAGR
- TABLE 358: Israel 15-Year Perspective for Temperature Detection Screens by Technology - Percentage Breakdown of Value Sales for Non-Contact Infrared Technology and Thermal Imaging Systems for the Years 2015, 2025 & 2030
- TABLE 359: Israel Recent Past, Current & Future Analysis for Temperature Detection Screens by Application - Living Beings, Equipment / Machines and Other Applications - Independent Analysis of Annual Sales in US$ Thousand for the Years 2024 through 2030 and % CAGR
- TABLE 360: Israel Historic Review for Temperature Detection Screens by Application - Living Beings, Equipment / Machines and Other Applications Markets - Independent Analysis of Annual Sales in US$ Thousand for Years 2015 through 2023 and % CAGR
- TABLE 361: Israel 15-Year Perspective for Temperature Detection Screens by Application - Percentage Breakdown of Value Sales for Living Beings, Equipment / Machines and Other Applications for the Years 2015, 2025 & 2030
- SAUDI ARABIA
- TABLE 362: Saudi Arabia Recent Past, Current & Future Analysis for Temperature Detection Screens by Platform - Handheld / Portable and Smart / Fixed Position - Independent Analysis of Annual Sales in US$ Thousand for the Years 2024 through 2030 and % CAGR
- TABLE 363: Saudi Arabia Historic Review for Temperature Detection Screens by Platform - Handheld / Portable and Smart / Fixed Position Markets - Independent Analysis of Annual Sales in US$ Thousand for Years 2015 through 2023 and % CAGR
- TABLE 364: Saudi Arabia 15-Year Perspective for Temperature Detection Screens by Platform - Percentage Breakdown of Value Sales for Handheld / Portable and Smart / Fixed Position for the Years 2015, 2025 & 2030
- TABLE 365: Saudi Arabia Recent Past, Current & Future Analysis for Temperature Detection Screens by Vertical - Military & Defense, Transportation & Logistics, Power Generation, Oil & Gas, Manufacturing, Other Verticals, Healthcare & Life Sciences and Residential & Commercial Buildings - Independent Analysis of Annual Sales in US$ Thousand for the Years 2024 through 2030 and % CAGR
- TABLE 366: Saudi Arabia Historic Review for Temperature Detection Screens by Vertical - Military & Defense, Transportation & Logistics, Power Generation, Oil & Gas, Manufacturing, Other Verticals, Healthcare & Life Sciences and Residential & Commercial Buildings Markets - Independent Analysis of Annual Sales in US$ Thousand for Years 2015 through 2023 and % CAGR
- TABLE 367: Saudi Arabia 15-Year Perspective for Temperature Detection Screens by Vertical - Percentage Breakdown of Value Sales for Military & Defense, Transportation & Logistics, Power Generation, Oil & Gas, Manufacturing, Other Verticals, Healthcare & Life Sciences and Residential & Commercial Buildings for the Years 2015, 2025 & 2030
- TABLE 368: Saudi Arabia Recent Past, Current & Future Analysis for Temperature Detection Screens by Technology - Non-Contact Infrared Technology and Thermal Imaging Systems - Independent Analysis of Annual Sales in US$ Thousand for the Years 2024 through 2030 and % CAGR
- TABLE 369: Saudi Arabia Historic Review for Temperature Detection Screens by Technology - Non-Contact Infrared Technology and Thermal Imaging Systems Markets - Independent Analysis of Annual Sales in US$ Thousand for Years 2015 through 2023 and % CAGR
- TABLE 370: Saudi Arabia 15-Year Perspective for Temperature Detection Screens by Technology - Percentage Breakdown of Value Sales for Non-Contact Infrared Technology and Thermal Imaging Systems for the Years 2015, 2025 & 2030
- TABLE 371: Saudi Arabia Recent Past, Current & Future Analysis for Temperature Detection Screens by Application - Living Beings, Equipment / Machines and Other Applications - Independent Analysis of Annual Sales in US$ Thousand for the Years 2024 through 2030 and % CAGR
- TABLE 372: Saudi Arabia Historic Review for Temperature Detection Screens by Application - Living Beings, Equipment / Machines and Other Applications Markets - Independent Analysis of Annual Sales in US$ Thousand for Years 2015 through 2023 and % CAGR
- TABLE 373: Saudi Arabia 15-Year Perspective for Temperature Detection Screens by Application - Percentage Breakdown of Value Sales for Living Beings, Equipment / Machines and Other Applications for the Years 2015, 2025 & 2030
- UNITED ARAB EMIRATES
- TABLE 374: UAE Recent Past, Current & Future Analysis for Temperature Detection Screens by Platform - Handheld / Portable and Smart / Fixed Position - Independent Analysis of Annual Sales in US$ Thousand for the Years 2024 through 2030 and % CAGR
- TABLE 375: UAE Historic Review for Temperature Detection Screens by Platform - Handheld / Portable and Smart / Fixed Position Markets - Independent Analysis of Annual Sales in US$ Thousand for Years 2015 through 2023 and % CAGR
- TABLE 376: UAE 15-Year Perspective for Temperature Detection Screens by Platform - Percentage Breakdown of Value Sales for Handheld / Portable and Smart / Fixed Position for the Years 2015, 2025 & 2030
- TABLE 377: UAE Recent Past, Current & Future Analysis for Temperature Detection Screens by Vertical - Military & Defense, Transportation & Logistics, Power Generation, Oil & Gas, Manufacturing, Other Verticals, Healthcare & Life Sciences and Residential & Commercial Buildings - Independent Analysis of Annual Sales in US$ Thousand for the Years 2024 through 2030 and % CAGR
- TABLE 378: UAE Historic Review for Temperature Detection Screens by Vertical - Military & Defense, Transportation & Logistics, Power Generation, Oil & Gas, Manufacturing, Other Verticals, Healthcare & Life Sciences and Residential & Commercial Buildings Markets - Independent Analysis of Annual Sales in US$ Thousand for Years 2015 through 2023 and % CAGR
- TABLE 379: UAE 15-Year Perspective for Temperature Detection Screens by Vertical - Percentage Breakdown of Value Sales for Military & Defense, Transportation & Logistics, Power Generation, Oil & Gas, Manufacturing, Other Verticals, Healthcare & Life Sciences and Residential & Commercial Buildings for the Years 2015, 2025 & 2030
- TABLE 380: UAE Recent Past, Current & Future Analysis for Temperature Detection Screens by Technology - Non-Contact Infrared Technology and Thermal Imaging Systems - Independent Analysis of Annual Sales in US$ Thousand for the Years 2024 through 2030 and % CAGR
- TABLE 381: UAE Historic Review for Temperature Detection Screens by Technology - Non-Contact Infrared Technology and Thermal Imaging Systems Markets - Independent Analysis of Annual Sales in US$ Thousand for Years 2015 through 2023 and % CAGR
- TABLE 382: UAE 15-Year Perspective for Temperature Detection Screens by Technology - Percentage Breakdown of Value Sales for Non-Contact Infrared Technology and Thermal Imaging Systems for the Years 2015, 2025 & 2030
- TABLE 383: UAE Recent Past, Current & Future Analysis for Temperature Detection Screens by Application - Living Beings, Equipment / Machines and Other Applications - Independent Analysis of Annual Sales in US$ Thousand for the Years 2024 through 2030 and % CAGR
- TABLE 384: UAE Historic Review for Temperature Detection Screens by Application - Living Beings, Equipment / Machines and Other Applications Markets - Independent Analysis of Annual Sales in US$ Thousand for Years 2015 through 2023 and % CAGR
- TABLE 385: UAE 15-Year Perspective for Temperature Detection Screens by Application - Percentage Breakdown of Value Sales for Living Beings, Equipment / Machines and Other Applications for the Years 2015, 2025 & 2030
- REST OF MIDDLE EAST
- TABLE 386: Rest of Middle East Recent Past, Current & Future Analysis for Temperature Detection Screens by Platform - Handheld / Portable and Smart / Fixed Position - Independent Analysis of Annual Sales in US$ Thousand for the Years 2024 through 2030 and % CAGR
- TABLE 387: Rest of Middle East Historic Review for Temperature Detection Screens by Platform - Handheld / Portable and Smart / Fixed Position Markets - Independent Analysis of Annual Sales in US$ Thousand for Years 2015 through 2023 and % CAGR
- TABLE 388: Rest of Middle East 15-Year Perspective for Temperature Detection Screens by Platform - Percentage Breakdown of Value Sales for Handheld / Portable and Smart / Fixed Position for the Years 2015, 2025 & 2030
- TABLE 389: Rest of Middle East Recent Past, Current & Future Analysis for Temperature Detection Screens by Vertical - Military & Defense, Transportation & Logistics, Power Generation, Oil & Gas, Manufacturing, Other Verticals, Healthcare & Life Sciences and Residential & Commercial Buildings - Independent Analysis of Annual Sales in US$ Thousand for the Years 2024 through 2030 and % CAGR
- TABLE 390: Rest of Middle East Historic Review for Temperature Detection Screens by Vertical - Military & Defense, Transportation & Logistics, Power Generation, Oil & Gas, Manufacturing, Other Verticals, Healthcare & Life Sciences and Residential & Commercial Buildings Markets - Independent Analysis of Annual Sales in US$ Thousand for Years 2015 through 2023 and % CAGR
- TABLE 391: Rest of Middle East 15-Year Perspective for Temperature Detection Screens by Vertical - Percentage Breakdown of Value Sales for Military & Defense, Transportation & Logistics, Power Generation, Oil & Gas, Manufacturing, Other Verticals, Healthcare & Life Sciences and Residential & Commercial Buildings for the Years 2015, 2025 & 2030
- TABLE 392: Rest of Middle East Recent Past, Current & Future Analysis for Temperature Detection Screens by Technology - Non-Contact Infrared Technology and Thermal Imaging Systems - Independent Analysis of Annual Sales in US$ Thousand for the Years 2024 through 2030 and % CAGR
- TABLE 393: Rest of Middle East Historic Review for Temperature Detection Screens by Technology - Non-Contact Infrared Technology and Thermal Imaging Systems Markets - Independent Analysis of Annual Sales in US$ Thousand for Years 2015 through 2023 and % CAGR
- TABLE 394: Rest of Middle East 15-Year Perspective for Temperature Detection Screens by Technology - Percentage Breakdown of Value Sales for Non-Contact Infrared Technology and Thermal Imaging Systems for the Years 2015, 2025 & 2030
- TABLE 395: Rest of Middle East Recent Past, Current & Future Analysis for Temperature Detection Screens by Application - Living Beings, Equipment / Machines and Other Applications - Independent Analysis of Annual Sales in US$ Thousand for the Years 2024 through 2030 and % CAGR
- TABLE 396: Rest of Middle East Historic Review for Temperature Detection Screens by Application - Living Beings, Equipment / Machines and Other Applications Markets - Independent Analysis of Annual Sales in US$ Thousand for Years 2015 through 2023 and % CAGR
- TABLE 397: Rest of Middle East 15-Year Perspective for Temperature Detection Screens by Application - Percentage Breakdown of Value Sales for Living Beings, Equipment / Machines and Other Applications for the Years 2015, 2025 & 2030
- AFRICA
- Temperature Detection Screens Market Presence - Strong/Active/Niche/Trivial - Key Competitors in Africa for 2025 (E)
- TABLE 398: Africa Recent Past, Current & Future Analysis for Temperature Detection Screens by Platform - Handheld / Portable and Smart / Fixed Position - Independent Analysis of Annual Sales in US$ Thousand for the Years 2024 through 2030 and % CAGR
- TABLE 399: Africa Historic Review for Temperature Detection Screens by Platform - Handheld / Portable and Smart / Fixed Position Markets - Independent Analysis of Annual Sales in US$ Thousand for Years 2015 through 2023 and % CAGR
- TABLE 400: Africa 15-Year Perspective for Temperature Detection Screens by Platform - Percentage Breakdown of Value Sales for Handheld / Portable and Smart / Fixed Position for the Years 2015, 2025 & 2030
- TABLE 401: Africa Recent Past, Current & Future Analysis for Temperature Detection Screens by Vertical - Military & Defense, Transportation & Logistics, Power Generation, Oil & Gas, Manufacturing, Other Verticals, Healthcare & Life Sciences and Residential & Commercial Buildings - Independent Analysis of Annual Sales in US$ Thousand for the Years 2024 through 2030 and % CAGR
- TABLE 402: Africa Historic Review for Temperature Detection Screens by Vertical - Military & Defense, Transportation & Logistics, Power Generation, Oil & Gas, Manufacturing, Other Verticals, Healthcare & Life Sciences and Residential & Commercial Buildings Markets - Independent Analysis of Annual Sales in US$ Thousand for Years 2015 through 2023 and % CAGR
- TABLE 403: Africa 15-Year Perspective for Temperature Detection Screens by Vertical - Percentage Breakdown of Value Sales for Military & Defense, Transportation & Logistics, Power Generation, Oil & Gas, Manufacturing, Other Verticals, Healthcare & Life Sciences and Residential & Commercial Buildings for the Years 2015, 2025 & 2030
- TABLE 404: Africa Recent Past, Current & Future Analysis for Temperature Detection Screens by Technology - Non-Contact Infrared Technology and Thermal Imaging Systems - Independent Analysis of Annual Sales in US$ Thousand for the Years 2024 through 2030 and % CAGR
- TABLE 405: Africa Historic Review for Temperature Detection Screens by Technology - Non-Contact Infrared Technology and Thermal Imaging Systems Markets - Independent Analysis of Annual Sales in US$ Thousand for Years 2015 through 2023 and % CAGR
- TABLE 406: Africa 15-Year Perspective for Temperature Detection Screens by Technology - Percentage Breakdown of Value Sales for Non-Contact Infrared Technology and Thermal Imaging Systems for the Years 2015, 2025 & 2030
- TABLE 407: Africa Recent Past, Current & Future Analysis for Temperature Detection Screens by Application - Living Beings, Equipment / Machines and Other Applications - Independent Analysis of Annual Sales in US$ Thousand for the Years 2024 through 2030 and % CAGR
- TABLE 408: Africa Historic Review for Temperature Detection Screens by Application - Living Beings, Equipment / Machines and Other Applications Markets - Independent Analysis of Annual Sales in US$ Thousand for Years 2015 through 2023 and % CAGR
- TABLE 409: Africa 15-Year Perspective for Temperature Detection Screens by Application - Percentage Breakdown of Value Sales for Living Beings, Equipment / Machines and Other Applications for the Years 2015, 2025 & 2030