|
시장보고서
상품코드
1511793
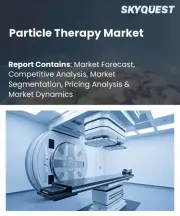
입자선 치료 시장 규모, 점유율, 동향 분석 리포트 : 치료 유형별, 시스템별, 용도별, 암 유형별, 지역별, 부문별 예측(2024-2030년)Particle Therapy Market Size, Share & Trends Analysis Report By Therapy Type (Proton Therapy, Heavy Ion Therapy), By System, By Application (Treatment, Research), By Cancer Type (Pediatric, Breast, Lung), By Region, And Segment Forecasts, 2024 - 2030 |
||||||
입자선 치료 시장의 성장과 동향 :
Grand View Research, Inc.의 최신 리포트에 따르면 세계의 입자선 치료 시장 규모는 2024-2030년 7.63%의 CAGR을 기록하며, 2030년까지 25억 5,000만 달러에 달할 것으로 예측되고 있습니다.
시장 성장의 주요 원인은 노인 인구 증가에 따른 암 유병률 증가입니다. 이 질병은 나이에 관계없이 발병할 수 있지만 나이가 들수록 발병 가능성이 크게 증가하며, GLOBOCAN 2022의 데이터에 따르면 암 환자의 약 53%가 65세 이상입니다. 이러한 상관관계는 세포 복구 과정이 더 이상 효율적이지 않고 특정 악성 종양 위험 요인이 축적되어 나이가 들어감에 따라 증가하기 때문인 것으로 추정됩니다.
따라서 각국 정부는 노인들이 보편적 의료보험의 추구에서 소외되지 않도록 하기 위해 노인 암 환자를 위한 변화를 촉진하는 계획을 마련해야 합니다. 암 환자와 간병인의 치료 완료에 대한 정부 지원 증가는 시장 성장을 가속할 것입니다. 예를 들어 2024년 4월 알바니아 정부는 암 지원 프로그램 보조금으로 16.5달러를 제공했으며, 현재 1차 모집을 시작했습니다. 이 프로그램은 호주 전역의 개인의 질병 결과를 개선하기 위한 것입니다. 이 보조금은 치료를 촉진하는 국내 소규모 조직을 지원하는 것을 목표로 하고 있습니다. 또한 국제암퇴치연맹(UICC)은 매년 2월 4일을 '세계 암의 날'로 지정하여 암과 치료법에 대한 인식을 높이고 있습니다.
이러한 노력은 예측 기간 중 입자선 치료에 대한 수요를 촉진하고 시장 성장을 가속할 것으로 예상됩니다. 컴퓨팅의 기술적 발전은 더 빠르고, 더 지능적이며, 더 유능한 치료 계획을 가져와 상시 영상 안내, 더 정확한 투약, 더 높은 선량 조사량을 가능하게 합니다. 그 결과 효율성이 향상되고 부작용이 감소했습니다. 선량 최적화 및 치료 계획은 첨단 컴퓨터 알고리즘에 의해 용이해졌습니다. 양성자 치료의 등장은 호흡과 같은 환자의 움직임으로 인한 문제를 극복하는 데 도움이 되었습니다. 또한 레이저 기술의 발전은 입자 과정과 상호 작용할 수있는 초고속 이중 광 펄스의 개발을 가능하게하여 방사광을 사용하여 초고속 원자내 운동을 추적하는 데 도움이 되었습니다.
또한 질병 진단 및 치료 센터의 설립이 증가하고 있는 것도 예측 기간 중 제품 수요를 촉진하고 있습니다. 예를 들어 2023년 2월 Apollo Proton Cancer Center는 인도에서 최첨단 종합 암 치료를 제공하기 위해 'Dr. APJ Abdul Kalam Therapy Bay'라는 이름의 양성자선 갠트리를 설립했습니다. 이 병원은 국내 최대 규모의 양성자 치료(PBT) 프로그램을 운영하며 환자를 치료하고 있으며, APCC는 중동 및 남아시아에서 최초이자 유일한 양성자 치료 센터입니다.
입자선 치료 시장 보고서 하이라이트
- 양성자 치료 분야는 높은 치료율, 부작용 감소, 높은 치료 지속률, 유병률 증가로 인해 2023년 가장 큰 점유율을 차지했습니다.
- 싱글룸 시스템 부문은 저렴한 비용, 소규모 병원 및 시설에서의 채택 증가 등 멀티룸 시스템에 비해 우위를 점하고 있으며, 예측 기간 중 가장 빠른 CAGR로 성장할 것으로 예상됩니다.
- 치료 부문은 병원 치료율, 다른 방법보다 입자선 치료를 선호하는 환자, 치료를 위해 병원을 방문하는 환자 증가로 인해 2023년 가장 큰 점유율을 차지할 것으로 예상됩니다.
- 소아암 분야는 전 세계 소아암 유병률 및 발생률 증가와 치료를 위한 입자선 치료 수요 증가로 인해 2023년 가장 큰 점유율을 차지할 것으로 예상됩니다.
- 북미가 2023년 세계 시장을 석권한 것은 첨단화된 의료 인프라, 높은 유병률, 유리한 규제 환경 등의 요인에 기인합니다.
목차
제1장 조사 방법과 범위
제2장 주요 요약
제3장 입자선 치료 시장 변수, 동향, 범위
- 시장 계통 전망
- 모시장 전망
- 관련/부수 시장 전망
- 시장 역학
- 시장 촉진요인 분석
- 시장 억제요인 분석
- 입자선 치료 시장 분석 툴
- 업계 분석 - Porter의 산업 분석
- PESTEL 분석
- 가격 분석
제4장 입자선 치료 시장 : 치료 추정·동향 분석
- 세계의 입자선 치료 시장 : 치료 유형별 대시보드
- 세계의 입자선 치료 시장 : 치료 유형별 변동 분석
- 세계의 입자선 치료 시장 : 치료 유형별, 매출별
- 양자선치료
- 중입자선 치료
제5장 입자선 치료 시장 : 시스템 추정·동향 분석
- 세계의 입자선 치료 시장 : 시스템별 대시보드
- 세계의 입자선 치료 시장 : 시스템별 변동 분석
- 세계의 입자선 치료 시장 : 시스템별, 매출별
- 싱글룸 시스템
- 멀티룸 시스템
제6장 입자선 치료 시장 : 용도 추정·동향 분석
- 세계의 입자선 치료 시장 : 용도별 대시보드
- 세계의 입자선 치료 시장 : 용도별 변동 분석
- 세계의 입자선 치료 시장 : 용도별, 매출별
- 치료
- 임상 조사
제7장 입자선 치료 시장 : 암 유형 추정·동향 분석
- 세계의 입자선 치료 시장 : 암 유형별 대시보드
- 세계의 입자선 치료 시장 : 암 유형별 변동 분석
- 세계의 입자선 치료 시장 : 암 유형별, 매출별
- 소아암
- 유방암
- 폐암
- 두경부암
- 기타
제8장 입자선 치료 시장 : 치료 유형, 시스템, 용도별 지역 추정·동향 분석
- 지역 대시보드
- 시장 규모, 예측 동향 분석, 2018-2030년 :
- 북미
- 유럽
- 아시아태평양
- 라틴아메리카
- 중동 및 아프리카
제9장 경쟁 구도
- 기업/경쟁의 분류
- 참가자 개요
- 재무의 개요
- 제품 벤치마킹
- 기업 시장 점유율 분석, 2023년
- 전략 매핑
- 기업 개요
- IBA Worldwide.
- Siemens Healthcare GmbH(Varian Medical Systems, Inc.)
- Hitachi Ltd
- Mevion Medical Systems.
- Provision Healthcare.
- Optivus Proton Therapy, Inc.
- Sumitomo Heavy Industries, Ltd.
- ProTom International.
- B dot Medical Inc.
- LeyBold.
- Advanced Oncotherapy Plc.
Particle Therapy Market Growth & Trends:
The global particle therapy market size is anticipated to reach USD 2.55 billion by 2030, registering a CAGR of 7.63% from 2024 to 2030, according to a new report by Grand View Research, Inc. The market growth is primarily driven by the increasing prevalence of cancer aided by the growing geriatric population. Any age can acquire the disease, but as people age, their chances of developing the disease increase significantly. According to GLOBOCAN 2022 data, approximately 53% of cancer patients were aged 65 years or older. This correlation is probably caused by less efficient cellular repair processes and the build-up of risk factors for particular malignancies, which rise with age.
Therefore, to ensure that older adults are not left behind in the pursuit of universal health coverage, governments will need to devise a plan to promote change for older adults with cancer. Increasing government support for cancer patients and their caregivers for treatment completion fuels the market's growth. For instance, in April 2024, the Albanese Government offered USD 16.5 for a Cancer Support Program grant, with the first round now open for application. This program will enhance disease outcomes for individuals all across Australia. The funding is intended to support small national organizations that promote treatment. Furthermore, the Union for International Cancer Control (UICC) celebrates 4th February as "World Cancer Day" every year to raise awareness about cancer and available options for treatment.
Such initiatives are expected to drive demand for particle beam treatment over the forecast period, driving market growth. Technological advancements in computing have resulted in faster, more intelligent, & more capable treatment planning and have enabled constant imaging guidance, more precise dosing, and delivery of higher doses. This has resulted in greater efficiency & fewer adverse effects. Dosage optimization and treatment planning have become easier owing to advanced computer algorithms. The advent of proton radiation therapy has helped overcome problems due to the movement of patients, such as during breathing. Furthermore, advances in laser technology enable the development of ultra-quick double-light pulses that can interact with the subatomic process, which helps in tracking ultrafast intra-atom motion using synchrotron radiation.
Moreover, the growing launch of disease diagnosis and treatment centers drives demand for products during the forecast period. For instance, in February 2023, the Apollo Proton Cancer Center launched a Proton Gantry named "Dr. APJ Abdul Kalam Therapy Bay" to offer the most advanced and comprehensive cancer care in India. The hospital administers the nation's largest Proton Beam Therapy (PBT) program to treat patients. APCC is the first and only proton therapy center in the Middle East and South Asia.
Particle Therapy Market Report Highlights:
- The proton therapy segment held the largest share in 2023 due to the disease's high treatment rate, decreased side effects, high treatment adherence rate, and growing prevalence
- The single-room systems segment is expected to grow at the fastest CAGR during the forecast period due to its advantages over multi-room systems, such as low cost, and increased adoption by smaller hospitals and facilities
- The treatment segment held the largest share in 2023 due to hospital treatment rates, patient preference for particle therapy over other methods, and an increasing number of patients visiting hospitals for treatment
- The pediatric cancer segment held the largest in 2023 owing to a rise in the prevalence and incidence of the disease worldwide and rising demand for particle therapy for its treatment
- North America dominated the global market in 2023 owing to factors advanced healthcare infrastructure, high disease prevalence, and a favorable regulatory environment
Table of Contents
Chapter 1. Methodology and Scope
- 1.1. Market Segmentation & Scope
- 1.2. Segment Definitions
- 1.2.1. Therapy Type
- 1.2.2. System
- 1.2.3. Application
- 1.2.4. Cancer Type
- 1.2.5. Regional scope
- 1.2.6. Estimates and forecasts timeline
- 1.3. Research Methodology
- 1.4. Information Procurement
- 1.4.1. Purchased database
- 1.4.2. GVR's internal database
- 1.4.3. Secondary sources
- 1.4.4. Primary research
- 1.4.5. Details of primary research
- 1.4.5.1. Data for primary interviews in North America
- 1.4.5.2. Data for primary interviews in Europe
- 1.4.5.3. Data for primary interviews in Asia Pacific
- 1.4.5.4. Data for primary interviews in Latin America
- 1.4.5.5. Data for Primary interviews in MEA
- 1.5. Information or Data Analysis
- 1.5.1. Data analysis models
- 1.6. Market Formulation & Validation
- 1.7. Model Details
- 1.7.1. Commodity flow analysis (Model 1)
- 1.7.2. Approach 1: Commodity flow approach
- 1.7.3. Volume price analysis (Model 2)
- 1.7.4. Approach 2: Volume price analysis
- 1.8. List of Secondary Sources
- 1.9. List of Primary Sources
- 1.10. Objectives
Chapter 2. Executive Summary
- 2.1. Market Outlook
- 2.2. Segment Outlook
- 2.2.1. Therapy type and system Outlook
- 2.2.2. Application and cancer type outlook
- 2.2.3. Regional outlook
- 2.3. Competitive Insights
Chapter 3. Particle Therapy Market Variables, Trends & Scope
- 3.1. Market Lineage Outlook
- 3.1.1. Parent market outlook
- 3.1.2. Related/ancillary market outlook
- 3.2. Market Dynamics
- 3.2.1. Market driver analysis
- 3.2.1.1. Growing prevalence of cancer
- 3.2.1.2. Increasing awareness about benefits of particle therapy
- 3.2.1.3. Rising geriatric population
- 3.2.1.4. Technological advancements in particle therapy
- 3.2.2. Market restraint analysis
- 3.2.2.1. Lack of skilled radiotherapy professionals
- 3.2.2.2. Stringent regulatory policies
- 3.2.2.3. Adverse effects of particle therapy
- 3.2.1. Market driver analysis
- 3.3. Particle Therapy Market Analysis Tools
- 3.3.1. Industry Analysis - Porter's
- 3.3.1.1. Supplier power
- 3.3.1.2. Buyer power
- 3.3.1.3. Substitution threat
- 3.3.1.4. Threat of new entrant
- 3.3.1.5. Competitive rivalry
- 3.3.2. PESTEL Analysis
- 3.3.2.1. Political landscape
- 3.3.2.2. Technological landscape
- 3.3.2.3. Economic landscape
- 3.3.3. Pricing Analysis
- 3.3.1. Industry Analysis - Porter's
Chapter 4. Particle Therapy Market: Therapy Estimates & Trend Analysis
- 4.1. Global Particle Therapy Market: Therapy Type Dashboard
- 4.2. Global Particle Therapy Market: Therapy Type Movement Analysis
- 4.3. Global Particle Therapy Market By Therapy Type, Revenue
- 4.4. Proton Therapy
- 4.4.1. Proton Therapy market estimates and forecasts 2018 to 2030 (USD Million)
- 4.5. Heavy Ion Therapy
- 4.5.1. Heavy Ion Therapy market estimates and forecasts 2018 to 2030 (USD Million)
Chapter 5. Particle Therapy Market: System Estimates & Trend Analysis
- 5.1. Global Particle Therapy Market: System Dashboard
- 5.2. Global Particle Therapy Market: System Movement Analysis
- 5.3. Global Particle Therapy Market By System, Revenue
- 5.4. Single Room Systems
- 5.4.1. Single room systems market estimates and forecasts 2018 to 2030 (USD Million)
- 5.5. Multi-room Systems
- 5.5.1. Multi-room systems market estimates and forecasts 2018 to 2030 (USD Million)
Chapter 6. Particle Therapy Market: Application Estimates & Trend Analysis
- 6.1. Global Particle Therapy Market: Application Dashboard
- 6.2. Global Particle Therapy Market: Application Movement Analysis
- 6.3. Global Particle Therapy Market By Application, Revenue
- 6.4. Treatment
- 6.4.1. Treatment market estimates and forecasts 2018 to 2030 (USD Million)
- 6.5. Clinical Research
- 6.5.1. Clinical research market estimates and forecasts 2018 to 2030 (USD Million)
Chapter 7. Particle Therapy Market: Cancer Type Estimates & Trend Analysis
- 7.1. Global Particle Therapy Market: Cancer Type Dashboard
- 7.2. Global Particle Therapy Market: Cancer Type Movement Analysis
- 7.3. Global Particle Therapy Market By Cancer Type, Revenue
- 7.4. Pediatric Cancer
- 7.4.1. Pediatric cancer market estimates and forecasts 2018 to 2030 (USD Million)
- 7.5. Breast Cancer
- 7.5.1. Breast Cancer market estimates and forecasts 2018 to 2030 (USD Million)
- 7.6. Lung Cancer
- 7.6.1. Lung cancer market estimates and forecasts 2018 to 2030 (USD Million)
- 7.7. Head and Neck Cancer
- 7.7.1. Head and neck cancer market estimates and forecasts 2018 to 2030 (USD Million)
- 7.8. Others
- 7.8.1. Others market estimates and forecasts 2018 to 2030 (USD Million)
Chapter 8. Particle Therapy Market: Regional Estimates & Trend Analysis By Therapy Type, System, and Application
- 8.1. Regional Dashboard
- 8.2. Market Size, & Forecasts Trend Analysis, 2018 to 2030:
- 8.3. North America
- 8.3.1. U.S.
- 8.3.1.1. Key country dynamics
- 8.3.1.2. Regulatory framework/ reimbursement structure
- 8.3.1.3. Competitive scenario
- 8.3.1.4. U.S. market estimates and forecasts 2018 to 2030 (USD Million)
- 8.3.2. Canada
- 8.3.2.1. Key country dynamics
- 8.3.2.2. Regulatory framework/ reimbursement structure
- 8.3.2.3. Competitive scenario
- 8.3.2.4. Canada market estimates and forecasts 2018 to 2030 (USD Million)
- 8.3.1. U.S.
- 8.4. Europe
- 8.4.1. UK
- 8.4.1.1. Key country dynamics
- 8.4.1.2. Regulatory framework/ reimbursement structure
- 8.4.1.3. Competitive scenario
- 8.4.1.4. UK market estimates and forecasts 2018 to 2030 (USD Million)
- 8.4.2. Germany
- 8.4.2.1. Key country dynamics
- 8.4.2.2. Regulatory framework/ reimbursement structure
- 8.4.2.3. Competitive scenario
- 8.4.2.4. Germany market estimates and forecasts 2018 to 2030 (USD Million)
- 8.4.3. France
- 8.4.3.1. Key country dynamics
- 8.4.3.2. Regulatory framework/ reimbursement structure
- 8.4.3.3. Competitive scenario
- 8.4.3.4. France market estimates and forecasts 2018 to 2030 (USD Million)
- 8.4.4. Italy
- 8.4.4.1. Key country dynamics
- 8.4.4.2. Regulatory framework/ reimbursement structure
- 8.4.4.3. Competitive scenario
- 8.4.4.4. Italy market estimates and forecasts 2018 to 2030 (USD Million)
- 8.4.5. Spain
- 8.4.5.1. Key country dynamics
- 8.4.5.2. Regulatory framework/ reimbursement structure
- 8.4.5.3. Competitive scenario
- 8.4.5.4. Spain market estimates and forecasts 2018 to 2030 (USD Million)
- 8.4.6. Norway
- 8.4.6.1. Key country dynamics
- 8.4.6.2. Regulatory framework/ reimbursement structure
- 8.4.6.3. Competitive scenario
- 8.4.6.4. Norway market estimates and forecasts 2018 to 2030 (USD Million)
- 8.4.7. Sweden
- 8.4.7.1. Key country dynamics
- 8.4.7.2. Regulatory framework/ reimbursement structure
- 8.4.7.3. Competitive scenario
- 8.4.7.4. Sweden market estimates and forecasts 2018 to 2030 (USD Million)
- 8.4.8. Denmark
- 8.4.8.1. Key country dynamics
- 8.4.8.2. Regulatory framework/ reimbursement structure
- 8.4.8.3. Competitive scenario
- 8.4.8.4. Denmark market estimates and forecasts 2018 to 2030 (USD Million)
- 8.4.1. UK
- 8.5. Asia Pacific
- 8.5.1. Japan
- 8.5.1.1. Key country dynamics
- 8.5.1.2. Regulatory framework/ reimbursement structure
- 8.5.1.3. Competitive scenario
- 8.5.1.4. Japan market estimates and forecasts 2018 to 2030 (USD Million)
- 8.5.2. China
- 8.5.2.1. Key country dynamics
- 8.5.2.2. Regulatory framework/ reimbursement structure
- 8.5.2.3. Competitive scenario
- 8.5.2.4. China market estimates and forecasts 2018 to 2030 (USD Million)
- 8.5.3. India
- 8.5.3.1. Key country dynamics
- 8.5.3.2. Regulatory framework/ reimbursement structure
- 8.5.3.3. Competitive scenario
- 8.5.3.4. India market estimates and forecasts 2018 to 2030 (USD Million)
- 8.5.4. Australia
- 8.5.4.1. Key country dynamics
- 8.5.4.2. Regulatory framework/ reimbursement structure
- 8.5.4.3. Competitive scenario
- 8.5.4.4. Australia market estimates and forecasts 2018 to 2030 (USD Million)
- 8.5.5. South Korea
- 8.5.5.1. Key country dynamics
- 8.5.5.2. Regulatory framework/ reimbursement structure
- 8.5.5.3. Competitive scenario
- 8.5.5.4. South Korea market estimates and forecasts 2018 to 2030 (USD Million)
- 8.5.6. Thailand
- 8.5.6.1. Key country dynamics
- 8.5.6.2. Regulatory framework/ reimbursement structure
- 8.5.6.3. Competitive scenario
- 8.5.6.4. Thailand market estimates and forecasts 2018 to 2030 (USD Million)
- 8.5.1. Japan
- 8.6. Latin America
- 8.6.1. Brazil
- 8.6.1.1. Key country dynamics
- 8.6.1.2. Regulatory framework/ reimbursement structure
- 8.6.1.3. Competitive scenario
- 8.6.1.4. Brazil market estimates and forecasts 2018 to 2030 (USD Million)
- 8.6.2. Mexico
- 8.6.2.1. Key country dynamics
- 8.6.2.2. Regulatory framework/ reimbursement structure
- 8.6.2.3. Competitive scenario
- 8.6.2.4. Mexico market estimates and forecasts 2018 to 2030 (USD Million)
- 8.6.3. Argentina
- 8.6.3.1. Key country dynamics
- 8.6.3.2. Regulatory framework/ reimbursement structure
- 8.6.3.3. Competitive scenario
- 8.6.3.4. Argentina market estimates and forecasts 2018 to 2030 (USD Million)
- 8.6.1. Brazil
- 8.7. MEA
- 8.7.1. South Africa
- 8.7.1.1. Key country dynamics
- 8.7.1.2. Regulatory framework/ reimbursement structure
- 8.7.1.3. Competitive scenario
- 8.7.1.4. South Africa market estimates and forecasts 2018 to 2030 (USD Million)
- 8.7.2. Saudi Arabia
- 8.7.2.1. Key country dynamics
- 8.7.2.2. Regulatory framework/ reimbursement structure
- 8.7.2.3. Competitive scenario
- 8.7.2.4. Saudi Arabia market estimates and forecasts 2018 to 2030 (USD Million)
- 8.7.3. UAE
- 8.7.3.1. Key country dynamics
- 8.7.3.2. Regulatory framework/ reimbursement structure
- 8.7.3.3. Competitive scenario
- 8.7.3.4. UAE market estimates and forecasts 2018 to 2030 (USD Million)
- 8.7.4. Kuwait
- 8.7.4.1. Key country dynamics
- 8.7.4.2. Regulatory framework/ reimbursement structure
- 8.7.4.3. Competitive scenario
- 8.7.4.4. Kuwait market estimates and forecasts 2018 to 2030 (USD Million)
- 8.7.1. South Africa
Chapter 9. Competitive Landscape
- 9.1. Company/Competition Categorization
- 9.2. Participant Overview
- 9.3. Financial Overview
- 9.4. Product Benchmarking
- 9.5. Company Market Share Analysis, 2023
- 9.6. Strategy Mapping
- 9.7. Company Profiles
- 9.7.1. IBA Worldwide.
- 9.7.1.1. Company overview
- 9.7.1.2. Financial performance
- 9.7.1.3. benchmarking
- 9.7.1.4. Strategic initiatives
- 9.7.2. Siemens Healthcare GmbH (Varian Medical Systems, Inc.)
- 9.7.2.1. Company overview
- 9.7.2.2. Financial performance
- 9.7.2.3. benchmarking
- 9.7.2.4. Strategic initiatives
- 9.7.3. Hitachi Ltd
- 9.7.3.1. Company overview
- 9.7.3.2. Financial performance
- 9.7.3.3. benchmarking
- 9.7.3.4. Strategic initiatives
- 9.7.4. Mevion Medical Systems.
- 9.7.4.1. Company overview
- 9.7.4.2. Financial performance
- 9.7.4.3. benchmarking
- 9.7.4.4. Strategic initiatives
- 9.7.5. Provision Healthcare.
- 9.7.5.1. Company overview
- 9.7.5.2. Financial performance
- 9.7.5.3. benchmarking
- 9.7.5.4. Strategic initiatives
- 9.7.6. Optivus Proton Therapy, Inc.
- 9.7.6.1. Company overview
- 9.7.6.2. Financial performance
- 9.7.6.3. benchmarking
- 9.7.6.4. Strategic initiatives
- 9.7.7. Sumitomo Heavy Industries, Ltd.
- 9.7.7.1. Company overview
- 9.7.7.2. Financial performance
- 9.7.7.3. benchmarking
- 9.7.7.4. Strategic initiatives
- 9.7.8. ProTom International.
- 9.7.8.1. Company overview
- 9.7.8.2. Financial performance
- 9.7.8.3. benchmarking
- 9.7.8.4. Strategic initiatives
- 9.7.9. B dot Medical Inc.
- 9.7.9.1. Company overview
- 9.7.9.2. Financial performance
- 9.7.9.3. benchmarking
- 9.7.9.4. Strategic initiatives
- 9.7.10. LeyBold.
- 9.7.10.1. Company overview
- 9.7.10.2. Financial performance
- 9.7.10.3. benchmarking
- 9.7.10.4. Strategic initiatives
- 9.7.11. Advanced Oncotherapy Plc.
- 9.7.11.1. Company overview
- 9.7.11.2. Financial performance
- 9.7.11.3. benchmarking
- 9.7.11.4. Strategic initiatives
- 9.7.1. IBA Worldwide.