|
시장보고서
상품코드
1631125
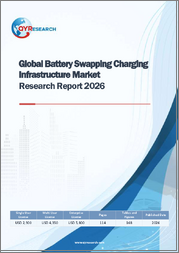
배터리 교환 충전 인프라 시장 규모, 점유율, 동향 분석 보고서 : 자동차 유형별, 서비스 유형별, 지역별, 부문 예측(2025-2030년)Battery Swapping Charging Infrastructure Market Size, Share & Trends Analysis Report By Vehicle Type, By Service Type, By Region, And Segment Forecasts, 2025 - 2030 |
||||||
배터리 교환 충전 인프라 시장의 성장과 동향
Grand View Research, Inc.의 최신 보고서에 따르면 세계 배터리 교환 충전 인프라 시장 규모는 2025-2030년에 걸쳐 23.6%의 연평균 복합 성장률(CAGR)을 기록해 2030년까지 8억 1,150만 달러에 이를 전망입니다.
배터리 교환 충전 인프라는 서비스형 배터리로도 알려져 있으며 필요한 유지 보수 서비스 비용을 없애고 전기자동차(EV)의 초기 비용을 크게 줄이고 CO2 배출량을 줄이고 EV 배터리 낭비를 최소화합니다. 배터리 교환 충전 인프라에는 이러한 이점이 있기 때문에 업계는 예측 기간 동안 크게 성장할 것으로 예상됩니다.
배터리 교환 충전 인프라를 통해 소비자는 자동차에서 배터리를 단독으로 빌릴 수 있습니다. 이 시장이 제공하는 배터리의 업그레이드와 재충전은 충전 시간이나 항속 거리 불안 등 플러그인 EV 충전기의 단점을 극복하고 있습니다. 기존의 주유소와 비교할 수 있는 몇 분 안에 충전된 배터리를 제공하여 충전 시간을 단축합니다. 또한 여러 장소에서 즉시 배터리를 교체할 수 있어 사용자의 항속 거리에 대한 불안을 줄이고 장시간 이동을 가능하게 합니다. 이러한 요인이 시장 성장에 기여하고 있습니다.
배터리 교체식 충전 인프라 수요는 전기자동차 수요와 밀접한 관련이 있으며 전기자동차 수요에 의존합니다. 세계 각국의 정부는 전기자동차를 보급하기 위한 전략적 노력을 하고 있습니다. 예를 들어, 전기자동차의 채택과 채용을 서두르기 위해 전기자동차 이니셔티브(EVI)라고 불리는 여러 정부의 시책 그룹이 설립되었습니다. EVI는 세계 주요 경제국의 에너지 장관들이 모이는 고수준 회의, 청정 에너지 장관 회의(CEM)의 일환으로 설립되었습니다. 미국, 캐나다, 프랑스, 독일, 영국, 네덜란드, 인도, 일본을 포함한 여러 국가가 EVI에 참여하고 있습니다.
이러한 정부의 이니셔티브는 전기자동차의 보급을 뒷받침하고 있으며, 이는 시장에 좋은 징후입니다. COVID-19의 유행은 세계 자동차 판매에 부정적인 영향을 미쳤습니다. 국제에너지기구(IEA)가 발표한 보고서에 따르면 세계 자동차 판매 대수는 전례없는 우울증을 보였습니다. 그러나 세계 전기자동차 판매 대수는 2019-2020년에 걸쳐 40% 증가했습니다. 팬데믹은 보다 환경에 신중한 사례를 채택할 필요성을 부각시키고 EV 채용을 촉진했습니다. EV 수요가 증가함에 따라 공공 충전 인프라 수요도 증가하여 세계 시장의 성장을 이끌고 있습니다.
배터리 교환 충전 인프라 시장 보고서 하이라이트
- 2024년 이륜차 부문은 31.0%의 최대 점유율을 차지했습니다. 배터리 교환 기술이 제공하는 비용 효과가 산업의 성장을 견인했습니다.
- 2024년 최대 시장 점유율을 차지한 것은 종량 과금 부문입니다. 페이퍼 사용 또는 종량제 서비스를 통해 배터리를 차량에서 분리할 수 있어 사용자가 초기 비용을 절감하고 전기자동차를 구입할 수 있습니다.
- 구독 부문은 예측 기간 동안 가장 빠른 CAGR을 나타낼 것으로 예상됩니다. 구독 서비스 부문은 전기자동차 사용자가 BaaS(Battery-as-a-Service)에 가입하여 미리 정해진 구독 가격으로 교환 스테이션에서 배터리 교체를 선택할 수 있도록 하는 것입니다.
- 아시아태평양 배터리 교환 교환 인프라 산업은 시장 전체를 지배했으며 2024년에는 세계 점유율의 30.66%를 차지했습니다. 이 지역, 특히 중국, 인도, 동남아시아 등 시장에서 EV의 보급이 진행되고 있는 것이, 동 산업의 성장에 박차를 가하고 있습니다.
목차
제1장 조사 방법과 범위
제2장 주요 요약
제3장 배터리 교환 충전 인프라 시장의 변수, 동향, 범위
- 시장 계통의 전망
- 시장 역학
- 시장 성장 촉진요인 분석
- 시장 성장 억제요인 분석
- 산업의 과제
- 배터리 교환 충전 인프라 시장 분석 도구
- 산업 분석 - Porter's Five Forces 분석
- PESTEL 분석
제4장 배터리 교환 충전 인프라 시장 : 자동차 유형별, 추정·동향 분석
- 부문 대시보드
- 배터리 교환 충전 인프라 시장 : 자동차 유형의 변동 분석(2024년·2030년)
- 이륜차
- 삼륜차
- 승용차
- 상용차
제5장 배터리 교환 충전 인프라 시장 : 서비스 유형별, 추정·동향 분석
- 부문 대시보드
- 배터리 교환 충전 인프라 시장 : 서비스 유형의 변동 분석(2024년·2030년)
- 종량 과금제
- 구독
제6장 배터리 교환 충전 인프라 시장 : 지역별, 추정·동향 분석
- 배터리 교환 충전 인프라 시장 점유율, 지역별(2024년·2030년)
- 북미
- 미국
- 캐나다
- 멕시코
- 유럽
- 영국
- 독일
- 프랑스
- 이탈리아
- 스페인
- 네덜란드
- 아시아태평양
- 중국
- 일본
- 인도
- 한국
- 호주
- 라틴아메리카
- 브라질
- 중동 및 아프리카
제7장 경쟁 구도
- 기업 분류
- 기업의 시장 포지셔닝
- 기업 히트맵 분석
- 기업 프로파일/상장 기업
- NIO Inc.
- Gogoro Inc.
- Leo Motors Inc.
- Yadea Technology Group Co.,Ltd.
- SUN Mobility Private Ltd.
- BYD Co. Ltd.
- BattSwap Inc.
- 광양모터(주)(KYMCO)
- Panasonic Corp.
- Lithion Power Pvt. Ltd.
Battery Swapping Charging Infrastructure Market Growth & Trends:
The global battery swapping charging infrastructure market size is expected to reach USD 811.5 million by 2030, registering a CAGR of 23.6% from 2025 to 2030, according to a new report by Grand View Research, Inc. Battery swapping charging infrastructure, also known as battery-as-a-services, eliminates the maintenance and service cost required, reduces the upfront cost of an Electric Vehicle(EV) considerably, cuts down CO2 emissions, and minimizes EV battery wastage. Owing to these advantages of the battery-swapping charging infrastructure, the industry is expected to grow significantly over the forecast period.
Through the battery-swapping charging infrastructure, consumers can borrow batteries as a stand-alone component from automobiles. The upgradation and recharging of batteries provided by the market conquer the shortcomings of plug-in EV chargers, including charging time and range anxiety. It provides charged batteries within a few minutes, comparable to traditional gas stations, thereby reducing the charging time. It provides longevity for long journeys by reducing users' range anxiety by providing them instant battery swapping at multiple locations. These factors are contributing to the growth of the market.
The demand for battery-swapping charging infrastructure is closely related to and dependent on the demand for electric vehicles. Governments across the world are engaging in strategic initiatives to promote electric vehicles. For instance, a multi-government policy group called the Electric Vehicles Initiative (EVI) was established to hasten the introduction and adoption of electric vehicles. EVI was established as part of the Clean Energy Ministerial (CEM), a high-level conference for the world's leading economies' energy ministers. Multiple countries, including the U.S., Canada, France, Germany, U.K., Netherlands, India, and Japan, have participated in EVI.
Such government initiatives are driving the adoption of electric vehicles which bodes well for the market. The COVID-19 pandemic had an adverse effect on global car sales. According to a report published by the International Energy Agency, global car sales witnessed an unprecedented drop in sales. However, global electric car sales grew by 40% from 2019 to 2020. The pandemic highlighted the need to adopt more environmentally cautious practices, driving the adoption of EVs. With the increasing demand for EVs, demand for public charging infrastructure also increased, driving the growth of the global market.
Battery Swapping Charging Infrastructure Market Report Highlights:
- The two-wheeler segment accounted for the largest share of 31.0% in 2024. The cost-effectiveness offered by the battery swapping technology drives the growth of the industry.
- The pay-per-use segment held the largest market share in 2024. The pay-per-use or pay-as-you-go service allows the separation of battery from the vehicle and enables users to buy electric vehicles at a lower upfront cost.
- The subscription segment is expected to register the fastest CAGR during the forecast period. The subscription service segment allows electric vehicle users to subscribe to battery-as-a-service and opt for battery swapping at the swap station at pre-determined subscription prices.
- The battery swapping charging infrastructure industry in Asia Pacific dominated the overall market and accounted for 30.66% of the global share in 2024. The growing EV adoption in the region, particularly in markets such as China, India, and Southeast Asia, is fueling the growth of the industry.
Table of Contents
Chapter 1. Methodology and Scope
- 1.1. Market Segmentation and Scope
- 1.2. Research Methodology
- 1.2.1. Information Procurement
- 1.3. Information or Data Analysis
- 1.4. Methodology
- 1.5. Research Scope and Assumptions
- 1.6. Market Formulation & Validation
- 1.7. Country Based Segment Share Calculation
- 1.8. List of Data Sources
Chapter 2. Executive Summary
- 2.1. Market Outlook
- 2.2. Segment Outlook
- 2.3. Competitive Insights
Chapter 3. Battery Swapping Charging Infrastructure Market Variables, Trends, & Scope
- 3.1. Market Lineage Outlook
- 3.2. Market Dynamics
- 3.2.1. Market Driver Analysis
- 3.2.2. Market Restraint Analysis
- 3.2.3. Industry Challenge
- 3.3. Battery Swapping Charging Infrastructure Market Analysis Tools
- 3.3.1. Industry Analysis - Porter's
- 3.3.1.1. Bargaining power of the suppliers
- 3.3.1.2. Bargaining power of the buyers
- 3.3.1.3. Threats of substitution
- 3.3.1.4. Threats from new entrants
- 3.3.1.5. Competitive rivalry
- 3.3.2. PESTEL Analysis
- 3.3.2.1. Political landscape
- 3.3.2.2. Economic landscape
- 3.3.2.3. Social landscape
- 3.3.2.4. Technological landscape
- 3.3.2.5. Environmental landscape
- 3.3.2.6. Legal landscape
- 3.3.1. Industry Analysis - Porter's
Chapter 4. Battery Swapping Charging Infrastructure Market: Vehicle Type Estimates & Trend Analysis
- 4.1. Segment Dashboard
- 4.2. Battery Swapping Charging Infrastructure Market: Vehicle Type Movement Analysis, 2024 & 2030 (USD Million)
- 4.3. Two-Wheeler
- 4.3.1. Two-Wheeler Market Revenue Estimates and Forecasts, 2018 - 2030 (USD Million)
- 4.4. Three-Wheeler
- 4.4.1. Three-Wheeler Market Revenue Estimates and Forecasts, 2018 - 2030 (USD Million)
- 4.5. Passenger Vehicle
- 4.5.1. Passenger Vehicle Market Revenue Estimates and Forecasts, 2018 - 2030 (USD Million)
- 4.6. Commercial Vehicle
- 4.6.1. Commercial Vehicle Market Revenue Estimates and Forecasts, 2018 - 2030 (USD Million)
Chapter 5. Battery Swapping Charging Infrastructure Market: Service Type Estimates & Trend Analysis
- 5.1. Segment Dashboard
- 5.2. Battery Swapping Charging Infrastructure Market: Service Type Movement Analysis, 2024 & 2030 (USD Million)
- 5.3. Pay-per-Use
- 5.3.1. Pay-per-Use Market Revenue Estimates and Forecasts, 2018 - 2030 (USD Million)
- 5.4. Subscription
- 5.4.1. Subscription Market Revenue Estimates and Forecasts, 2018 - 2030 (USD Million)
Chapter 6. Battery Swapping Charging Infrastructure Market: Regional Estimates & Trend Analysis
- 6.1. Battery Swapping Charging Infrastructure Market Share, By Region, 2024 & 2030 (USD Million)
- 6.2. North America
- 6.2.1. North America Battery Swapping Charging Infrastructure Market Estimates and Forecasts, 2018 - 2030 (USD Million)
- 6.2.2. U.S.
- 6.2.2.1. U.S. Battery Swapping Charging Infrastructure Market Estimates and Forecasts, 2018 - 2030 (USD Million)
- 6.2.3. Canada
- 6.2.3.1. Canada Battery Swapping Charging Infrastructure Market Estimates and Forecasts, 2018 - 2030 (USD Million)
- 6.2.4. Mexico
- 6.2.4.1. Mexico Battery Swapping Charging Infrastructure Market Estimates and Forecasts, 2018 - 2030 (USD Million)
- 6.3. Europe
- 6.3.1. Europe Battery Swapping Charging Infrastructure Market Estimates and Forecasts, 2018 - 2030 (USD Million)
- 6.3.2. U.K.
- 6.3.2.1. U.K. Battery Swapping Charging Infrastructure Market Estimates and Forecasts, 2018 - 2030 (USD Million)
- 6.3.3. Germany
- 6.3.3.1. Germany Battery Swapping Charging Infrastructure Market Estimates and Forecasts, 2018 - 2030 (USD Million)
- 6.3.4. France
- 6.3.4.1. France Battery Swapping Charging Infrastructure Market Estimates and Forecasts, 2018 - 2030 (USD Million)
- 6.3.5. Italy
- 6.3.5.1. Italy Battery Swapping Charging Infrastructure Market Estimates and Forecasts, 2018 - 2030 (USD Million)
- 6.3.6. Spain
- 6.3.6.1. Spain Battery Swapping Charging Infrastructure Market Estimates and Forecasts, 2018 - 2030 (USD Million)
- 6.3.7. Netherlands
- 6.3.7.1. Netherlands Battery Swapping Charging Infrastructure Market Estimates and Forecasts, 2018 - 2030 (USD Million)
- 6.4. Asia Pacific
- 6.4.1. Asia Pacific Battery Swapping Charging Infrastructure Market Estimates and Forecasts, 2018 - 2030 (USD Million)
- 6.4.2. China
- 6.4.2.1. China Battery Swapping Charging Infrastructure Market Estimates and Forecasts, 2018 - 2030 (USD Million)
- 6.4.3. Japan
- 6.4.3.1. Japan Battery Swapping Charging Infrastructure Market Estimates and Forecasts, 2018 - 2030 (USD Million)
- 6.4.4. India
- 6.4.4.1. India Battery Swapping Charging Infrastructure Market Estimates and Forecasts, 2018 - 2030 (USD Million)
- 6.4.5. South Korea
- 6.4.5.1. South Korea Battery Swapping Charging Infrastructure Market Estimates and Forecasts, 2018 - 2030 (USD Million)
- 6.4.6. Australia
- 6.4.6.1. Australia Battery Swapping Charging Infrastructure Market Estimates and Forecasts, 2018 - 2030 (USD Million)
- 6.5. Latin America
- 6.5.1. Latin America Battery Swapping Charging Infrastructure Market Estimates and Forecasts, 2018 - 2030 (USD Million)
- 6.5.2. Brazil
- 6.5.2.1. Brazil Battery Swapping Charging Infrastructure Market Estimates and Forecasts, 2018 - 2030 (USD Million)
- 6.6. Middle East and Africa
- 6.6.1. Middle East and Africa Battery Swapping Charging Infrastructure Market Estimates and Forecasts, 2018 - 2030 (USD Million)
Chapter 7. Competitive Landscape
- 7.1. Company Categorization
- 7.2. Company Market Positioning
- 7.3. Company Heat Map Analysis
- 7.4. Company Profiles/Listing
- 7.4.1. NIO Inc.
- 7.4.1.1. Participant's Overview
- 7.4.1.2. Financial Performance
- 7.4.1.3. Product Benchmarking
- 7.4.1.4. Strategic Initiatives
- 7.4.2. Gogoro Inc.
- 7.4.2.1. Participant's Overview
- 7.4.2.2. Financial Performance
- 7.4.2.3. Product Benchmarking
- 7.4.2.4. Strategic Initiatives
- 7.4.3. Leo Motors Inc.
- 7.4.3.1. Participant's Overview
- 7.4.3.2. Financial Performance
- 7.4.3.3. Product Benchmarking
- 7.4.3.4. Strategic Initiatives
- 7.4.4. Yadea Technology Group Co.,Ltd.
- 7.4.4.1. Participant's Overview
- 7.4.4.2. Financial Performance
- 7.4.4.3. Product Benchmarking
- 7.4.4.4. Strategic Initiatives
- 7.4.5. SUN Mobility Private Ltd.
- 7.4.5.1. Participant's Overview
- 7.4.5.2. Financial Performance
- 7.4.5.3. Product Benchmarking
- 7.4.5.4. Strategic Initiatives
- 7.4.6. BYD Co. Ltd.
- 7.4.6.1. Participant's Overview
- 7.4.6.2. Financial Performance
- 7.4.6.3. Product Benchmarking
- 7.4.6.4. Strategic Initiatives
- 7.4.7. BattSwap Inc.
- 7.4.7.1. Participant's Overview
- 7.4.7.2. Financial Performance
- 7.4.7.3. Product Benchmarking
- 7.4.7.4. Strategic Initiatives
- 7.4.8. Kwang Yang Motor Co. Ltd. (KYMCO)
- 7.4.8.1. Participant's Overview
- 7.4.8.2. Financial Performance
- 7.4.8.3. Product Benchmarking
- 7.4.8.4. Strategic Initiatives
- 7.4.9. Panasonic Corp.
- 7.4.9.1. Participant's Overview
- 7.4.9.2. Financial Performance
- 7.4.9.3. Product Benchmarking
- 7.4.9.4. Strategic Initiatives
- 7.4.10. Lithion Power Pvt. Ltd.
- 7.4.10.1. Participant's Overview
- 7.4.10.2. Financial Performance
- 7.4.10.3. Product Benchmarking
- 7.4.10.4. Strategic Initiatives
- 7.4.1. NIO Inc.