|
시장보고서
상품코드
1750868
약물 스크리닝 시장 규모, 점유율, 동향 분석 리포트 : 제품 유형별, 샘플 유형별, 최종 용도별, 지역별, 부문 예측(2025-2030년)Drug Screening Market Size, Share & Trends Analysis Report By Product Type (Instruments, Consumables), By Sample Type (Urine Sample, Breath Sample), By End-use (Drug Treatment Centers), By Region, And Segment Forecasts, 2025 - 2030 |
||||||
약물 스크리닝 시장의 성장과 동향 :
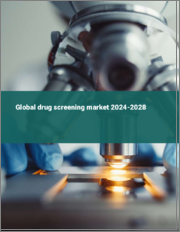
Grand View Research, Inc.의 최신 리포트에 따르면 세계의 약물 스크리닝 시장 규모는 2030년까지 119억 9,000만 달러에 달할 것으로 추정되며, 2025-2030년에 CAGR 4.1%로 확대할 것으로 예측됩니다.
이 시장을 주도하는 것은 직장 안전에 대한 관심 증가, 규제에 대한 대응, 검사 방법의 기술적 진보에 힘입어 약물 남용에 대한 정확한 감지 요건입니다.
영국에서 약물 및 알코올 서비스를 이용하는 성인의 수는 2020-2021년 275,896명에서 2021-2022년 289,215명으로 4.8% 증가하며 영국내 약물 남용이 확산되고 있음을 보여줍니다. 약물 남용 유병률 증가는 증거 기반 치료 옵션에 대한 접근성 확대, 약물 및 알코올 남용의 위험에 대한 인식을 높이는 공중보건 캠페인과 같은 효과적인 예방 및 치료 전략의 필요성을 더욱 강조하고 있습니다.
또한 2020년 12세 이상 미국인의 불법 약물 사용률은 약 3,731만 명으로 지난 수년간 전년 대비 3.8% 증가한 것으로 나타났습니다. 이러한 증가는 직장, 학교 및 의료 환경에서 종합적인 약물 검사 프로그램의 시급한 필요성을 강조하고, 안전, 규정 준수 및 약물 남용으로 고통받는 사람들에게 적절한 치료와 지원을 제공해야 한다는 점을 강조합니다.
또한 신제품 출시, 합병 및 인수와 같은 시장 기업의 구상은 시장 성장에 기여하고 있습니다. 예를 들어 2024년 2월, 뉴욕의 선도적인 약물 검사 프로바이더인 Mobile Health는 고용주를 위해 1시간 이내에 결과를 얻을 수 있는 신속한 약물 검사를 시작했습니다. 정확성과 범용성을 위해 소변 기반 검사에 초점을 맞춘 이 혁신은 채택 절차를 앞당기고 뉴욕의 인재 확보에 혁명을 일으켰습니다. 또한 2023년 12월에는 유전자 마커를 통해 개인의 오피오이드 사용 장애 발병 위험을 평가하는 AvertD 검사가 FDA의 승인을 받아 오피오이드 위기 대응에 있으며, 중요한 혁신이 될 것으로 예측됩니다. 오피오이드 진통제에 노출되기 전, 특히 수술을 앞둔 환자에게 사용하도록 설계되었습니다. 이 검사는 환자와 의료진이 오피오이드 사용에 대한 정보에 입각한 의사결정을 내릴 수 있도록 돕고 중독과 오남용의 위험을 줄일 수 있도록 하는 것을 목표로 합니다.
약물 스크리닝 시장 보고서 하이라이트
- 소모품은 2024년 34.5%의 가장 큰 매출 점유율을 차지했으며, 이는 신속하고 정확한 현장 검사에 필수적인 역할을 하기 때문입니다. 또한 잦은 제품 출시와 작업장 및 의료 환경에서의 효율적인 물질 검출에 대한 필요성이 이 분야의 성장을 가속하고 있습니다.
- 기타 서비스는 예측 기간 중 CAGR 4.1%를 보일 것으로 예측됩니다. 이는 실험실 분석 및 규제 기준 준수 지원과 같은 전문적인 약물 스크리닝 서비스에 대한 수요가 증가하고 있기 때문입니다.
- 소변 샘플은 2024년 41.3%의 가장 큰 매출 점유율을 차지하며 시장을 장악했습니다. 이는 주로 비침습적이고 간단하고 편리한 수집 과정으로 인해 직장 및 임상 환경 모두에 적합하기 때문입니다.
- 구강액 샘플은 채취의 용이성, 프라이버시 보호에 대한 우려 감소, 샘플 혼입 위험의 감소로 인해 예측 기간 중 상당한 CAGR로 성장할 것으로 예측됩니다.
- 2024년에는 약물 치료가 시장을 주도하며 가장 큰 매출 점유율을 차지했습니다. 병원은 2025-2030년 가장 빠른 CAGR 5.2%를 보일 것으로 예측됩니다.
- 2024년 북미는 약물 남용률 증가, 엄격한 직장 안전 규제, 약물 관련 문제를 통제하기 위한 정부 구상 증가로 인해 북미가 세계 약물 검사 시장에서 최대 매출 점유율을 차지했습니다.
목차
제1장 조사 방법과 범위
제2장 개요
제3장 세계의 약물 스크리닝 시장의 변수, 동향, 범위
- 시장 계통 전망
- 모시장 전망
- 관련/보조 시장 전망
- 시장 역학
- 시장 성장 촉진요인 분석
- 시장 성장 억제요인 분석
- 세계 약물 스크리닝 시장 분석 툴
- 업계 분석 - Porter's Five Forces 분석
- PESTLE 분석
제4장 세계의 약물 스크리닝 시장 : 제품 유형 비즈니스 분석
- 제품 유형 부문 대시보드
- 약물 스크리닝 시장 : 제품 유형 변동 분석
- 세계의 약물 스크리닝 시장 규모와 동향 분석(제품 유형별, 2018-2030년)
- 기기
- 신속 검사 기기
- 소모품
- 서비스와 기타
제5장 세계의 약물 스크리닝 시장 : 샘플 유형 비즈니스 분석
- 샘플 유형 부문 대시보드
- 약물 스크리닝 시장 : 샘플 유형 변동 분석
- 세계의 약물 스크리닝 시장 규모와 동향 분석(샘플 유형별, 2018-2030년)
- 뇨샘플
- 호기 샘플
- 구강액 샘플
- 모발 샘플
- 기타 샘플
제6장 세계의 약물 스크리닝 시장 : 최종 용도 비즈니스 분석
- 최종 용도 부문 대시보드
- 약물 스크리닝 시장 : 최종 용도 변동 분석
- 세계의 약물 스크리닝 시장 규모와 동향 분석(최종 용도별, 2018-2030년)
- 병원
- 형사 사법 및 법집행기관
- 직장
- 약물 치료 센터
- 개인 사용자
- 통증 관리 센터
- 학교와 대학
- 기타
제7장 세계의 약물 스크리닝 시장 : 지역 추정·동향 분석
- 지역 시장 대시보드
- 지역별 시장 점유율 분석, 2024년 및 2030년
- 지역별 세계 약물 스크리닝 시장 : 주요 포인트
- 북미
- 미국
- 캐나다
- 멕시코
- 유럽
- 독일
- 영국
- 프랑스
- 이탈리아
- 스페인
- 덴마크
- 스웨덴
- 노르웨이
- 아시아태평양
- 일본
- 중국
- 인도
- 호주
- 태국
- 한국
- 라틴아메리카
- 브라질
- 아르헨티나
- 중동 및 아프리카
- 남아프리카공화국
- 사우디아라비아
- 아랍에미리트
- 쿠웨이트
제8장 경쟁 구도
- 주요 시장 참여 기업에 의한 최근 동향과 영향 분석
- 기업/경쟁 분류
- 벤더 구도
- 기업 개요
- Abbott
- Quest Diagnostics Incorporated
- F. Hoffmann-La Roche Ltd
- Thermo Fisher Scientific Inc.
- Siemens Healthcare AG
- Laboratory Corporation of America Holdings
- Alfa Scientific Designs, Inc.
- OraSure Technologies, Inc.
- Omega Laboratories, Inc.
- Dragerwerk AG &Co. KGaA
- Bio-Rad Laboratories, Inc.
Drug Screening Market Growth & Trends:
The global drug screening market size is estimated to reach USD 11.99 billion by 2030 and is anticipated to expand at a CAGR of 4.1% from 2025 to 2030, according to a new report by Grand View Research, Inc. The market is driven by increasing workplace safety concerns, regulatory compliance, and the requirement for accurate detection of substance abuse, aided by technological advancements in testing methods.
The increase in number of adults in contact with drug and alcohol services in England has increased from 275,896 in 2020 - 2021¬ to 289,215 in 2021 - 2022, representing a 4.8% rise, which signifies a growing prevalence of substance abuse in the country. The rising prevalence of substance abuse further propels the need for effective prevention and treatment strategies, including the expansion of access to evidence-based treatment options and public health campaigns to raise awareness about the risks of drug and alcohol misuse.
Furthermore, the incidence of illegal substance uses amongst Americans aged 12 and older in 2020 was around 37.31 million, and shows a 3.8% year-over-year increase over the years; this rising prevalence serves as a significant driver for the market. This increase highlights the urgent need for comprehensive drug screening programs in workplaces, schools, and healthcare settings to ensure safety, compliance with regulations, and provision of appropriate care and support for individuals struggling with substance abuse.
Furthermore, initiatives by market players such as new product launches, mergers, acquisitions, and others contribute to market growth. For instance, in February 2024, Mobile Health, the leading drug testing provider in NYC, launched rapid drug testing for employers, ensuring results in an hour or less. With a focus on urine-based testing for accuracy and versatility, this innovation advances the hiring procedure, revolutionizing talent acquisition in NYC. In addition, in December 2023, the FDA's approval of the AvertD test, which assesses an individual's risk of developing opioid use disorder through genetic markers, marks a significant innovation in the fight against the opioid crisis. This test, developed by AutoGenomics, Inc., is designed to be used before a patient is first exposed to oral opioid pain medications, particularly in patients scheduled for surgical procedures. The test is intended to help patients and healthcare providers make informed decisions about opioid use, potentially reducing the risk of addiction and misuse.
Drug Screening Market Report Highlights:
- Consumables held the largest revenue share of 34.5% in 2024, attributed to their essential role in rapid, accurate, and on-site testing. Furthermore, frequent product launches and the need for efficient substance detection across workplaces and healthcare settings also fuel this segment's growth
- Services and others are expected to grow at a CAGR of 4.1% over the forecast period, owing to the increasing need for specialized drug screening services, including laboratory analysis and support for compliance with regulatory standards.
- Urine samples dominated the market with the largest revenue share of 41.3% in 2024, primarily driven by their noninvasive, simple, and convenient collection process, which makes them suitable for both workplace and clinical settings.
- Oral fluid samples are expected to grow at a significant CAGR over the forecast period, driven by their ease of collection, minimal privacy concerns, and lower risk of sample adulteration.
- In 2024, drug treatment led the market and accounted for the largest revenue share. Hospitals are expected to grow at the fastest CAGR of 5.2% from 2025 to 2030.
- North America dominated the global drug screening market with the largest revenue share in 2024, driven by rising substance abuse rates, stringent workplace safety regulations, and increasing government initiatives aimed at controlling drug-related issues.
Table of Contents
Chapter 1. Methodology and Scope
- 1.1. Market Segmentation & Scope
- 1.2. Segment Definitions
- 1.2.1. Product Type
- 1.2.2. Sample Type
- 1.2.3. End Use
- 1.3. Research Methodology
- 1.4. Information Procurement
- 1.4.1. Purchased Database
- 1.4.2. GVR's Internal Database
- 1.4.3. Secondary Sources
- 1.4.4. Primary Research
- 1.5. Information or Data Analysis
- 1.5.1. Data Analysis Models
- 1.6. Market Formulation & Validation
- 1.7. Model Details
- 1.8. List of Secondary Sources
- 1.9. Objectives
Chapter 2. Executive Summary
- 2.1. Market Outlook
- 2.2. Segment Outlook
- 2.2.1. Product Type Outlook
- 2.2.2. Sample Type Outlook
- 2.2.3. End Use Outlook
- 2.2.4. Regional Outlook
- 2.3. Competitive Insights
Chapter 3. Global Drug Screening Market Variables, Trends, & Scope
- 3.1. Market Lineage Outlook
- 3.1.1. Parent Market Outlook
- 3.1.2. Related/Ancillary Market Outlook
- 3.2. Market Dynamics
- 3.2.1. Market Driver Analysis
- 3.2.2. Market Restraint Analysis
- 3.3. Global Drug Screening Market Analysis Tools
- 3.3.1. Industry Analysis - Porter's Five Forces Analysis
- 3.3.1.1. Supplier Power
- 3.3.1.2. Buyer Power
- 3.3.1.3. Substitution Threat
- 3.3.1.4. Threat of New Entrants
- 3.3.1.5. Competitive Rivalry
- 3.3.2. PESTLE Analysis
- 3.3.2.1. Political Landscape
- 3.3.2.2. Technological Landscape
- 3.3.2.3. Economic Landscape
- 3.3.1. Industry Analysis - Porter's Five Forces Analysis
Chapter 4. Global Drug Screening Market: Product Type Business Analysis
- 4.1. Product Type Segment Dashboard
- 4.2. Drug Screening Market: Product Type Movement Analysis
- 4.3. Global Drug Screening Market Size & Trend Analysis, By Product Type, 2018 to 2030 (USD Million)
- 4.4. Instruments
- 4.4.1. Market Estimates and Forecasts 2018 to 2030 (USD Million)
- 4.4.2. Immunoassays Analyzers
- 4.4.2.1. Market Estimates and Forecasts 2018 to 2030 (USD Million)
- 4.4.3. Chromatography Instruments
- 4.4.3.1. Market Estimates and Forecasts 2018 to 2030 (USD Million)
- 4.4.4. Breath Analyzer
- 4.4.4.1. Market Estimates and Forecasts 2018 to 2030 (USD Million)
- 4.4.4.2. Fuel Cell Breath Analyzer
- 4.4.4.2.1. Market Estimates and Forecasts 2018 to 2030 (USD Million)
- 4.4.4.3. Semi-Conductor Breath Analyzer
- 4.4.4.3.1. Market Estimates and Forecasts 2018 to 2030 (USD Million)
- 4.4.4.4. Others Breath Analyzer
- 4.4.4.4.1. Market Estimates and Forecasts 2018 to 2030 (USD Million)
- 4.5. Rapid Testing Devices
- 4.5.1. Market Estimates and Forecasts 2018 to 2030 (USD Million)
- 4.5.2. Urine Testing Devices
- 4.5.2.1. Market Estimates and Forecasts 2018 to 2030 (USD Million)
- 4.5.2.2. Drug Testing Cups
- 4.5.2.2.1. Market Estimates and Forecasts 2018 to 2030 (USD Million)
- 4.5.2.3. Dip Cards
- 4.5.2.3.1. Market Estimates and Forecasts 2018 to 2030 (USD Million)
- 4.5.2.4. Drug Testing Cassettes
- 4.5.2.4.1. Market Estimates and Forecasts 2018 to 2030 (USD Million)
- 4.5.3. Oral Fluid Testing Devices
- 4.5.4. Market Estimates and Forecasts 2018 to 2030 (USD Million)
- 4.6. Consumables
- 4.6.1. Market Estimates and Forecasts 2018 to 2030 (USD Million)
- 4.6.2. Assay Kits
- 4.6.2.1. Market Estimates and Forecasts 2018 to 2030 (USD Million)
- 4.6.3. Sample Collection Devices
- 4.6.3.1. Market Estimates and Forecasts 2018 to 2030 (USD Million)
- 4.6.4. Calibrators & Controls
- 4.6.4.1. Market Estimates and Forecasts 2018 to 2030 (USD Million)
- 4.6.5. Other Consumables
- 4.6.5.1. Market Estimates and Forecasts 2018 to 2030 (USD Million)
- 4.7. Services & Others
- 4.7.1. Market Estimates and Forecasts 2018 to 2030 (USD Million)
Chapter 5. Global Drug Screening Market: Sample Type Business Analysis
- 5.1. Sample Type Segment Dashboard
- 5.2. Drug Screening Market: Sample Type Movement Analysis
- 5.3. Global Drug Screening Market Size & Trend Analysis, By Sample Type, 2018 to 2030 (USD Million)
- 5.4. Urine Samples
- 5.4.1. Market Estimates and Forecasts 2018 to 2030 (USD Million)
- 5.5. Breath Samples
- 5.5.1. Market Estimates and Forecasts 2018 to 2030 (USD Million)
- 5.6. Oral Fluid Samples
- 5.6.1. Market Estimates and Forecasts 2018 to 2030 (USD Million)
- 5.7. Hair Samples
- 5.7.1. Market Estimates and Forecasts 2018 to 2030 (USD Million)
- 5.8. Other Samples
- 5.8.1. Market Estimates and Forecasts 2018 to 2030 (USD Million)
Chapter 6. Global Drug Screening Market: End Use Business Analysis
- 6.1. End Use Segment Dashboard
- 6.2. Drug Screening Market: End Use Movement Analysis
- 6.3. Global Drug Screening Market Size & Trend Analysis, By End Use, 2018 to 2030 (USD Million)
- 6.4. Hospitals
- 6.4.1. Market Estimates and Forecasts 2018 to 2030 (USD Million)
- 6.5. Criminal Justice & Law Enforcement Agencies
- 6.5.1. Market Estimates and Forecasts 2018 to 2030 (USD Million)
- 6.6. Workplaces
- 6.6.1. Market Estimates and Forecasts 2018 to 2030 (USD Million)
- 6.7. Drug Treatment Centers
- 6.7.1. Market Estimates and Forecasts 2018 to 2030 (USD Million)
- 6.8. Individual Users
- 6.8.1. Market Estimates and Forecasts 2018 to 2030 (USD Million)
- 6.9. Pain Management Centers
- 6.9.1. Market Estimates and Forecasts 2018 to 2030 (USD Million)
- 6.10. Schools & Colleges
- 6.10.1. Market Estimates and Forecasts 2018 to 2030 (USD Million)
- 6.11. Others
- 6.11.1. Market Estimates and Forecasts 2018 to 2030 (USD Million)
Chapter 7. Global Drug Screening Market: Regional Estimates & Trend Analysis
- 7.1. Regional Market Dashboard
- 7.2. Regional Market Share Analysis, 2024 & 2030
- 7.3. Global Drug Screening Market by Regional: Key Takeaways
- 7.4. North America
- 7.4.1. U.S.
- 7.4.1.1. Key Country Dynamics
- 7.4.1.2. Regulatory Framework/ Reimbursement Structure
- 7.4.1.3. Competitive Scenario
- 7.4.1.4. U.S. Market Estimates and Forecasts 2018 to 2030 (USD Million)
- 7.4.2. Canada
- 7.4.2.1. Key Country Dynamics
- 7.4.2.2. Regulatory Framework/ Reimbursement Structure
- 7.4.2.3. Competitive Scenario
- 7.4.2.4. Canada Market Estimates and Forecasts 2018 to 2030 (USD Million)
- 7.4.3. Mexico
- 7.4.3.1. Key Country Dynamics
- 7.4.3.2. Regulatory Framework/ Reimbursement Structure
- 7.4.3.3. Competitive Scenario
- 7.4.3.4. Mexico Market Estimates and Forecasts 2018 to 2030 (USD Million)
- 7.4.1. U.S.
- 7.5. Europe
- 7.5.1. Germany
- 7.5.1.1. Key Country Dynamics
- 7.5.1.2. Regulatory Framework/ Reimbursement Structure
- 7.5.1.3. Competitive Scenario
- 7.5.1.4. Germany Market Estimates and Forecasts 2018 to 2030 (USD Million)
- 7.5.2. UK
- 7.5.2.1. Key Country Dynamics
- 7.5.2.2. Regulatory Framework/ Reimbursement Structure
- 7.5.2.3. Competitive Scenario
- 7.5.2.4. UK Market Estimates and Forecasts 2018 to 2030 (USD Million)
- 7.5.3. France
- 7.5.3.1. Key Country Dynamics
- 7.5.3.2. Regulatory Framework/ Reimbursement Structure
- 7.5.3.3. Competitive Scenario
- 7.5.3.4. France Market Estimates and Forecasts 2018 to 2030 (USD Million)
- 7.5.4. Italy
- 7.5.4.1. Key Country Dynamics
- 7.5.4.2. Regulatory Framework/ Reimbursement Structure
- 7.5.4.3. Competitive Scenario
- 7.5.4.4. Italy Market Estimates and Forecasts 2018 to 2030 (USD Million)
- 7.5.5. Spain
- 7.5.5.1. Key Country Dynamics
- 7.5.5.2. Regulatory Framework/ Reimbursement Structure
- 7.5.5.3. Competitive Scenario
- 7.5.5.4. Spain Market Estimates and Forecasts 2018 to 2030 (USD Million)
- 7.5.6. Denmark
- 7.5.6.1. Key Country Dynamics
- 7.5.6.2. Regulatory Framework/ Reimbursement Structure
- 7.5.6.3. Competitive Scenario
- 7.5.6.4. Denmark Market Estimates and Forecasts 2018 to 2030 (USD Million)
- 7.5.7. Sweden
- 7.5.7.1. Key Country Dynamics
- 7.5.7.2. Regulatory Framework/ Reimbursement Structure
- 7.5.7.3. Competitive Scenario
- 7.5.7.4. Sweden Market Estimates and Forecasts 2018 to 2030 (USD Million)
- 7.5.8. Norway
- 7.5.8.1. Key Country Dynamics
- 7.5.8.2. Regulatory Framework/ Reimbursement Structure
- 7.5.8.3. Competitive Scenario
- 7.5.8.4. Norway Market Estimates and Forecasts 2018 to 2030 (USD Million)
- 7.5.1. Germany
- 7.6. Asia Pacific
- 7.6.1. Japan
- 7.6.1.1. Key Country Dynamics
- 7.6.1.2. Regulatory Framework/ Reimbursement Structure
- 7.6.1.3. Competitive Scenario
- 7.6.1.4. Japan Market Estimates and Forecasts 2018 to 2030 (USD Million)
- 7.6.2. China
- 7.6.2.1. Key Country Dynamics
- 7.6.2.2. Regulatory Framework/ Reimbursement Structure
- 7.6.2.3. Competitive Scenario
- 7.6.2.4. China Market Estimates and Forecasts 2018 to 2030 (USD Million)
- 7.6.3. India
- 7.6.3.1. Key Country Dynamics
- 7.6.3.2. Regulatory Framework/ Reimbursement Structure
- 7.6.3.3. Competitive Scenario
- 7.6.3.4. India Market Estimates and Forecasts 2018 to 2030 (USD Million)
- 7.6.4. Australia
- 7.6.4.1. Key Country Dynamics
- 7.6.4.2. Regulatory Framework/ Reimbursement Structure
- 7.6.4.3. Competitive Scenario
- 7.6.4.4. Australia Market Estimates and Forecasts 2018 to 2030 (USD Million)
- 7.6.5. Thailand
- 7.6.5.1. Key Country Dynamics
- 7.6.5.2. Regulatory Framework/ Reimbursement Structure
- 7.6.5.3. Competitive Scenario
- 7.6.5.4. Thailand Market Estimates and Forecasts 2018 to 2030 (USD Million)
- 7.6.6. South Korea
- 7.6.6.1. Key Country Dynamics
- 7.6.6.2. Regulatory Framework/ Reimbursement Structure
- 7.6.6.3. Competitive Scenario
- 7.6.6.4. South Korea Market Estimates and Forecasts 2018 to 2030 (USD Million)
- 7.6.1. Japan
- 7.7. Latin America
- 7.7.1. Brazil
- 7.7.1.1. Key Country Dynamics
- 7.7.1.2. Regulatory Framework/ Reimbursement Structure
- 7.7.1.3. Competitive Scenario
- 7.7.1.4. Brazil Market Estimates and Forecasts 2018 to 2030 (USD Million)
- 7.7.2. Argentina
- 7.7.2.1. Key Country Dynamics
- 7.7.2.2. Regulatory Framework/ Reimbursement Structure
- 7.7.2.3. Competitive Scenario
- 7.7.2.4. Argentina Market Estimates and Forecasts 2018 to 2030 (USD Million)
- 7.7.1. Brazil
- 7.8. Middle East & Africa
- 7.8.1. South Africa
- 7.8.1.1. Key Country Dynamics
- 7.8.1.2. Regulatory Framework/ Reimbursement Structure
- 7.8.1.3. Competitive Scenario
- 7.8.1.4. South Africa Market Estimates and Forecasts 2018 to 2030 (USD Million)
- 7.8.2. Saudi Arabia
- 7.8.2.1. Key Country Dynamics
- 7.8.2.2. Regulatory Framework/ Reimbursement Structure
- 7.8.2.3. Competitive Scenario
- 7.8.2.4. South Arabia Market Estimates and Forecasts 2018 to 2030 (USD Million)
- 7.8.3. UAE
- 7.8.3.1. Key Country Dynamics
- 7.8.3.2. Regulatory Framework/ Reimbursement Structure
- 7.8.3.3. Competitive Scenario
- 7.8.3.4. UAE Market Estimates and Forecasts 2018 to 2030 (USD Million)
- 7.8.4. Kuwait
- 7.8.4.1. Key Country Dynamics
- 7.8.4.2. Regulatory Framework/ Reimbursement Structure
- 7.8.4.3. Competitive Scenario
- 7.8.4.4. Kuwait Market Estimates and Forecasts 2018 to 2030 (USD Million)
- 7.8.1. South Africa
Chapter 8. Competitive Landscape
- 8.1. Recent Developments & Impact Analysis, By Key Market Participants
- 8.2. Company/Competition Categorization
- 8.3. Vendor Landscape
- 8.3.1. Key Company Heat Map Analysis, 2024
- 8.4. Company Profiles
- 8.4.1. Abbott
- 8.4.1.1. Company Overview
- 8.4.1.2. Financial Performance
- 8.4.1.3. Product Benchmarking
- 8.4.1.4. Strategic Initiatives
- 8.4.2. Quest Diagnostics Incorporated
- 8.4.2.1. Company Overview
- 8.4.2.2. Financial Performance
- 8.4.2.3. Product Benchmarking
- 8.4.2.4. Strategic Initiatives
- 8.4.3. F. Hoffmann-La Roche Ltd
- 8.4.3.1. Company Overview
- 8.4.3.2. Financial Performance
- 8.4.3.3. Product Benchmarking
- 8.4.3.4. Strategic Initiatives
- 8.4.4. Thermo Fisher Scientific Inc.
- 8.4.4.1. Company Overview
- 8.4.4.2. Financial Performance
- 8.4.4.3. Product Benchmarking
- 8.4.4.4. Strategic Initiatives
- 8.4.5. Siemens Healthcare AG
- 8.4.5.1. Company Overview
- 8.4.5.2. Financial Performance
- 8.4.5.3. Product Benchmarking
- 8.4.5.4. Strategic Initiatives
- 8.4.6. Laboratory Corporation of America Holdings
- 8.4.6.1. Company Overview
- 8.4.6.2. Financial Performance
- 8.4.6.3. Product Benchmarking
- 8.4.6.4. Strategic Initiatives
- 8.4.7. Alfa Scientific Designs, Inc.
- 8.4.7.1. Company Overview
- 8.4.7.2. Financial Performance
- 8.4.7.3. Product Benchmarking
- 8.4.7.4. Strategic Initiatives
- 8.4.8. OraSure Technologies, Inc.
- 8.4.8.1. Company Overview
- 8.4.8.2. Financial Performance
- 8.4.8.3. Product Benchmarking
- 8.4.8.4. Strategic Initiatives
- 8.4.9. Omega Laboratories, Inc.
- 8.4.9.1. Company Overview
- 8.4.9.2. Financial Performance
- 8.4.9.3. Product Benchmarking
- 8.4.9.4. Strategic Initiatives
- 8.4.10. Dragerwerk AG & Co. KGaA
- 8.4.10.1. Company Overview
- 8.4.10.2. Financial Performance
- 8.4.10.3. Product Benchmarking
- 8.4.10.4. Strategic Initiatives
- 8.4.11. Bio-Rad Laboratories, Inc.
- 8.4.11.1. Company Overview
- 8.4.11.2. Financial Performance
- 8.4.11.3. Product Benchmarking
- 8.4.11.4. Strategic Initiatives
- 8.4.1. Abbott
(주말 및 공휴일 제외)


