|
시장보고서
상품코드
1743389
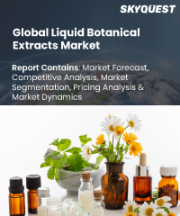
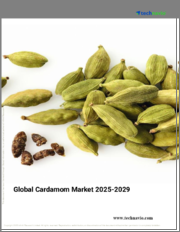
카다멈 시장(2025-2029년)Global Cardamom Market 2025-2029 |
||||||
카다멈 시장은 2024년부터 2029년까지 1억 9,530만 달러 증가하고, 예측 기간 동안 CAGR 3.1%로 성장할 것으로 예측됩니다.
세계의 카다멈 시장에 대해 조사 분석했으며, 시장 규모와 예측, 동향, 성장 촉진요인, 과제, 약 25개 벤더를 포함한 벤더 분석 등의 정보를 전해드립니다.
현재 시장 시나리오, 최신 동향 및 촉진요인, 전체 시장 환경에 대한 최신 분석을 제공합니다. 카다멈의 건강 효과에 대한 인식 증가, 신흥국에서의 카다멈 사용 증가, 카다멈의 다면성 등이 시장을 주도하고 있습니다.
| 시장 범위 | |
|---|---|
| 기준 연도 | 2025년 |
| 종료 연도 | 2029년 |
| 예측 기간 | 2025-2029년 |
| 성장 모멘텀 | 가속 |
| 전년비 | 3% |
| CAGR | 3.1% |
| 증분치 | 1억 9,530만 달러 |
이 조사는 업계 주요 참가자의 의견을 포함하여 1차 및 2차 정보를 객관적으로 결합하여 수행되었습니다. 이 보고서에는 주요 기업 분석, 종합적인 시장 규모 데이터, 지역별 분석에 따른 부문, 공급업체 현황이 포함되어 있습니다. 보고서에는 과거 데이터와 예측 데이터가 있습니다.
이 보고서는 향후 몇 년 동안 카다멈 시장의 성장을 촉진하는 주요 요인 중 하나로 온라인 쇼핑에 대한 관심이 증가하고 있는 것을 꼽았습니다. 또한, 유기농 카다멈에 대한 수요 증가와 포장 혁신에 대한 관심이 높아지면서 시장의 큰 수요로 이어질 것으로 예상됩니다.
목차
제1장 주요 요약
- 시장 개요
제2장 Technavio 분석
- 가격 민감도·수명주기·고객 구입 바스켓·채용률·구입 기준 분석
- 인풋의 중요성과 차별화 요인
- 혼란 요인
- 성장 촉진요인과 과제의 영향
제3장 시장 상황
- 시장 생태계
- 시장 특징
- 밸류체인 분석
제4장 시장 규모
- 시장 정의
- 시장 부문 분석
- 시장 규모, 2024년
- 시장 전망, 2024-2029년
제5장 시장 규모 실적
- 카다멈 세계 시장, 2019-2023년
- 제품별 부문 분석, 2019-2023년
- 용도별 부문 분석, 2019-2023년
- 유형별 부문 분석, 2019-2023년
- 유통 채널별 부문 분석, 2019-2023년
- 지역별 부문 분석, 2019-2023년
- 국가별 부문 분석, 2019-2023년
제6장 정성 분석
- AI의 영향 : 카다멈 세계 시장
제7장 Five Forces 분석
- Five Forces 요약
- 구매자의 교섭력
- 공급 기업의 교섭력
- 신규 참여업체의 위협
- 대체품의 위협
- 경쟁의 위협
- 시장 상황
제8장 시장 세분화 : 제품별
- 시장 부문
- 비교 : 제품별
- 원료 : 시장 규모와 예측, 2024-2029년
- 분말 : 시장 규모와 예측, 2024-2029년
- 액체 추출물 : 시장 규모와 예측, 2024-2029년
- 시장 기회 : 제품별
제9장 시장 세분화 : 용도별
- 시장 부문
- 비교 : 용도별
- 식품 및 음료 : 시장 규모와 예측, 2024-2029년
- 의료 용도 : 시장 규모와 예측, 2024-2029년
- 기타 : 시장 규모와 예측, 2024-2029년
- 시장 기회 : 용도별
제10장 시장 세분화 : 유형별
- 시장 부문
- 비교 : 유형별
- 그린 카다멈 : 시장 규모와 예측, 2024-2029년
- 블랙 카다멈 : 시장 규모와 예측, 2024-2029년
- 화이트 카다멈 : 시장 규모와 예측, 2024-2029년
- 시장 기회 : 유형별
제11장 시장 세분화 : 유통 채널별
- 시장 부문
- 비교 : 유통 채널별
- 오프라인 : 시장 규모와 예측, 2024-2029년
- 온라인 : 시장 규모와 예측, 2024-2029년
- 시장 기회 : 유통 채널별
제12장 고객 상황
- 고객 상황 개요
제13장 지역별 상황
- 지역별 세분화
- 지역별 비교
- 아시아태평양 : 시장 규모와 예측, 2024-2029년
- 유럽 : 시장 규모와 예측, 2024-2029년
- 중동 및 아프리카 : 시장 규모와 예측, 2024-2029년
- 북미 : 시장 규모와 예측, 2024-2029년
- 남미 : 시장 규모와 예측, 2024-2029년
- 중국 : 시장 규모와 예측, 2024-2029년
- 인도 : 시장 규모와 예측, 2024-2029년
- 미국 : 시장 규모와 예측, 2024-2029년
- 사우디아라비아 : 시장 규모와 예측, 2024-2029년
- 독일 : 시장 규모와 예측, 2024-2029년
- 일본 : 시장 규모와 예측, 2024-2029년
- 영국 : 시장 규모와 예측, 2024-2029년
- 아랍에미리트 : 시장 규모와 예측, 2024-2029년
- 한국 : 시장 규모와 예측, 2024-2029년
- 이탈리아 : 시장 규모와 예측, 2024-2029년
- 시장 기회 : 지역 상황별
제14장 촉진요인, 과제, 기회, 억제요인
- 시장 성장 촉진요인
- 시장 과제
- 성장 촉진요인과 과제의 영향
- 시장 기회·억제요인
제15장 경쟁 구도
- 개요
- 경쟁 구도
- 혼란 상황
- 업계 리스크
제16장 경쟁 분석
- 기업 개요
- 기업 순위 지수
- 기업의 시장 포지셔닝
- Als Spices
- AR RAHMAN SPICES
- Cardex SA
- Del Tropico SA
- EVEREST Food Products Pvt. Ltd.
- Greenfield Bio Plantations Pvt. Ltd.
- Imexa Inc.
- Kautilya Commodities
- KLG Spice
- MAS Enterprises Ltd.
- McCormick and Co. Inc.
- Organic Spices Inc.
- Pristine Organics Pvt. Ltd.
- ROYAL SPICES
- Woodland Foods Ltd.
제17장 부록
KSM 25.06.20The cardamom market is forecasted to grow by USD 195.3 mn during 2024-2029, accelerating at a CAGR of 3.1% during the forecast period. The report on the cardamom market provides a holistic analysis, market size and forecast, trends, growth drivers, and challenges, as well as vendor analysis covering around 25 vendors.
The report offers an up-to-date analysis regarding the current market scenario, the latest trends and drivers, and the overall market environment. The market is driven by growing awareness about health benefits of cardamom, increasing use of cardamom in developing countries, and multifaceted nature of cardamom.
| Market Scope | |
|---|---|
| Base Year | 2025 |
| End Year | 2029 |
| Series Year | 2025-2029 |
| Growth Momentum | Accelerate |
| YOY 2025 | 3% |
| CAGR | 3.1% |
| Incremental Value | $195.3 mn |
The study was conducted using an objective combination of primary and secondary information including inputs from key participants in the industry. The report contains a comprehensive market size data, segment with regional analysis and vendor landscape in addition to an analysis of the key companies. Reports have historic and forecast data.
Technavio's cardamom market is segmented as below:
By Product
- Ingredients
- Powder
- Liquid extract
By Application
- Food and beverages
- Medical usage
- Others
By Type
- Green cardamom
- Black cardamom
- White cardamom
By Distribution Channel
- Offline
- Online
By Geographical Landscape
- APAC
- Europe
- Middle East and Africa
- North America
- South America
This study identifies the growing prominence for online shopping as one of the prime reasons driving the cardamom market growth during the next few years. Also, growing demand for organic cardamom and growing emphasis on packaging innovations will lead to sizable demand in the market.
The report on the cardamom market covers the following areas:
- Cardamom Market sizing
- Cardamom Market forecast
- Cardamom Market industry analysis
The robust vendor analysis is designed to help clients improve their market position, and in line with this, this report provides a detailed analysis of several leading cardamom market vendors that include Als Spices, AR RAHMAN SPICES, Biofoods Pvt. Ltd., Cardex SA, Del Tropico SA, E Silk Route Ventures Pvt. Ltd., EVEREST Food Products Pvt. Ltd., Greenfield Bio Plantations Pvt. Ltd., Imexa Inc., Kautilya Commodities, KLG Spice, MAS Enterprises Ltd., McCormick and Co. Inc., Organic Spices Inc., Pristine Organics Pvt. Ltd., ROYAL SPICES, South Indian Green Cardamom Co. Ltd., Sujep wachstum Enterprises, Synthite Industries Pvt. Ltd., and Woodland Foods Ltd.. Also, the cardamom market analysis report includes information on upcoming trends and challenges that will influence market growth. This is to help companies strategize and leverage all forthcoming growth opportunities.
The publisher presents a detailed picture of the market by the way of study, synthesis, and summation of data from multiple sources by an analysis of key parameters such as profit, pricing, competition, and promotions. It presents various market facets by identifying the key industry influencers. The data presented is comprehensive, reliable, and a result of extensive primary and secondary research. The market research reports provide a complete competitive landscape and an in-depth vendor selection methodology and analysis using qualitative and quantitative research to forecast accurate market growth.
Table of Contents
1 Executive Summary
- 1.1 Market overview
- Executive Summary - Chart on Market Overview
- Executive Summary - Data Table on Market Overview
- Executive Summary - Chart on Global Market Characteristics
- Executive Summary - Chart on Market By Geographical Landscape
- Executive Summary - Chart on Market Segmentation by Product
- Executive Summary - Chart on Market Segmentation by Application
- Executive Summary - Chart on Market Segmentation by Type
- Executive Summary - Chart on Market Segmentation by Distribution Channel
- Executive Summary - Chart on Incremental Growth
- Executive Summary - Data Table on Incremental Growth
- Executive Summary - Chart on Company Market Positioning
2 Technavio Analysis
- 2.1 Analysis of price sensitivity, lifecycle, customer purchase basket, adoption rates, and purchase criteria
- Analysis of price sensitivity, lifecycle, customer purchase basket, adoption rates, and purchase criteria
- 2.2 Criticality of inputs and Factors of differentiation
- Overview on criticality of inputs and factors of differentiation
- 2.3 Factors of disruption
- Overview on factors of disruption
- 2.4 Impact of drivers and challenges
- Impact of drivers and challenges in 2024 and 2029
3 Market Landscape
- 3.1 Market ecosystem
- Parent Market
- Data Table on - Parent Market
- 3.2 Market characteristics
- Market characteristics analysis
- 3.3 Value chain analysis
- Value chain analysis
4 Market Sizing
- 4.1 Market definition
- Offerings of companies included in the market definition
- 4.2 Market segment analysis
- Market segments
- 4.3 Market size 2024
- 4.4 Market outlook: Forecast for 2024-2029
- Chart on Global - Market size and forecast 2024-2029 ($ million)
- Data Table on Global - Market size and forecast 2024-2029 ($ million)
- Chart on Global Market: Year-over-year growth 2024-2029 (%)
- Data Table on Global Market: Year-over-year growth 2024-2029 (%)
5 Historic Market Size
- 5.1 Global Cardamom Market 2019 - 2023
- Historic Market Size - Data Table on Global Cardamom Market 2019 - 2023 ($ million)
- 5.2 Product segment analysis 2019 - 2023
- Historic Market Size - Product Segment 2019 - 2023 ($ million)
- 5.3 Application segment analysis 2019 - 2023
- Historic Market Size - Application Segment 2019 - 2023 ($ million)
- 5.4 Type segment analysis 2019 - 2023
- Historic Market Size - Type Segment 2019 - 2023 ($ million)
- 5.5 Distribution Channel segment analysis 2019 - 2023
- Historic Market Size - Distribution Channel Segment 2019 - 2023 ($ million)
- 5.6 Geography segment analysis 2019 - 2023
- Historic Market Size - Geography Segment 2019 - 2023 ($ million)
- 5.7 Country segment analysis 2019 - 2023
- Historic Market Size - Country Segment 2019 - 2023 ($ million)
6 Qualitative Analysis
- 6.1 The impact of AI in the global cardamom market
7 Five Forces Analysis
- 7.1 Five forces summary
- Five forces analysis - Comparison between 2024 and 2029
- 7.2 Bargaining power of buyers
- Bargaining power of buyers - Impact of key factors 2024 and 2029
- 7.3 Bargaining power of suppliers
- Bargaining power of suppliers - Impact of key factors in 2024 and 2029
- 7.4 Threat of new entrants
- Threat of new entrants - Impact of key factors in 2024 and 2029
- 7.5 Threat of substitutes
- Threat of substitutes - Impact of key factors in 2024 and 2029
- 7.6 Threat of rivalry
- Threat of rivalry - Impact of key factors in 2024 and 2029
- 7.7 Market condition
- Chart on Market condition - Five forces 2024 and 2029
8 Market Segmentation by Product
- 8.1 Market segments
- Chart on Product - Market share 2024-2029 (%)
- Data Table on Product - Market share 2024-2029 (%)
- 8.2 Comparison by Product
- Chart on Comparison by Product
- Data Table on Comparison by Product
- 8.3 Ingredients - Market size and forecast 2024-2029
- Chart on Ingredients - Market size and forecast 2024-2029 ($ million)
- Data Table on Ingredients - Market size and forecast 2024-2029 ($ million)
- Chart on Ingredients - Year-over-year growth 2024-2029 (%)
- Data Table on Ingredients - Year-over-year growth 2024-2029 (%)
- 8.4 Powder - Market size and forecast 2024-2029
- Chart on Powder - Market size and forecast 2024-2029 ($ million)
- Data Table on Powder - Market size and forecast 2024-2029 ($ million)
- Chart on Powder - Year-over-year growth 2024-2029 (%)
- Data Table on Powder - Year-over-year growth 2024-2029 (%)
- 8.5 Liquid extract - Market size and forecast 2024-2029
- Chart on Liquid extract - Market size and forecast 2024-2029 ($ million)
- Data Table on Liquid extract - Market size and forecast 2024-2029 ($ million)
- Chart on Liquid extract - Year-over-year growth 2024-2029 (%)
- Data Table on Liquid extract - Year-over-year growth 2024-2029 (%)
- 8.6 Market opportunity by Product
- Market opportunity by Product ($ million)
- Data Table on Market opportunity by Product ($ million)
9 Market Segmentation by Application
- 9.1 Market segments
- Chart on Application - Market share 2024-2029 (%)
- Data Table on Application - Market share 2024-2029 (%)
- 9.2 Comparison by Application
- Chart on Comparison by Application
- Data Table on Comparison by Application
- 9.3 Food and beverages - Market size and forecast 2024-2029
- Chart on Food and beverages - Market size and forecast 2024-2029 ($ million)
- Data Table on Food and beverages - Market size and forecast 2024-2029 ($ million)
- Chart on Food and beverages - Year-over-year growth 2024-2029 (%)
- Data Table on Food and beverages - Year-over-year growth 2024-2029 (%)
- 9.4 Medical usage - Market size and forecast 2024-2029
- Chart on Medical usage - Market size and forecast 2024-2029 ($ million)
- Data Table on Medical usage - Market size and forecast 2024-2029 ($ million)
- Chart on Medical usage - Year-over-year growth 2024-2029 (%)
- Data Table on Medical usage - Year-over-year growth 2024-2029 (%)
- 9.5 Others - Market size and forecast 2024-2029
- Chart on Others - Market size and forecast 2024-2029 ($ million)
- Data Table on Others - Market size and forecast 2024-2029 ($ million)
- Chart on Others - Year-over-year growth 2024-2029 (%)
- Data Table on Others - Year-over-year growth 2024-2029 (%)
- 9.6 Market opportunity by Application
- Market opportunity by Application ($ million)
- Data Table on Market opportunity by Application ($ million)
10 Market Segmentation by Type
- 10.1 Market segments
- Chart on Type - Market share 2024-2029 (%)
- Data Table on Type - Market share 2024-2029 (%)
- 10.2 Comparison by Type
- Chart on Comparison by Type
- Data Table on Comparison by Type
- 10.3 Green cardamom - Market size and forecast 2024-2029
- Chart on Green cardamom - Market size and forecast 2024-2029 ($ million)
- Data Table on Green cardamom - Market size and forecast 2024-2029 ($ million)
- Chart on Green cardamom - Year-over-year growth 2024-2029 (%)
- Data Table on Green cardamom - Year-over-year growth 2024-2029 (%)
- 10.4 Black cardamom - Market size and forecast 2024-2029
- Chart on Black cardamom - Market size and forecast 2024-2029 ($ million)
- Data Table on Black cardamom - Market size and forecast 2024-2029 ($ million)
- Chart on Black cardamom - Year-over-year growth 2024-2029 (%)
- Data Table on Black cardamom - Year-over-year growth 2024-2029 (%)
- 10.5 White cardamom - Market size and forecast 2024-2029
- Chart on White cardamom - Market size and forecast 2024-2029 ($ million)
- Data Table on White cardamom - Market size and forecast 2024-2029 ($ million)
- Chart on White cardamom - Year-over-year growth 2024-2029 (%)
- Data Table on White cardamom - Year-over-year growth 2024-2029 (%)
- 10.6 Market opportunity by Type
- Market opportunity by Type ($ million)
- Data Table on Market opportunity by Type ($ million)
11 Market Segmentation by Distribution Channel
- 11.1 Market segments
- Chart on Distribution Channel - Market share 2024-2029 (%)
- Data Table on Distribution Channel - Market share 2024-2029 (%)
- 11.2 Comparison by Distribution Channel
- Chart on Comparison by Distribution Channel
- Data Table on Comparison by Distribution Channel
- 11.3 Offline - Market size and forecast 2024-2029
- Chart on Offline - Market size and forecast 2024-2029 ($ million)
- Data Table on Offline - Market size and forecast 2024-2029 ($ million)
- Chart on Offline - Year-over-year growth 2024-2029 (%)
- Data Table on Offline - Year-over-year growth 2024-2029 (%)
- 11.4 Online - Market size and forecast 2024-2029
- Chart on Online - Market size and forecast 2024-2029 ($ million)
- Data Table on Online - Market size and forecast 2024-2029 ($ million)
- Chart on Online - Year-over-year growth 2024-2029 (%)
- Data Table on Online - Year-over-year growth 2024-2029 (%)
- 11.5 Market opportunity by Distribution Channel
- Market opportunity by Distribution Channel ($ million)
- Data Table on Market opportunity by Distribution Channel ($ million)
12 Customer Landscape
- 12.1 Customer landscape overview
- Analysis of price sensitivity, lifecycle, customer purchase basket, adoption rates, and purchase criteria
13 Geographic Landscape
- 13.1 Geographic segmentation
- Chart on Market share By Geographical Landscape 2024-2029 (%)
- Data Table on Market share By Geographical Landscape 2024-2029 (%)
- 13.2 Geographic comparison
- Chart on Geographic comparison
- Data Table on Geographic comparison
- 13.3 APAC - Market size and forecast 2024-2029
- Chart on APAC - Market size and forecast 2024-2029 ($ million)
- Data Table on APAC - Market size and forecast 2024-2029 ($ million)
- Chart on APAC - Year-over-year growth 2024-2029 (%)
- Data Table on APAC - Year-over-year growth 2024-2029 (%)
- 13.4 Europe - Market size and forecast 2024-2029
- Chart on Europe - Market size and forecast 2024-2029 ($ million)
- Data Table on Europe - Market size and forecast 2024-2029 ($ million)
- Chart on Europe - Year-over-year growth 2024-2029 (%)
- Data Table on Europe - Year-over-year growth 2024-2029 (%)
- 13.5 Middle East and Africa - Market size and forecast 2024-2029
- Chart on Middle East and Africa - Market size and forecast 2024-2029 ($ million)
- Data Table on Middle East and Africa - Market size and forecast 2024-2029 ($ million)
- Chart on Middle East and Africa - Year-over-year growth 2024-2029 (%)
- Data Table on Middle East and Africa - Year-over-year growth 2024-2029 (%)
- 13.6 North America - Market size and forecast 2024-2029
- Chart on North America - Market size and forecast 2024-2029 ($ million)
- Data Table on North America - Market size and forecast 2024-2029 ($ million)
- Chart on North America - Year-over-year growth 2024-2029 (%)
- Data Table on North America - Year-over-year growth 2024-2029 (%)
- 13.7 South America - Market size and forecast 2024-2029
- Chart on South America - Market size and forecast 2024-2029 ($ million)
- Data Table on South America - Market size and forecast 2024-2029 ($ million)
- Chart on South America - Year-over-year growth 2024-2029 (%)
- Data Table on South America - Year-over-year growth 2024-2029 (%)
- 13.8 China - Market size and forecast 2024-2029
- Chart on China - Market size and forecast 2024-2029 ($ million)
- Data Table on China - Market size and forecast 2024-2029 ($ million)
- Chart on China - Year-over-year growth 2024-2029 (%)
- Data Table on China - Year-over-year growth 2024-2029 (%)
- 13.9 India - Market size and forecast 2024-2029
- Chart on India - Market size and forecast 2024-2029 ($ million)
- Data Table on India - Market size and forecast 2024-2029 ($ million)
- Chart on India - Year-over-year growth 2024-2029 (%)
- Data Table on India - Year-over-year growth 2024-2029 (%)
- 13.10 US - Market size and forecast 2024-2029
- Chart on US - Market size and forecast 2024-2029 ($ million)
- Data Table on US - Market size and forecast 2024-2029 ($ million)
- Chart on US - Year-over-year growth 2024-2029 (%)
- Data Table on US - Year-over-year growth 2024-2029 (%)
- 13.11 Saudi Arabia - Market size and forecast 2024-2029
- Chart on Saudi Arabia - Market size and forecast 2024-2029 ($ million)
- Data Table on Saudi Arabia - Market size and forecast 2024-2029 ($ million)
- Chart on Saudi Arabia - Year-over-year growth 2024-2029 (%)
- Data Table on Saudi Arabia - Year-over-year growth 2024-2029 (%)
- 13.12 Germany - Market size and forecast 2024-2029
- Chart on Germany - Market size and forecast 2024-2029 ($ million)
- Data Table on Germany - Market size and forecast 2024-2029 ($ million)
- Chart on Germany - Year-over-year growth 2024-2029 (%)
- Data Table on Germany - Year-over-year growth 2024-2029 (%)
- 13.13 Japan - Market size and forecast 2024-2029
- Chart on Japan - Market size and forecast 2024-2029 ($ million)
- Data Table on Japan - Market size and forecast 2024-2029 ($ million)
- Chart on Japan - Year-over-year growth 2024-2029 (%)
- Data Table on Japan - Year-over-year growth 2024-2029 (%)
- 13.14 UK - Market size and forecast 2024-2029
- Chart on UK - Market size and forecast 2024-2029 ($ million)
- Data Table on UK - Market size and forecast 2024-2029 ($ million)
- Chart on UK - Year-over-year growth 2024-2029 (%)
- Data Table on UK - Year-over-year growth 2024-2029 (%)
- 13.15 United Arab Emirates - Market size and forecast 2024-2029
- Chart on United Arab Emirates - Market size and forecast 2024-2029 ($ million)
- Data Table on United Arab Emirates - Market size and forecast 2024-2029 ($ million)
- Chart on United Arab Emirates - Year-over-year growth 2024-2029 (%)
- Data Table on United Arab Emirates - Year-over-year growth 2024-2029 (%)
- 13.16 South Korea - Market size and forecast 2024-2029
- Chart on South Korea - Market size and forecast 2024-2029 ($ million)
- Data Table on South Korea - Market size and forecast 2024-2029 ($ million)
- Chart on South Korea - Year-over-year growth 2024-2029 (%)
- Data Table on South Korea - Year-over-year growth 2024-2029 (%)
- 13.17 Italy - Market size and forecast 2024-2029
- Chart on Italy - Market size and forecast 2024-2029 ($ million)
- Data Table on Italy - Market size and forecast 2024-2029 ($ million)
- Chart on Italy - Year-over-year growth 2024-2029 (%)
- Data Table on Italy - Year-over-year growth 2024-2029 (%)
- 13.18 Market opportunity By Geographical Landscape
- Market opportunity By Geographical Landscape ($ million)
- Data Tables on Market opportunity By Geographical Landscape ($ million)
14 Drivers, Challenges, and Opportunity/Restraints
- 14.1 Market drivers
- 14.2 Market challenges
- 14.3 Impact of drivers and challenges
- Impact of drivers and challenges in 2024 and 2029
- 14.4 Market opportunities/restraints
15 Competitive Landscape
- 15.1 Overview
- 15.2 Competitive Landscape
- Overview on criticality of inputs and factors of differentiation
- 15.3 Landscape disruption
- Overview on factors of disruption
- 15.4 Industry risks
- Impact of key risks on business
16 Competitive Analysis
- 16.1 Companies profiled
- Companies covered
- 16.2 Company ranking index
- Company ranking index
- 16.3 Market positioning of companies
- Matrix on companies position and classification
- 16.4 Als Spices
- Als Spices - Overview
- Als Spices - Product / Service
- Als Spices - Key offerings
- SWOT
- 16.5 AR RAHMAN SPICES
- AR RAHMAN SPICES - Overview
- AR RAHMAN SPICES - Product / Service
- AR RAHMAN SPICES - Key offerings
- SWOT
- 16.6 Cardex SA
- Cardex SA - Overview
- Cardex SA - Product / Service
- Cardex SA - Key offerings
- SWOT
- 16.7 Del Tropico SA
- Del Tropico SA - Overview
- Del Tropico SA - Product / Service
- Del Tropico SA - Key offerings
- SWOT
- 16.8 EVEREST Food Products Pvt. Ltd.
- EVEREST Food Products Pvt. Ltd. - Overview
- EVEREST Food Products Pvt. Ltd. - Product / Service
- EVEREST Food Products Pvt. Ltd. - Key offerings
- SWOT
- 16.9 Greenfield Bio Plantations Pvt. Ltd.
- Greenfield Bio Plantations Pvt. Ltd. - Overview
- Greenfield Bio Plantations Pvt. Ltd. - Product / Service
- Greenfield Bio Plantations Pvt. Ltd. - Key offerings
- SWOT
- 16.10 Imexa Inc.
- Imexa Inc. - Overview
- Imexa Inc. - Product / Service
- Imexa Inc. - Key offerings
- SWOT
- 16.11 Kautilya Commodities
- Kautilya Commodities - Overview
- Kautilya Commodities - Product / Service
- Kautilya Commodities - Key offerings
- SWOT
- 16.12 KLG Spice
- KLG Spice - Overview
- KLG Spice - Product / Service
- KLG Spice - Key offerings
- SWOT
- 16.13 MAS Enterprises Ltd.
- MAS Enterprises Ltd. - Overview
- MAS Enterprises Ltd. - Product / Service
- MAS Enterprises Ltd. - Key offerings
- SWOT
- 16.14 McCormick and Co. Inc.
- McCormick and Co. Inc. - Overview
- McCormick and Co. Inc. - Business segments
- McCormick and Co. Inc. - Key news
- McCormick and Co. Inc. - Key offerings
- McCormick and Co. Inc. - Segment focus
- SWOT
- 16.15 Organic Spices Inc.
- Organic Spices Inc. - Overview
- Organic Spices Inc. - Product / Service
- Organic Spices Inc. - Key offerings
- SWOT
- 16.16 Pristine Organics Pvt. Ltd.
- Pristine Organics Pvt. Ltd. - Overview
- Pristine Organics Pvt. Ltd. - Product / Service
- Pristine Organics Pvt. Ltd. - Key offerings
- SWOT
- 16.17 ROYAL SPICES
- ROYAL SPICES - Overview
- ROYAL SPICES - Product / Service
- ROYAL SPICES - Key offerings
- SWOT
- 16.18 Woodland Foods Ltd.
- Woodland Foods Ltd. - Overview
- Woodland Foods Ltd. - Product / Service
- Woodland Foods Ltd. - Key offerings
- SWOT
17 Appendix
- 17.1 Scope of the report
- 17.2 Inclusions and exclusions checklist
- Inclusions checklist
- Exclusions checklist
- 17.3 Currency conversion rates for US$
- Currency conversion rates for US$
- 17.4 Research methodology
- Research methodology
- 17.5 Data procurement
- Information sources
- 17.6 Data validation
- Data validation
- 17.7 Validation techniques employed for market sizing
- Validation techniques employed for market sizing
- 17.8 Data synthesis
- Data synthesis
- 17.9 360 degree market analysis
- 360 degree market analysis
- 17.10 List of abbreviations
- List of abbreviations