|
시장보고서
상품코드
1502377
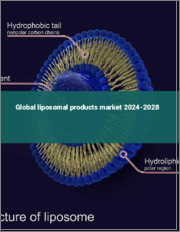
리포솜 제품 시장(2024-2028년)Global liposomal products market 2024-2028 |
||||||
테크나비오(Technavio)는 리포좀 제품 시장을 모니터링하고 있으며, 2023년부터 2028년까지 39억 9,550만 달러, 예측 기간 동안 10.87%의 CAGR로 성장할 것으로 예측하고 있습니다.
본 보고서에서는 리포좀 제품 시장에 대한 전반적인 분석, 시장 규모와 예측, 동향, 성장 촉진요인, 과제, 약 25개 벤더를 포함한 벤더 분석 등의 정보를 전해드립니다.
현재 시장 시나리오, 최신 동향 및 촉진요인, 전체 시장 환경에 대한 최신 분석을 제공합니다. 이 시장은 곰팡이 질환의 발병률 증가, 암 환자의 유병률 증가, 암 치료와 관련된 많은 부작용에 의해 주도되고 있습니다.
| 시장 범위 | |
|---|---|
| 기준 연도 | 2024 |
| 종료 연도 | 2028 |
| 예측 기간 | 2024-2028 |
| 성장 모멘텀 | 가속 |
| 전년 대비 2024년 | 9.53% |
| CAGR | 10.87% |
| 증분 금액 | 39억 9,550만 달러 |
이 보고서는 향후 몇 년간 리포솜 제품 시장 성장을 주도할 주요 요인 중 하나로 기존 공정보다 QBD(Quality by Design)의 채택이 증가하고 있다는 점을 꼽았습니다. 또한, 전략적 협업의 증가와 소수성 물질의 순환 시간을 향상시키는 리포솜 제품의 인기가 높아짐에 따라 시장 수요가 크게 증가할 것으로 예상됩니다.
목차
제1장 주요 요약
- 시장 개요
제2장 시장 상황
- 시장 생태계
- 시장 특징
- 밸류체인 분석
제3장 시장 규모 평가
- 시장 정의
- 시장 부문 분석
- 시장 규모 2023
- 시장 전망 2023-2028
제4장 시장 규모 실적
- 세계 리포솜 제품 시장 2018-2022
- 용도별 부문 분석 2018-2022
- 유형별 부문 분석 2018-2022
- 지역별 부문 분석 2018-2022
- 국가별 부문 분석 2018-2022
제5장 Five Forces 분석
- Five Forces 요약
- 구매자의 교섭력
- 공급 기업의 교섭력
- 신규 참여업체의 위협
- 대체품의 위협
- 경쟁의 위협
- 시장 상황
제6장 시장 세분화 : 용도별
- 시장 세분화
- 비교 : 용도별
- 암 : 시장 규모와 예측 2023-2028
- 진균 감염증 : 시장 규모와 예측 2023-2028
- 통증 관리 : 시장 규모와 예측 2023-2028
- 바이러스 백신 : 시장 규모와 예측 2023-2028
- 광역학 요법 : 시장 규모와 예측 2023-2028
- 시장 기회 : 용도별
제7장 시장 세분화 : 유형별
- 시장 세분화
- 비교 : 유형별
- 브랜드 : 시장 규모와 예측 2023-2028
- 제네릭 : 시장 규모와 예측 2023-2028
- 시장 기회 : 유형별
제8장 고객 상황
- 고객 상황 개요
제9장 지역별 상황
- 지역별 세분화
- 지역별 비교
- 북미 : 시장 규모와 예측 2023-2028
- 유럽 : 시장 규모와 예측 2023-2028
- 아시아 : 시장 규모와 예측 2023-2028
- 세계 기타 지역 : 시장 규모와 예측 2023-2028
- 미국 : 시장 규모와 예측 2023-2028
- 중국 : 시장 규모와 예측 2023-2028
- 독일 : 시장 규모와 예측 2023-2028
- 프랑스 : 시장 규모와 예측 2023-2028
- 일본 : 시장 규모와 예측 2023-2028
- 시장 기회 : 지역별
제10장 촉진요인, 과제, 기회, 억제요인
- 시장 성장 촉진요인
- 시장 과제
- 성장 촉진요인과 과제의 영향
- 시장 기회·억제요인
제11장 경쟁 상황
- 개요
- 경쟁 상황
- 혼란 상황
- 업계 리스크
제12장 경쟁 분석
- 기업 개요
- 기업의 시장 포지셔닝
- Acthera Therapeutics AG
- Bausch Lomb Corp.
- Baxter International Inc.
- Galen Ltd.
- Gilead Sciences Inc.
- Innocan Pharma Corp. Ltd.
- Johnson and Johnson Services Inc.
- Leadiant Biosciences Inc.
- Liposoma B.V.
- Merrimack Pharmaceuticals Inc.
- Pacira BioSciences Inc.
- Spectrum Pharmaceuticals Inc.
- Takeda Pharmaceutical Co. Ltd.
- The Lubrizol Corp.
- Viatris Inc.
제13장 부록
ksm 24.07.08Technavio has been monitoring the liposomal products market and is forecast to grow by USD 3995.5 mn during 2023-2028, accelerating at a CAGR of 10.87% during the forecast period. Our report on the liposomal products market provides a holistic analysis, market size and forecast, trends, growth drivers, and challenges, as well as vendor analysis covering around 25 vendors.
The report offers an up-to-date analysis regarding the current market scenario, the latest trends and drivers, and the overall market environment. The market is driven by rising incidence of fungal disorders, growing prevalence of cancer cases, and many side effects are associated with cancer treatment.
Technavio's liposomal products market is segmented as below:
| Market Scope | |
|---|---|
| Base Year | 2024 |
| End Year | 2028 |
| Series Year | 2024-2028 |
| Growth Momentum | Accelerate |
| YOY 2024 | 9.53% |
| CAGR | 10.87% |
| Incremental Value | $3995.5mn |
By Application
- Cancer
- Fungal infections
- Pain management
- Viral vaccines
- Photodynamic therapy
By Type
- Branded
- Generic
By Geography
- North America
- Europe
- Asia
- Rest of World (ROW)
This study identifies the rising adoption of quality by design (QBD) over traditional processes as one of the prime reasons driving the liposomal products market growth during the next few years. Also, increase in strategic collaboration and rising popularity of liposomal products with enhancing circulation time of hydrophobic substances will lead to sizable demand in the market.
Technavio presents a detailed picture of the market by the way of study, synthesis, and summation of data from multiple sources by an analysis of key parameters. Our report on the liposomal products market covers the following areas:
- Liposomal products market sizing
- Liposomal products market forecast
- Liposomal products market industry analysis
Technavio's robust vendor analysis is designed to help clients improve their market position, and in line with this, this report provides a detailed analysis of several leading liposomal products market vendors that include Acthera Therapeutics AG, Bausch Lomb Corp., Baxter International Inc., Galen Ltd., GENFIT SA, Gilead Sciences Inc., Innocan Pharma Corp. Ltd., Johnson and Johnson Services Inc., Leadiant Biosciences Inc., Lipella Pharmaceuticals Inc., Liposoma B.V., Merrimack Pharmaceuticals Inc., Nanovex Biotechnologies SL, Pacira BioSciences Inc., Spectrum Pharmaceuticals Inc., Taiwan Liposome Co. Ltd., Takeda Pharmaceutical Co. Ltd., The Lubrizol Corp., Vascular Biosciences, and Viatris Inc.. Also, the liposomal products market analysis report includes information on upcoming trends and challenges that will influence market growth. This is to help companies strategize and leverage all forthcoming growth opportunities.
The study was conducted using an objective combination of primary and secondary information including inputs from key participants in the industry. The report contains a comprehensive market and vendor landscape in addition to an analysis of the key vendors.
Technavio presents a detailed picture of the market by the way of study, synthesis, and summation of data from multiple sources by an analysis of key parameters such as profit, pricing, competition, and promotions. It presents various market facets by identifying the key industry influencers. The data presented is comprehensive, reliable, and a result of extensive research - both primary and secondary. Technavio's market research reports provide a complete competitive landscape and an in-depth vendor selection methodology and analysis using qualitative and quantitative research to forecast accurate market growth.
Table of Contents
1 Executive Summary
- 1.1 Market overview
- Executive Summary - Chart on Market Overview
- Executive Summary - Data Table on Market Overview
- Executive Summary - Chart on Global Market Characteristics
- Executive Summary - Chart on Market by Geography
- Executive Summary - Chart on Market Segmentation by Application
- Executive Summary - Chart on Market Segmentation by Type
- Executive Summary - Chart on Incremental Growth
- Executive Summary - Data Table on Incremental Growth
- Executive Summary - Chart on Company Market Positioning
2 Market Landscape
- 2.1 Market ecosystem
- Parent Market
- Data Table on - Parent Market
- 2.2 Market characteristics
- Market characteristics analysis
- 2.3 Value chain analysis
- Value Chain Analysis
3 Market Sizing
- 3.1 Market definition
- Offerings of companies included in the market definition
- 3.2 Market segment analysis
- Market segments
- 3.3 Market size 2023
- 3.4 Market outlook: Forecast for 2023-2028
- Chart on Global - Market size and forecast 2023-2028 ($ million)
- Data Table on Global - Market size and forecast 2023-2028 ($ million)
- Chart on Global Market: Year-over-year growth 2023-2028 (%)
- Data Table on Global Market: Year-over-year growth 2023-2028 (%)
4 Historic Market Size
- 4.1 Global Liposomal Products Market 2018 - 2022
- Historic Market Size - Data Table on Global Liposomal Products Market 2018 - 2022 ($ million)
- 4.2 Application segment analysis 2018 - 2022
- Historic Market Size - Application Segment 2018 - 2022 ($ million)
- 4.3 Type segment analysis 2018 - 2022
- Historic Market Size - Type Segment 2018 - 2022 ($ million)
- 4.4 Geography segment analysis 2018 - 2022
- Historic Market Size - Geography Segment 2018 - 2022 ($ million)
- 4.5 Country segment analysis 2018 - 2022
- Historic Market Size - Country Segment 2018 - 2022 ($ million)
5 Five Forces Analysis
- 5.1 Five forces summary
- Five forces analysis - Comparison between 2023 and 2028
- 5.2 Bargaining power of buyers
- Bargaining power of buyers - Impact of key factors 2023 and 2028
- 5.3 Bargaining power of suppliers
- Bargaining power of suppliers - Impact of key factors in 2023 and 2028
- 5.4 Threat of new entrants
- Threat of new entrants - Impact of key factors in 2023 and 2028
- 5.5 Threat of substitutes
- Threat of substitutes - Impact of key factors in 2023 and 2028
- 5.6 Threat of rivalry
- Threat of rivalry - Impact of key factors in 2023 and 2028
- 5.7 Market condition
- Chart on Market condition - Five forces 2023 and 2028
6 Market Segmentation by Application
- 6.1 Market segments
- Chart on Application - Market share 2023-2028 (%)
- Data Table on Application - Market share 2023-2028 (%)
- 6.2 Comparison by Application
- Chart on Comparison by Application
- Data Table on Comparison by Application
- 6.3 Cancer - Market size and forecast 2023-2028
- Chart on Cancer - Market size and forecast 2023-2028 ($ million)
- Data Table on Cancer - Market size and forecast 2023-2028 ($ million)
- Chart on Cancer - Year-over-year growth 2023-2028 (%)
- Data Table on Cancer - Year-over-year growth 2023-2028 (%)
- 6.4 Fungal infections - Market size and forecast 2023-2028
- Chart on Fungal infections - Market size and forecast 2023-2028 ($ million)
- Data Table on Fungal infections - Market size and forecast 2023-2028 ($ million)
- Chart on Fungal infections - Year-over-year growth 2023-2028 (%)
- Data Table on Fungal infections - Year-over-year growth 2023-2028 (%)
- 6.5 Pain management - Market size and forecast 2023-2028
- Chart on Pain management - Market size and forecast 2023-2028 ($ million)
- Data Table on Pain management - Market size and forecast 2023-2028 ($ million)
- Chart on Pain management - Year-over-year growth 2023-2028 (%)
- Data Table on Pain management - Year-over-year growth 2023-2028 (%)
- 6.6 Viral vaccines - Market size and forecast 2023-2028
- Chart on Viral vaccines - Market size and forecast 2023-2028 ($ million)
- Data Table on Viral vaccines - Market size and forecast 2023-2028 ($ million)
- Chart on Viral vaccines - Year-over-year growth 2023-2028 (%)
- Data Table on Viral vaccines - Year-over-year growth 2023-2028 (%)
- 6.7 Photodynamic therapy - Market size and forecast 2023-2028
- Chart on Photodynamic therapy - Market size and forecast 2023-2028 ($ million)
- Data Table on Photodynamic therapy - Market size and forecast 2023-2028 ($ million)
- Chart on Photodynamic therapy - Year-over-year growth 2023-2028 (%)
- Data Table on Photodynamic therapy - Year-over-year growth 2023-2028 (%)
- 6.8 Market opportunity by Application
- Market opportunity by Application ($ million)
- Data Table on Market opportunity by Application ($ million)
7 Market Segmentation by Type
- 7.1 Market segments
- Chart on Type - Market share 2023-2028 (%)
- Data Table on Type - Market share 2023-2028 (%)
- 7.2 Comparison by Type
- Chart on Comparison by Type
- Data Table on Comparison by Type
- 7.3 Branded - Market size and forecast 2023-2028
- Chart on Branded - Market size and forecast 2023-2028 ($ million)
- Data Table on Branded - Market size and forecast 2023-2028 ($ million)
- Chart on Branded - Year-over-year growth 2023-2028 (%)
- Data Table on Branded - Year-over-year growth 2023-2028 (%)
- 7.4 Generic - Market size and forecast 2023-2028
- Chart on Generic - Market size and forecast 2023-2028 ($ million)
- Data Table on Generic - Market size and forecast 2023-2028 ($ million)
- Chart on Generic - Year-over-year growth 2023-2028 (%)
- Data Table on Generic - Year-over-year growth 2023-2028 (%)
- 7.5 Market opportunity by Type
- Market opportunity by Type ($ million)
- Data Table on Market opportunity by Type ($ million)
8 Customer Landscape
- 8.1 Customer landscape overview
- Analysis of price sensitivity, lifecycle, customer purchase basket, adoption rates, and purchase criteria
9 Geographic Landscape
- 9.1 Geographic segmentation
- Chart on Market share By Geographical Landscape2023-2028 (%)
- Data Table on Market share By Geographical Landscape2023-2028 (%)
- 9.2 Geographic comparison
- Chart on Geographic comparison
- Data Table on Geographic comparison
- 9.3 North America - Market size and forecast 2023-2028
- Chart on North America - Market size and forecast 2023-2028 ($ million)
- Data Table on North America - Market size and forecast 2023-2028 ($ million)
- Chart on North America - Year-over-year growth 2023-2028 (%)
- Data Table on North America - Year-over-year growth 2023-2028 (%)
- 9.4 Europe - Market size and forecast 2023-2028
- Chart on Europe - Market size and forecast 2023-2028 ($ million)
- Data Table on Europe - Market size and forecast 2023-2028 ($ million)
- Chart on Europe - Year-over-year growth 2023-2028 (%)
- Data Table on Europe - Year-over-year growth 2023-2028 (%)
- 9.5 Asia - Market size and forecast 2023-2028
- Chart on Asia - Market size and forecast 2023-2028 ($ million)
- Data Table on Asia - Market size and forecast 2023-2028 ($ million)
- Chart on Asia - Year-over-year growth 2023-2028 (%)
- Data Table on Asia - Year-over-year growth 2023-2028 (%)
- 9.6 Rest of World (ROW) - Market size and forecast 2023-2028
- Chart on Rest of World (ROW) - Market size and forecast 2023-2028 ($ million)
- Data Table on Rest of World (ROW) - Market size and forecast 2023-2028 ($ million)
- Chart on Rest of World (ROW) - Year-over-year growth 2023-2028 (%)
- Data Table on Rest of World (ROW) - Year-over-year growth 2023-2028 (%)
- 9.7 US - Market size and forecast 2023-2028
- Chart on US - Market size and forecast 2023-2028 ($ million)
- Data Table on US - Market size and forecast 2023-2028 ($ million)
- Chart on US - Year-over-year growth 2023-2028 (%)
- Data Table on US - Year-over-year growth 2023-2028 (%)
- 9.8 China - Market size and forecast 2023-2028
- Chart on China - Market size and forecast 2023-2028 ($ million)
- Data Table on China - Market size and forecast 2023-2028 ($ million)
- Chart on China - Year-over-year growth 2023-2028 (%)
- Data Table on China - Year-over-year growth 2023-2028 (%)
- 9.9 Germany - Market size and forecast 2023-2028
- Chart on Germany - Market size and forecast 2023-2028 ($ million)
- Data Table on Germany - Market size and forecast 2023-2028 ($ million)
- Chart on Germany - Year-over-year growth 2023-2028 (%)
- Data Table on Germany - Year-over-year growth 2023-2028 (%)
- 9.10 France - Market size and forecast 2023-2028
- Chart on France - Market size and forecast 2023-2028 ($ million)
- Data Table on France - Market size and forecast 2023-2028 ($ million)
- Chart on France - Year-over-year growth 2023-2028 (%)
- Data Table on France - Year-over-year growth 2023-2028 (%)
- 9.11 Japan - Market size and forecast 2023-2028
- Chart on Japan - Market size and forecast 2023-2028 ($ million)
- Data Table on Japan - Market size and forecast 2023-2028 ($ million)
- Chart on Japan - Year-over-year growth 2023-2028 (%)
- Data Table on Japan - Year-over-year growth 2023-2028 (%)
- 9.12 Market opportunity by geography
- Market opportunity By Geographical Landscape($ million)
- Data Tables on Market opportunity By Geographical Landscape($ million)
10 Drivers, Challenges, and Opportunity/Restraints
- 10.1 Market drivers
- 10.2 Market challenges
- 10.3 Impact of drivers and challenges
- Impact of drivers and challenges in 2023 and 2028
- 10.4 Market opportunities/restraints
11 Competitive Landscape
- 11.1 Overview
- 11.2 Competitive Landscape
- Overview on criticality of inputs and factors of differentiation
- 11.3 Landscape disruption
- Overview on factors of disruption
- 11.4 Industry risks
- Impact of key risks on business
12 Competitive Analysis
- 12.1 Companies profiled
- Companies covered
- 12.2 Market positioning of companies
- Matrix on companies position and classification
- 12.3 Acthera Therapeutics AG
- Acthera Therapeutics AG - Overview
- Acthera Therapeutics AG - Product / Service
- Acthera Therapeutics AG - Key offerings
- 12.4 Bausch Lomb Corp.
- Bausch Lomb Corp. - Overview
- Bausch Lomb Corp. - Business segments
- Bausch Lomb Corp. - Key offerings
- Bausch Lomb Corp. - Segment focus
- 12.5 Baxter International Inc.
- Baxter International Inc. - Overview
- Baxter International Inc. - Business segments
- Baxter International Inc. - Key news
- Baxter International Inc. - Key offerings
- Baxter International Inc. - Segment focus
- 12.6 Galen Ltd.
- Galen Ltd. - Overview
- Galen Ltd. - Product / Service
- Galen Ltd. - Key offerings
- 12.7 Gilead Sciences Inc.
- Gilead Sciences Inc. - Overview
- Gilead Sciences Inc. - Product / Service
- Gilead Sciences Inc. - Key news
- Gilead Sciences Inc. - Key offerings
- 12.8 Innocan Pharma Corp. Ltd.
- Innocan Pharma Corp. Ltd. - Overview
- Innocan Pharma Corp. Ltd. - Product / Service
- Innocan Pharma Corp. Ltd. - Key offerings
- 12.9 Johnson and Johnson Services Inc.
- Johnson and Johnson Services Inc. - Overview
- Johnson and Johnson Services Inc. - Business segments
- Johnson and Johnson Services Inc. - Key news
- Johnson and Johnson Services Inc. - Key offerings
- Johnson and Johnson Services Inc. - Segment focus
- 12.10 Leadiant Biosciences Inc.
- Leadiant Biosciences Inc. - Overview
- Leadiant Biosciences Inc. - Product / Service
- Leadiant Biosciences Inc. - Key offerings
- 12.11 Liposoma B.V.
- Liposoma B.V. - Overview
- Liposoma B.V. - Product / Service
- Liposoma B.V. - Key offerings
- 12.12 Merrimack Pharmaceuticals Inc.
- Merrimack Pharmaceuticals Inc. - Overview
- Merrimack Pharmaceuticals Inc. - Product / Service
- Merrimack Pharmaceuticals Inc. - Key offerings
- 12.13 Pacira BioSciences Inc.
- Pacira BioSciences Inc. - Overview
- Pacira BioSciences Inc. - Business segments
- Pacira BioSciences Inc. - Key offerings
- Pacira BioSciences Inc. - Segment focus
- 12.14 Spectrum Pharmaceuticals Inc.
- Spectrum Pharmaceuticals Inc. - Overview
- Spectrum Pharmaceuticals Inc. - Product / Service
- Spectrum Pharmaceuticals Inc. - Key offerings
- 12.15 Takeda Pharmaceutical Co. Ltd.
- Takeda Pharmaceutical Co. Ltd. - Overview
- Takeda Pharmaceutical Co. Ltd. - Product / Service
- Takeda Pharmaceutical Co. Ltd. - Key news
- Takeda Pharmaceutical Co. Ltd. - Key offerings
- 12.16 The Lubrizol Corp.
- The Lubrizol Corp. - Overview
- The Lubrizol Corp. - Product / Service
- The Lubrizol Corp. - Key offerings
- 12.17 Viatris Inc.
- Viatris Inc. - Overview
- Viatris Inc. - Business segments
- Viatris Inc. - Key news
- Viatris Inc. - Key offerings
- Viatris Inc. - Segment focus
13 Appendix
- 13.1 Scope of the report
- 13.2 Inclusions and exclusions checklist
- Inclusions checklist
- Exclusions checklist
- 13.3 Currency conversion rates for US$
- Currency conversion rates for US$
- 13.4 Research methodology
- Research methodology
- 13.5 Data procurement
- Information sources
- 13.6 Data validation
- Data validation
- 13.7 Validation techniques employed for market sizing
- Validation techniques employed for market sizing
- 13.8 Data synthesis
- Data synthesis
- 13.9 360 degree market analysis
- 360 degree market analysis
- 13.10 List of abbreviations
- List of abbreviations