|
시장보고서
상품코드
2041526
메탄올 선박 시장 : 엔진 출력별, 선종별(화물선, 여객선, 오프쇼어선, 조사 및 연구선, 예인선), 시스템별(추진, 연료, 공기 및 환기, 냉각, 전기, 안전), 건조별, 지역별 - 세계 예측(-2035년)Methanol Ships Market By Engine Output, Ship Type (Cargo, Passenger, Offshore, Research & Survey Vessels, Tugboats), System (Propulsion, Fuel, Air & Ventilation, Cooling, Electrical, Safety), Build and Region - Global Forecast to 2035 |
||||||
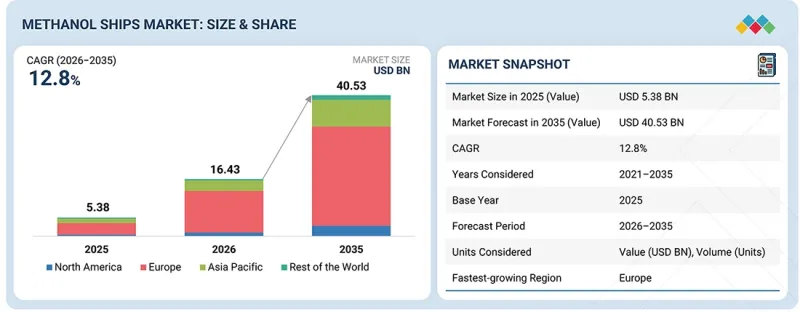
메탄올 선박 시장 규모는 2026년 164억 3,000만 달러에서 예측 기간 동안 CAGR 12.8%로 확대되어 2035년에는 405억 3,000만 달러에 달할 것으로 예측됩니다.
| 조사 범위 | |
|---|---|
| 조사 대상 기간 | 2021-2035년 |
| 기준 연도 | 2025년 |
| 예측 기간 | 2026-2035년 |
| 단위 | 금액(달러) |
| 부문 | 출력, 선종, 시스템, 지역별 |
| 대상 지역 | 북미, 유럽, 아시아태평양, 라틴아메리카, 중동 및 아프리카 |
해운업계의 배출량 감소와 저탄소 연료로의 전환 필요성이 이 시장의 성장을 주도하고 있습니다. 이러한 전환은 장기적인 탈탄소화 목표를 달성하는 데 중요합니다. 시장 성장은 특히 컨테이너선, 탱커, 벌크선을 중심으로 메탄올 연료 선박의 발주량이 증가하면서 시장 성장을 뒷받침하고 있습니다. 동시에 IMO의 목표와 지역별 규제에 따라 선주들에게 청정연료 채택에 대한 압력이 증가하고 있습니다. 또한, 메탄올 벙커링 인프라 확충과 그린메탄올 공급성 향상으로 대규모 도입이 용이해지고 있습니다.

"조선 부문별로는 신조선 부문이 예측 기간 동안 가장 큰 비중을 차지할 것으로 예상됩니다."
예측 기간 동안 신조선 부문은 계속해서 선도적인 위치를 유지할 것으로 예상됩니다. 그 주요 이유는 대규모 메탄올 도입의 대부분이 기존 선박의 개조가 아닌 신규 선박 수주를 통해 이루어지고 있기 때문입니다. 또한, 선주들은 설계 단계부터 메탄올 시스템을 통합할 수 있도록 신조 선박을 선택하고 있습니다. 이를 통해 공간의 효율적 활용, 안전 기준 준수 용이성, 장기적으로 보다 효율적인 운항이 가능해집니다. 이는 이미 선대 갱신이 진행되고 있는 컨테이너선, 유조선 등의 부문에서 더욱 뚜렷하게 나타나고 있습니다.
"시스템별로는 연료 시스템 부문이 2026년부터 2035년까지 가장 높은 CAGR로 성장할 것으로 전망"
연료 시스템 부문은 향후 몇 년 동안 가장 높은 성장률을 보일 것으로 예상됩니다. 메탄올은 선상에서 전용 저장, 취급 및 공급 시스템이 필요하기 때문입니다. 기존 연료와 달리 전용 탱크, 배관, 추가 안전장치가 필요하기 때문에 척당 시스템 가치 비율이 높아집니다. 신조 및 개조 프로젝트가 증가함에 따라 다양한 선종에 걸쳐 이러한 시스템에 대한 수요도 증가하고 있습니다.
"지역별로는 유럽이 예측 기간 동안 가장 큰 시장 점유율을 차지할 것으로 전망"
유럽은 2035년까지 강력한 규제 추진과 주요 해운사들의 선단 단위의 조기 도입으로 인해 메탄올 선박 시장에서 가장 큰 점유율을 차지할 것으로 예상됩니다. 이 지역에는 이미 메탄올 선박에 투자하고 있는 운항사들이 많이 집중되어 있습니다. 또한, 유럽 각지의 항만에서 메탄올 벙커링 시설의 정비가 빠르게 진행되고 있으며, 이 또한 메탄올 선박의 대규모 도입을 촉진하고 있습니다.
세계의 메탄올 선박 시장을 조사했으며, 시장 개요, 시장 성장에 영향을 미치는 각종 영향요인 분석, 기술·특허 동향, 법·규제 환경, 사례 분석, 시장 규모 추정 및 예측, 각종 부문별·지역별·주요 국가별 상세 분석, 경쟁 구도, 주요 기업 개요 등의 정보를 정리하여 전해드립니다.
자주 묻는 질문
목차
제1장 소개
제2장 주요 요약
제3장 주요 인사이트
제4장 시장 개요
제5장 업계 동향
제6장 기술의 진보, AI의 영향, 특허, 혁신, 향후 응용
제7장 고객 상황과 구매 행동
제8장 지속가능성과 규제 상황
제9장 메탄올 벙커링 환경
제10장 메탄올 선박 시장 : 선종별
제11장 메탄올 선박 시장 : 시스템별
제12장 메탄올 선박 시장 : 건조별
제13장 메탄올 선박 시장 : 엔진 출력별
제14장 메탄올 선박 시장 : 지역별
제15장 경쟁 구도
제16장 기업 개요
제17장 조사 방법
제18장 부록
KSM 26.06.04The methanol ships market is projected to grow from USD 16.43 billion in 2026 and reach USD 40.53 billion by 2035 at a CAGR of 12.8% during the forecast period.
| Scope of the Report | |
|---|---|
| Years Considered for the Study | 2021-2035 |
| Base Year | 2025 |
| Forecast Period | 2026-2035 |
| Units Considered | Value (USD Billion) |
| Segments | By Output, Ship Type, System and Region |
| Regions covered | North America, Europe, Asia Pacific, Latin America, and the Middle East & Africa |
The market is being driven by the need to cut emissions and move toward low-carbon fuels in the shipping industry. This shift is important for meeting long-term decarbonization goals. Growth is supported by the rising number of methanol-fueled vessel orders, especially across container ships, tankers, and bulk carriers. At the same time, regulatory pressure is increasing, with IMO targets and regional rules pushing shipowners to adopt cleaner fuel options. Also, the expansion of methanol bunkering infrastructure and better availability of green methanol are making it easier for large-scale use.
"By build, the newbuild segment is projected to be the most dominant during the forecast period."
Newbuild is expected to remain the leading segment during the forecast period, mainly because most of the large-scale methanol adoption is happening through new vessel orders, rather than conversions. Additionally, shipowners are going for newbuilds so they can include methanol systems right from the design stage. This helps in better space use, easier safety compliance, and more efficient operations in the long run. It is more clearly seen in segments like container ships and tankers, where fleet renewal is already ongoing.
"By system, the fuel system segment is likely to grow at the highest CAGR from 2026 to 2035."
The fuel system segment is expected to grow at the highest rate over the coming years because methanol needs dedicated storage, handling and distribution systems onboard. Unlike conventional fuels, it requires specialized tanks, piping, and added safety mechanisms, which increases its value share in each vessel. As both newbuild and retrofit projects are growing, the demand for these systems is also increasing across different ship types.
"Europe is expected to account for the largest market share during the forecast period."
Europe is expected to account for the largest share of the methanol ships market through 2035, mainly because of a strong regulatory push and early adoption at the fleet level by major shipping companies. The region has a high concentration of operators already investing in methanol vessels. Additionally, ports across Europe are moving faster in building methanol bunkering capabilities, which is also helping the large-scale deployment of methanol ships.
The breakdown of profiles for primary participants in the methanol ships market is provided below:
- By Company Type: Tier 1 - 30%, Tier 2 - 45%, and Tier 3 - 25%
- By Designation: Directors - 20%, Managers - 10%, and Others - 70%
- By Region: Asia - 40%, Europe - 30%, North America - 20%, RoW - 10%
Research Coverage:
This market study covers the methanol ships market across various segments and subsegments. It aims to estimate the size and growth potential of this market across different parts and regions. This study also includes an in-depth competitive analysis of the key players in the market, their company profiles, key observations related to their products and business offerings, recent developments, and key market strategies they adopted.
Reasons to buy this report:
The report will help the market leaders/new entrants with information on the closest approximations of the revenue numbers for the overall methanol ships market. It will also help stakeholders understand the competitive landscape and gain more insights to position their businesses better and plan suitable go-to-market strategies. The report will also help stakeholders understand the market pulse and will provide information on key market drivers, restraints, challenges, and opportunities.
The report provides insights into the following pointers:
- Market Drivers (Stringent emission regulations accelerating shift toward methanol-fueled ships, growing investments in cleaner and future-ready shipping fleets), restraints (High upfront cost compared to conventional vessels, limited supply and high cost of green methanol fuel), opportunities (Strong potential to retrofit existing ships, expanding adoption across multiple vessel types), challenges (Handling and safety requirements for methanol fuel, limited bunkering infrastructure across ports)
- Market Penetration: Comprehensive information on methanol ships offered by top players in the market
- Product Development/Innovation: Detailed insights into upcoming technologies, research & development activities, and product launches in the methanol ships market
- Market Development: Comprehensive information about lucrative markets across varied regions
- Market Diversification: Exhaustive information about products, untapped geographies, recent developments, and investments in the methanol ships market
- Competitive Assessment: In-depth assessment of market share, growth strategies, products, and manufacturing capabilities of leading players in the methanol ships market
TABLE OF CONTENTS
1 INTRODUCTION
- 1.1 STUDY OBJECTIVES
- 1.2 MARKET DEFINITION
- 1.3 STUDY SCOPE
- 1.3.1 MARKETS COVERED
- 1.3.2 INCLUSIONS AND EXCLUSIONS
- 1.3.3 YEARS CONSIDERED
- 1.4 CURRENCY CONSIDERED
- 1.5 STAKEHOLDERS
2 EXECUTIVE SUMMARY
- 2.1 KEY INSIGHTS AND MARKET HIGHLIGHTS
- 2.2 KEY MARKET PARTICIPANTS: MAPPING OF STRATEGIC DEVELOPMENTS
- 2.3 DISRUPTIVE TRENDS IN METHANOL SHIPS MARKET
- 2.4 HIGH-GROWTH SEGMENTS
- 2.5 REGIONAL SNAPSHOT: MARKET SIZE, GROWTH RATE, AND FORECAST
3 PREMIUM INSIGHTS
- 3.1 ATTRACTIVE OPPORTUNITIES FOR PLAYERS IN METHANOL SHIPS MARKET
- 3.2 METHANOL SHIPS MARKET, BY BUILD
- 3.3 METHANOL SHIPS MARKET, BY SHIP TYPE
- 3.4 METHANOL SHIPS MARKET, BY ENGINE OUTPUT
- 3.5 METHANOL SHIPS MARKET, BY SYSTEM
4 MARKET OVERVIEW
- 4.1 INTRODUCTION
- 4.2 MARKET DYNAMICS
- 4.2.1 DRIVERS
- 4.2.1.1 Increasing focus on maritime decarbonization and adoption of low-emission fuels
- 4.2.1.2 Increasing availability of methanol and expansion of fuel supply infrastructure
- 4.2.1.3 Lower operational complexity and safer handling of methanol fuel driving adoption in shipping
- 4.2.2 RESTRAINTS
- 4.2.2.1 High cost of methanol and limited price competitiveness
- 4.2.2.2 Limited global bunkering infrastructure and uneven distribution
- 4.2.3 OPPORTUNITIES
- 4.2.3.1 Increasing policy support, subsidies, and carbon pricing mechanisms for green fuels
- 4.2.3.2 Growing demand for low-emission shipping from cargo owners and end customers
- 4.2.3.3 Development of green shipping corridors and trade route decarbonization initiatives
- 4.2.4 CHALLENGES
- 4.2.4.1 Lack of standardization in regulations, certification, and fuel quality specifications
- 4.2.4.2 Uncertainty in long-term fuel supply chain coordination and scalability
- 4.2.1 DRIVERS
- 4.3 UNMET NEEDS AND WHITE SPACES
- 4.4 INTERCONNECTED MARKETS AND CROSS-SECTOR OPPORTUNITIES
- 4.4.1 CONVERGENCE WITH MARINE FUEL SUPPLY, PORT INFRASTRUCTURE, AND AFTERMARKET SERVICES
- 4.4.2 INTEGRATION WITH SHIPPING DECARBONIZATION STRATEGIES AND CARBON MANAGEMENT SYSTEMS
- 4.4.3 CONVERGENCE WITH PORT OPERATIONS AND GLOBAL TRADE ROUTE MANAGEMENT
- 4.5 STRATEGIC MOVES BY TIER 1/2/3 PLAYERS
5 INDUSTRY TRENDS
- 5.1 ECOSYSTEM ANALYSIS
- 5.2 SHIP MANUFACTURERS
- 5.3 METHANOL FUEL SUPPLIERS
- 5.4 END USERS
- 5.5 VALUE CHAIN ANALYSIS
- 5.5.1 CONCEPT & RESEARCH
- 5.5.2 COMPONENT & MATERIAL DEVELOPMENT
- 5.5.3 SHIPBUILDING & INTEGRATION
- 5.5.4 SYSTEM INTEGRATION & VALIDATION
- 5.5.5 POST-DEPLOYMENT SERVICE
- 5.6 PRICING ANALYSIS
- 5.6.1 AVERAGE SELLING PRICE TREND, BY REGION
- 5.6.1.1 Average selling price of newbuild, by region
- 5.6.1.2 Average selling price of retrofit, by region
- 5.6.2 AVERAGE SELLING PRICE TREND OF METHANOL SHIPS, BY BUILD
- 5.6.1 AVERAGE SELLING PRICE TREND, BY REGION
- 5.7 TRADE ANALYSIS
- 5.7.1 IMPORT SCENARIO (HS CODE 8901)
- 5.7.2 EXPORT SCENARIO (HS CODE 8901)
- 5.8 CASE STUDY ANALYSIS
- 5.8.1 RETROFITTING OF MV EEMSBORG FOR METHANOL PROPULSION
- 5.8.2 MAERSK METHANOL-POWERED CONTAINER SHIPS
- 5.8.3 STENA BULK METHANOL CONVERSION PROJECT
- 5.9 KEY CONFERENCES & EVENTS, 2026-2027
- 5.10 INVESTMENT & FUNDING SCENARIO
- 5.11 TRENDS/DISRUPTIONS IMPACTING CUSTOMER BUSINESS
- 5.12 OPERATIONAL DATA
- 5.13 TOTAL COST OF OWNERSHIP (TCO)
- 5.14 MACROECONOMIC OUTLOOK
- 5.14.1 INTRODUCTION
- 5.14.2 GDP TRENDS AND FORECAST
- 5.14.3 TRENDS IN GLOBAL METHANOL INDUSTRY
- 5.14.4 TRENDS IN GLOBAL MARINE INDUSTRY
- 5.15 VOLUME DATA
- 5.16 BILL OF MATERIALS
- 5.17 BUSINESS MODELS
- 5.17.1 NEWBUILD VESSEL SALES MODEL
- 5.17.2 DUAL-FUEL PROPULSION AND EQUIPMENT SUPPLY MODEL
- 5.17.3 LONG-TERM GREEN METHANOL OFFTAKE MODEL
- 5.17.4 FUEL PRODUCTION AND MARINE FUEL TRADING MODEL
- 5.17.5 BUNKERING-AS-A-SERVICE MODEL
- 5.17.6 LIFECYCLE SERVICE AND AFTERMARKET SUPPORT MODEL
6 TECHNOLOGICAL ADVANCEMENTS, AI-DRIVEN IMPACT, PATENTS, INNOVATIONS, AND FUTURE APPLICATIONS
- 6.1 KEY TECHNOLOGIES
- 6.1.1 DUAL-FUEL PROPULSION SYSTEMS
- 6.1.1.1 Use case: A.P. Moller - Maersk deployed dual-fuel methanol propulsion systems
- 6.1.1.2 Use case: Hapag-Lloyd adopted dual-fuel methanol engine integration
- 6.1.2 METHANOL FUEL INJECTION AND COMBUSTION SYSTEMS
- 6.1.2.1 Use case: CMA CGM integrated methanol fuel injection and combustion systems
- 6.1.2.2 Use case: COSCO Shipping deployed methanol fuel injection and combustion systems
- 6.1.3 RETROFIT & CONVERSION TECHNOLOGIES
- 6.1.1 DUAL-FUEL PROPULSION SYSTEMS
- 6.2 COMPLEMENTARY TECHNOLOGIES
- 6.2.1 METHANOL PRODUCTION TECHNOLOGIES
- 6.2.2 DIGITAL MONITORING & PREDICTIVE MAINTENANCE SYSTEMS
- 6.2.3 ALTERNATIVE GREEN FUEL COMPATIBILITY TECHNOLOGIES
- 6.2.4 CARBON CAPTURE AND EMISSION MANAGEMENT SYSTEMS
- 6.3 TECHNOLOGY ROADMAP
- 6.4 PATENT ANALYSIS
- 6.5 FUTURE APPLICATIONS
- 6.6 IMPACT OF AI/GENERATIVE AI
- 6.6.1 IMPLEMENTATION OF AI IN METHANOL SHIPS MARKET: TOP USE CASES AND MARKET POTENTIAL
- 6.6.2 IMPLEMENTATION OF AI IN METHANOL SHIPS MARKET: CASE STUDIES
- 6.6.3 INTERCONNECTED ECOSYSTEM AND IMPACT ON MARKET PLAYERS
- 6.6.4 CLIENTS' READINESS TO ADOPT AI/GENERATIVE AI
7 CUSTOMER LANDSCAPE & BUYER BEHAVIOR
- 7.1 DECISION-MAKING PROCESS
- 7.2 BUYER STAKEHOLDERS AND BUYING EVALUATION CRITERIA
- 7.2.1 BUYING EVALUATION CRITERIA
- 7.2.2 BUYING CRITERIA
- 7.3 ADOPTION BARRIERS & INTERNAL CHALLENGES
- 7.4 UNMET NEEDS OF VARIOUS END-USE INDUSTRIES
8 SUSTAINABILITY AND REGULATORY LANDSCAPE
- 8.1 REGIONAL REGULATIONS AND COMPLIANCE
- 8.1.1 REGULATORY BODIES, GOVERNMENT AGENCIES, AND OTHER ORGANIZATIONS
- 8.1.2 KEY REGULATIONS
- 8.1.3 INDUSTRY STANDARDS
- 8.2 SUSTAINABILITY INITIATIVES
- 8.2.1 CARBON IMPACT REDUCTION
- 8.2.2 ECO-APPLICATIONS
- 8.3 CERTIFICATIONS, LABELING, AND ECO-STANDARDS
9 METHANOL BUNKERING LANDSCAPE
- 9.1 INTRODUCTION
- 9.2 ROLE OF BUNKERING IN METHANOL SHIP ADOPTION
- 9.3 METHANOL BUNKERING ECOSYSTEM
- 9.3.1 METHANOL PRODUCERS
- 9.3.2 FUEL SUPPLIERS
- 9.3.3 TRANSPORT, STORAGE, AND LOGISTICS PROVIDERS
- 9.3.4 SERVICE PROVIDERS
- 9.3.5 SHIPOWNERS AND VESSEL OPERATORS
- 9.4 CURRENT STATE OF METHANOL BUNKERING
- 9.4.1 ACTIVE PORTS
- 9.4.2 PORTS UNDER DEVELOPMENT
- 9.5 BUNKERING INFRASTRUCTURE AND DELIVERY MODELS
- 9.5.1 TRUCK-TO-SHIP
- 9.5.2 SHIP-TO-SHIP
- 9.5.3 TERMINAL-TO-SHIP
- 9.6 SAFETY STANDARDS AND OPERATIONAL REQUIREMENTS
- 9.6.1 REGULATORY AND CLASS FRAMEWORK
- 9.6.2 BUNKERING PROCEDURES AND OPERATING CONTROLS
- 9.7 KEY CHALLENGES AND GAPS IN METHANOL BUNKERING
- 9.7.1 LIMITED AVAILABILITY OF LOW-CARBON METHANOL
- 9.7.2 LIMITED NUMBER OF METHANOL-READY BUNKERING PORTS
- 9.7.3 LACK OF SCALABLE HIGH-VOLUME DELIVERY INFRASTRUCTURE
- 9.7.4 HIGHER FUEL STORAGE REQUIREMENT
- 9.7.5 LACK OF STANDARDIZED PORT PROCEDURES
- 9.7.6 TRAINING AND EQUIPMENT READINESS GAP
10 METHANOL SHIPS MARKET, BY SHIP TYPE (MARKET SIZE & FORECAST TO 2035 (USD MILLION/UNITS))
- 10.1 INTRODUCTION
- 10.2 CARGO VESSELS
- 10.2.1 CONTAINER SHIPS
- 10.2.1.1 Fixed liner routes and high-fuel-use container fleets to drive growth
- 10.2.2 BULK CARRIERS
- 10.2.2.1 Long-haul dry-bulk fleet renewal and future fuel compliance to drive growth
- 10.2.3 RO-RO CARGO SHIPS
- 10.2.3.1 Scheduled Ro-Ro routes and port-linked emission reduction needs to drive growth
- 10.2.4 CAR CARRIERS
- 10.2.4.1 Vehicle export demand and car-carrier fleet renewal to drive growth
- 10.2.5 CHEMICAL TANKERS
- 10.2.5.1 Long vessel lives and tighter emissions rules to drive growth
- 10.2.6 CRUDE OIL TANKERS
- 10.2.6.1 Crude tanker fleet replacement and long-term emissions compliance to drive growth
- 10.2.1 CONTAINER SHIPS
- 10.3 PASSENGER VESSELS
- 10.3.1 CRUISE SHIPS
- 10.3.1.1 High energy demand from propulsion and onboard hotel loads to drive market
- 10.3.2 ROPAX VESSELS
- 10.3.2.1 Combine passenger movement with rolling freight
- 10.3.1 CRUISE SHIPS
- 10.4 OFFSHORE VESSELS
- 10.4.1 OFFSHORE SUPPLY SHIPS
- 10.4.1.1 Repeated shore-to-field logistics and offshore fleet renewal to drive growth
- 10.4.2 OFFSHORE SUPPORT VESSELS
- 10.4.2.1 Offshore wind operations and long-term service demand to drive growth
- 10.4.1 OFFSHORE SUPPLY SHIPS
- 10.5 TUGBOATS
- 10.5.1 PORT EMISSION RULES, FIXED OPERATING BASES, AND REPLACEMENT OF OLDER DIESEL TUG FLEETS TO DRIVE GROWTH
- 10.6 RESEARCH & SURVEY VESSELS
- 10.6.1 NEED FOR CLEANER VESSELS IN SENSITIVE MARINE ENVIRONMENTS TO DRIVE GROWTH
11 METHANOL SHIPS MARKET, BY SYSTEM (MARKET SIZE & FORECAST TO 2035 (USD MILLION/UNITS))
- 11.1 INTRODUCTION
- 11.2 PROPULSION SYSTEM
- 11.2.1 MAIN PROPULSION
- 11.2.1.1 Integrated propulsion design and fuel-changeover capability to drive growth
- 11.2.2 AUXILIARY POWER
- 11.2.2.1 Reliable onboard power for vessel, port, and offshore operations to drive growth
- 11.2.1 MAIN PROPULSION
- 11.3 FUEL SYSTEM
- 11.3.1 FUEL STORAGE, CONTAINMENT, AND VENTING
- 11.3.1.1 Safe tank integration and vapor management to drive growth
- 11.3.2 FUEL SUPPLY AND DISTRIBUTION
- 11.3.2.1 Demand for protected fuel transfer and reliable distribution systems to drive growth
- 11.3.3 FUEL INJECTION AND VALVE TRAIN
- 11.3.3.1 Need for controlled fuel delivery and safe mode switching to drive growth
- 11.3.1 FUEL STORAGE, CONTAINMENT, AND VENTING
- 11.4 AIR, EXHAUST, AND VENTILATION SYSTEMS
- 11.4.1 NEED TO PROTECT CREW, MACHINERY SPACES, AND CARGO OPERATIONS TO DRIVE GROWTH
- 11.5 COOLING AND LUBRICATION SYSTEMS
- 11.5.1 NEED FOR STABLE TEMPERATURE CONTROL TO DRIVE GROWTH
- 11.6 ELECTRICAL AND CONTROL SYSTEMS
- 11.6.1 ELECTRICAL INSTALLATIONS
- 11.6.1.1 Safe power networks and hazardous-area design to drive growth
- 11.6.2 CONTROL AND AUTOMATION
- 11.6.2.1 Coordinated fuel control and emergency response systems to drive growth
- 11.6.3 MONITORING AND DIAGNOSTICS
- 11.6.3.1 Need for early fault detection and system visibility to drive growth
- 11.6.1 ELECTRICAL INSTALLATIONS
- 11.7 SAFETY SYSTEMS
- 11.7.1 LEAK AND VAPOR DETECTION
- 11.7.1.1 Need for early fuel-risk detection and alarm integration to drive growth
- 11.7.2 EMERGENCY SHUTDOWN AND FIRE PROTECTION
- 11.7.2.1 Need for fast fuel isolation and fire-response systems to drive growth
- 11.7.1 LEAK AND VAPOR DETECTION
12 METHANOL SHIPS MARKET, BY BUILD (MARKET SIZE & FORECAST TO 2035 (USD MILLION/UNITS))
- 12.1 INTRODUCTION
- 12.2 NEWBUILD
- 12.2.1 LARGE FLEET RENEWAL PROGRAMS TO DRIVE DEMAND
- 12.3 RETROFIT
- 12.3.1 ABILITY TO PROVIDE OPTION OF EXTENDING WORKING LIFE OF EXISTING SHIPS WHILE ADDING METHANOL FUEL CAPABILITY TO DRIVE DEMAND
13 METHANOL SHIPS MARKET, BY ENGINE OUTPUT (MARKET SIZE & FORECAST TO 2035 (USD MILLION/UNITS))
- 13.1 INTRODUCTION
- 13.2 LOW-OUTPUT (<= 5 MW)
- 13.2.1 STRICTER EMISSION CONTROLS TO DRIVE GROWTH
- 13.3 MEDIUM-OUTPUT (5-20 MW)
- 13.3.1 ABILITY TO INTEGRATE METHANOL SYSTEMS INTO EXISTING VESSEL DESIGNS TO DRIVE GROWTH
- 13.4 HIGH-OUTPUT (>= 20 MW)
- 13.4.1 NEED TO ALIGN NEW VESSELS WITH FUTURE FUEL REQUIREMENTS TO DRIVE GROWTH
14 METHANOL SHIPS MARKET, BY REGION (MARKET SIZE & FORECAST TO 2035 (USD MILLION/UNITS))
- 14.1 INTRODUCTION
- 14.2 NORTH AMERICA
- 14.2.1 CANADA
- 14.2.1.1 Port-level decarbonization initiatives and fleet transition strategies to drive market
- 14.2.1 CANADA
- 14.3 EUROPE
- 14.3.1 DENMARK
- 14.3.1.1 Alignment with European Union emission targets to drive market
- 14.3.2 FRANCE
- 14.3.2.1 Strong national decarbonization policies and diversified maritime operations to drive market
- 14.3.3 SWEDEN
- 14.3.3.1 Focus on innovation and clean technology development to drive market
- 14.3.4 GERMANY
- 14.3.4.1 Push toward cleaner propulsion to drive market
- 14.3.5 SWITZERLAND
- 14.3.5.1 Need to reduce greenhouse gas emissions while maintaining operational efficiency to drive market
- 14.3.6 NETHERLANDS
- 14.3.6.1 Well-developed energy and maritime ecosystem to drive market
- 14.3.7 NORWAY
- 14.3.7.1 Need to reduce carbon emissions in both domestic and international maritime activities to drive market
- 14.3.1 DENMARK
- 14.4 ASIA
- 14.4.1 CHINA
- 14.4.1.1 Large-scale shipbuilding capacity and strong government-led decarbonization initiatives to drive market
- 14.4.2 JAPAN
- 14.4.2.1 Strong regulatory alignment and advanced maritime technology to drive market
- 14.4.3 SOUTH KOREA
- 14.4.3.1 Global shipbuilding leadership and highly integrated maritime ecosystem to drive market
- 14.4.4 INDIA
- 14.4.4.1 Government-led green shipping initiatives and expanding maritime infrastructure to drive market
- 14.4.5 SINGAPORE
- 14.4.5.1 Strategic bunkering hub and strong regulatory support to drive market
- 14.4.6 TAIWAN
- 14.4.6.1 Strong export-driven shipping demand and industrial transition toward clean fuels to drive market
- 14.4.1 CHINA
- 14.5 REST OF THE WORLD
- 14.5.1 MIDDLE EAST
- 14.5.1.1 UAE
- 14.5.1.1.1 Strategic bunkering hub development and clean fuel investments to drive market
- 14.5.1.1 UAE
- 14.5.2 LATIN AMERICA
- 14.5.2.1 Brazil
- 14.5.2.1.1 Expanding maritime trade and emerging clean fuel initiatives to drive market
- 14.5.2.1 Brazil
- 14.5.1 MIDDLE EAST
15 COMPETITIVE LANDSCAPE
- 15.1 INTRODUCTION
- 15.2 KEY PLAYER STRATEGIES/RIGHT TO WIN, 2022-2025
- 15.3 REVENUE ANALYSIS, 2021-2025
- 15.4 MARKET SHARE ANALYSIS, 2025
- 15.5 BRAND/PRODUCT COMPARISON
- 15.5.1 COMPANY VALUATION AND FINANCIAL METRICS
- 15.6 COMPANY EVALUATION MATRIX: KEY PLAYERS, 2025
- 15.6.1 STARS
- 15.6.2 EMERGING LEADERS
- 15.6.3 PERVASIVE PLAYERS
- 15.6.4 PARTICIPANTS
- 15.6.4.1 company footprint
- 15.6.4.2 Company footprint
- 15.6.4.3 Region footprint
- 15.6.4.4 Engine output footprint
- 15.6.4.5 Ship type footprint
- 15.6.4.6 Build footprint
- 15.7 COMPANY EVALUATION MATRIX: STARTUPS/SMES, 2025
- 15.7.1 PROGRESSIVE COMPANIES
- 15.7.2 RESPONSIVE COMPANIES
- 15.7.3 DYNAMIC COMPANIES
- 15.7.4 STARTING BLOCKS
- 15.7.5 COMPETITIVE BENCHMARKING
- 15.7.5.1 List of startups/SMEs
- 15.7.5.2 Competitive benchmarking of startups/SMEs
- 15.8 COMPETITIVE SCENARIO
- 15.8.1 PRODUCT LAUNCHES
- 15.8.2 DEALS
- 15.8.3 OTHER DEVELOPMENTS
16 COMPANY PROFILES
- 16.1 KEY PLAYERS
- 16.1.1 HD HYUNDAI HEAVY INDUSTRIES
- 16.1.1.1 Business overview
- 16.1.1.2 Products offered
- 16.1.1.3 Recent developments
- 16.1.1.3.1 Other developments
- 16.1.1.4 MnM view
- 16.1.1.4.1 Right to win
- 16.1.1.4.2 Strategic choices
- 16.1.1.4.3 Weaknesses and competitive threats
- 16.1.2 SAMSUNG HEAVY INDUSTRIES CO., LTD.
- 16.1.2.1 Business overview
- 16.1.2.2 Products offered
- 16.1.2.3 Recent developments
- 16.1.2.3.1 Other developments
- 16.1.2.4 MnM view
- 16.1.2.4.1 Right to win
- 16.1.2.4.2 Strategic choices
- 16.1.2.4.3 Weaknesses and competitive threats
- 16.1.3 CHINA STATE SHIPBUILDING CORPORATION LIMITED:
- 16.1.3.1 Business overview
- 16.1.3.2 Products offered
- 16.1.3.3 Recent developments
- 16.1.3.3.1 Product launches
- 16.1.3.3.2 Other developments
- 16.1.3.4 MnM view
- 16.1.3.4.1 Right to win
- 16.1.3.4.2 Strategic choices
- 16.1.3.4.3 Weaknesses and competitive threats
- 16.1.4 COSCO SHIPPING HEAVY INDUSTRY CO., LTD.
- 16.1.4.1 Business overview
- 16.1.4.2 Products offered
- 16.1.4.3 Recent developments
- 16.1.4.3.1 Product developments/launches
- 16.1.4.3.2 Deals
- 16.1.4.3.3 Other developments
- 16.1.4.4 MnM view
- 16.1.4.4.1 Right to win
- 16.1.4.4.2 Strategic choices
- 16.1.4.4.3 Weaknesses and competitive threats
- 16.1.5 YANGZIJIANG SHIPBUILDING (HOLDINGS) LTD.
- 16.1.5.1 Business overview
- 16.1.5.2 Products offered
- 16.1.5.3 Recent developments
- 16.1.5.3.1 Other developments
- 16.1.5.4 MnM view
- 16.1.5.4.1 Right to win
- 16.1.5.4.2 Strategic choices
- 16.1.5.4.3 Weaknesses and competitive threats
- 16.1.6 TSUNEISHI SHIPBUILDING CO., LTD.
- 16.1.6.1 Business overview
- 16.1.6.2 Products offered
- 16.1.6.3 Recent developments
- 16.1.6.3.1 Product developments/launches
- 16.1.6.3.2 Deals
- 16.1.6.3.3 Other developments
- 16.1.7 CHINA INTERNATIONAL MARINE CONTAINERS (GROUP) CO., LTD.
- 16.1.7.1 Business overview
- 16.1.7.2 Products offered
- 16.1.7.3 Recent developments
- 16.1.7.3.1 Product developments/launches
- 16.1.7.3.2 Other developments
- 16.1.8 MITSUBISHI HEAVY INDUSTRIES, LTD.
- 16.1.8.1 Business overview
- 16.1.8.2 Products offered
- 16.1.8.3 Recent developments
- 16.1.8.3.1 Deals
- 16.1.8.3.2 Other developments
- 16.1.9 NIHON SHIPYARD CO., LTD.
- 16.1.9.1 Business overview
- 16.1.9.2 Products offered
- 16.1.9.3 Recent developments
- 16.1.9.3.1 Product developments/launches
- 16.1.9.3.2 Deals
- 16.1.9.3.3 Other developments
- 16.1.10 IMABARI SHIPBUILDING CO. LTD.
- 16.1.10.1 Business overview
- 16.1.10.2 Products offered
- 16.1.10.3 Recent developments
- 16.1.10.3.1 Deals
- 16.1.10.3.2 Other developments
- 16.1.11 CHINA MERCHANTS HEAVY INDUSTRY (JIANGSU) CO., LTD.
- 16.1.11.1 Business overview
- 16.1.11.2 Products offered
- 16.1.11.3 Recent developments
- 16.1.11.3.1 Product developments/launches
- 16.1.11.3.2 Deals
- 16.1.11.3.3 Other developments
- 16.1.12 HJ SHIPBUILDING & CONSTRUCTION
- 16.1.12.1 Business overview
- 16.1.12.2 Products offered
- 16.1.12.2.1 Other developments
- 16.1.13 MAZAGON DOCK SHIPBUILDERS LIMITED
- 16.1.13.1 Business overview
- 16.1.13.2 Products offered
- 16.1.13.2.1 Other developments
- 16.1.14 TERSAN SHIPYARD
- 16.1.14.1 Business overview
- 16.1.14.2 Products offered
- 16.1.14.3 Recent developments
- 16.1.14.3.1 Product developments/launches
- 16.1.14.3.2 Other developments
- 16.1.15 VARD AS
- 16.1.15.1 Business overview
- 16.1.15.2 Products offered
- 16.1.15.3 Recent developments
- 16.1.15.3.1 Product developments/launches
- 16.1.15.3.2 Other developments
- 16.1.16 ULSTEIN GROUP ASA
- 16.1.16.1 Business overview
- 16.1.16.2 Products offered
- 16.1.16.3 Recent developments
- 16.1.16.3.1 Product developments/launches
- 16.1.16.3.2 Other developments
- 16.1.1 HD HYUNDAI HEAVY INDUSTRIES
- 16.2 OTHER PLAYERS
- 16.2.1 UZMAR
- 16.2.2 CEMRE SHIPYARD
- 16.2.3 SEFINE SHIPYARD
- 16.2.4 FR. FASSMER GMBH & CO. KG
- 16.2.5 KANASASHI HEAVY INDUSTRIES CO., LTD.
- 16.2.6 TAIZHOU SANFU SHIP ENGINEERING
- 16.2.7 NEW DAYANG SHIPBUILDING CO. LTD
- 16.2.8 JIANGSU ZHENJIANG SHIPYARD (GROUP) CO., LTD
- 16.2.9 JIANGSU QINFENG SHIPBUILDING CO., LTD.
17 RESEARCH METHODOLOGY
- 17.1 RESEARCH DATA
- 17.1.1 SECONDARY DATA
- 17.1.1.1 Key data from secondary sources
- 17.1.2 PRIMARY DATA
- 17.1.2.1 Primary interview participants
- 17.1.2.2 Key data from primary sources
- 17.1.3 BREAKDOWN OF PRIMARY INTERVIEWS
- 17.1.1 SECONDARY DATA
- 17.2 FACTOR ANALYSIS
- 17.2.1 INTRODUCTION
- 17.2.2 DEMAND-SIDE INDICATORS
- 17.2.3 SUPPLY-SIDE INDICATORS
- 17.3 MARKET SIZE ESTIMATION
- 17.3.1 BOTTOM-UP APPROACH
- 17.3.1.1 Market size estimation methodology (demand side)
- 17.3.2 TOP-DOWN APPROACH
- 17.3.1 BOTTOM-UP APPROACH
- 17.4 DATA TRIANGULATION
- 17.5 RESEARCH ASSUMPTIONS
- 17.6 RESEARCH LIMITATIONS
- 17.7 RISK ASSESSMENT
18 APPENDIX
- 18.1 DISCUSSION GUIDE
- 18.2 KNOWLEDGESTORE: MARKETSANDMARKETS' SUBSCRIPTION PORTAL
- 18.3 CUSTOMIZATION OPTIONS
- 18.4 RELATED REPORTS
- 18.5 AUTHOR DETAILS
