


|
시장보고서
상품코드
1800743
운송 관리 시스템(TMS) 시장(-2030년) : 솔루션(계획 및 시행, 오더 관리, 분석 및 보고서, 라우팅 및 트래킹), 운송 모드(도로, 철도, 항공, 해로), 최종사용자별Transportation Management System Market by Solutions (Planning & Execution, Order Management, Analytics & Reporting, Routing & Tracking), Transportation Mode (Roadways, Railways, Airways, Maritime), and End User - Global Forecast to 2030 |
||||||
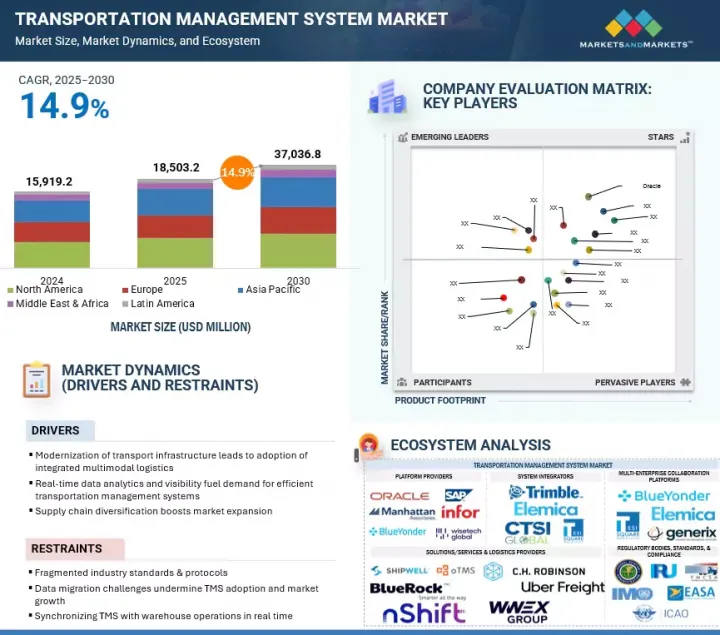
운송 관리 시스템(TMS) 시장 규모는 2025년 185억 320만 달러에서 예측 기간중 CAGR 14.9%로 성장을 지속하여, 2030년에는 370억 3,680만 달러에 이를 것으로 예측됩니다.
AI, 머신러닝(ML), IoT 등의 기술이 TMS의 기능을 대폭 강화하고 있습니다.
| 조사 범위 | |
|---|---|
| 조사 대상 연도 | 2020-2030년 |
| 기준 연도 | 2024년 |
| 예측 기간 | 2025-2030년 |
| 단위 | 금액(달러) |
| 부문 | 제공 구분(솔루션, 서비스), 운송 모드, 최종사용자, 지역 |
| 대상 지역 | 북미, 유럽, 아시아태평양, 중동 및 아프리카, 라틴아메리카 |
AI와 ML 알고리즘은 수요 패턴을 예측하고, 실시간으로 경로를 최적화하고, 의사결정 과정을 자동화하여 인적 오류를 줄이고 효율성을 높일 수 있습니다. IoT 디바이스는 차량 및 배송물로부터 실시간 데이터를 제공하여 운송 업무를 사전에 관리할 수 있게 해줍니다. 이러한 기술은 업무 효율성을 개선하고 더 나은 전략적 계획과 예측을 가능하게 합니다.

그러나 단편화된 화물 서류, 텔레매틱스, 규제 관련 신청 기준은 비용을 증가시키고 물류 사업자의 확장성을 제한하여 TMS(운송관리시스템)의 보급을 가로막고 있습니다. 운송업체들은 독자적인 EDI 형식을 사용하고 있으며, 유럽은 XML을 채택하고, 신흥 시장은 API 우선의 JSON 스키마를 우선시하고 있습니다. 이러한 프로토콜의 파편화는 시장 성장을 제한하고 규모의 경제를 저해하고 있습니다.
"매니지드 서비스 부문이 예측 기간 동안 가장 높은 CAGR을 나타낼 것으로 예측됩니다."
그 배경에는 엔드투엔드 물류 최적화, 실시간 화물 가시성, 확장 가능하고 비용 효율적인 운송 솔루션에 대한 수요 증가가 있습니다. 매니지드 서비스를 통해 기업은 복잡한 운송 계획, 실행 및 분석을 아웃소싱하고 전문적인 프로세스 관리와 첨단 기술의 혜택을 누리면서 핵심 업무에 집중할 수 있습니다. C.H. Robinson의 Managed TMS, Uber Freight의 기술 지원형 관리형 운송 서비스 등 업계를 대표하는 사례들은 세계 화주들이 관리형 솔루션을 활용하여 지속적인 프로세스 개선, 운영 비용 절감, 서비스 품질 향상을 실현하고 있음을 보여줍니다. 를 보여주고 있습니다.
최근 AI, 머신러닝, 실시간 추적의 통합으로 옴니채널 물류 및 예방적 문제 해결을 지원하고 있습니다. 기업들이 디지털 전환과 맞춤형 물류 전략에 대한 투자를 확대함에 따라, 매니지드 서비스는 진화하는 시장 환경에서 공급망 강인성과 전략적 우위를 확보하는 데 필수적인 요소로 자리 잡고 있습니다.
"최종 사용자별로는 제3자 물류(3PL) 제공업체 부문이 예측 기간 동안 가장 큰 시장 점유율을 차지할 것으로 예측됩니다."
3PL 부문은 다양한 고객을 위해 복잡한 공급망을 효율화 및 최적화하는 데 있어 핵심적인 역할을 하고 있기 때문에 시장에 가장 큰 기여를 할 것으로 예측됩니다. 3PL은 공급망 통합자 역할을 하며, TMS 플랫폼을 활용하여 대량의 거래를 관리하고, 세계 네트워크 전체에서 여러 운송 수단을 조정합니다. 이 업무는 실시간 화물 시각화, 동적 라우팅, 자동 운송업체 선정, 화주의 ERP 및 창고 시스템과의 원활한 통합과 같은 고도의 역량을 필요로 합니다.
"지역별로는 아시아태평양이 예측 기간 동안 가장 큰 성장률을 나타낼 것으로 예상되며, 북미가 가장 큰 시장을 유지할 것으로 보입니다."
아시아태평양은 가속화되는 디지털화, 대규모 정부 인프라 프로젝트, 규제 개선에 힘입어 가장 높은 성장률을 나타낼 것으로 예측됩니다. 중국과 인도는 대규모 스마트 시티 및 물류 회랑 구상을 전개하고 있으며, 각국 정부는 클라우드 도입과 교통 네트워크의 실시간 데이터 통합을 적극적으로 추진하고 있습니다. 싱가포르의 환경 컴플라이언스 기준과 일본의 디지털 화물 문서화 추진과 같은 새로운 규제는 지속 가능한 물류와 업무의 투명성을 지원하고 있습니다. 지역 TMS 제공업체들은 현지 전자상거래 및 공급망 요구에 맞는 AI 기반 클라우드 플랫폼을 빠르게 도입하고 있으며, 이는 아시아태평양 TMS 시장의 강력한 성장을 더욱 가속화하고 있습니다.
한편, 북미 시장은 여전히 세계를 선도하고 있으며, 업계 내 중요한 기술 혁신, 규제 변화, 전략적 성장 조치에 의해 주도되고 있습니다. 클라우드 기반 솔루션으로의 빠른 전환, IoT 프레임워크의 종합적인 통합, 동적 라우팅 및 실시간 데이터 분석에 있어 AI의 고도화된 활용으로 이러한 우위를 뒷받침하고 있습니다. 이러한 발전은 물류 제공업체와 화주에게 업무의 가시성과 효율성을 크게 향상시키고, 공급망의 성능과 반응성을 최적화하는 데 도움이 되고 있습니다.
세계의 운송 관리 시스템(TMS) 시장을 조사했으며, 시장 개요, 시장 성장에 영향을 미치는 각종 영향요인 분석, 기술 및 특허 동향, 법 및 규제 환경, 사례 분석, 시장 규모 추이 및 예측, 각종 부문별/지역별/주요 국가별 상세 분석, 경쟁 구도, 주요 기업 개요 등의 정보를 정리하여 전해드립니다. 정리했습니다.
목차
제1장 서론
제2장 조사 방법
제3장 주요 요약
제4장 프리미엄 인사이트
제5장 시장 개요
- 시장 역학
- 성장 촉진요인
- 성장 억제요인
- 기회
- 과제
- 운송 관리 시스템 역사
- 생태계 분석
- 사례 연구 분석
- 밸류체인 분석
- 가격 분석
- 기술 분석
- 특허 분석
- 고객 사업에 영향을 미치는 동향/혼란
- Porter의 Five Forces 분석
- 규제 상황
- 주요 이해관계자와 구입 기준
- 2025-2026년 주요 컨퍼런스 및 이벤트
- TMS 시장 기술 로드맵
- AI/생성형 AI가 TMS 시장에 미치는 영향
- 2024년 투자, 자금조달 시나리오
- TMS 시장 베스트 프랙티스
- 현재 비즈니스 모델과 신흥 비즈니스 모델
- 운송 관리로 사용되는 툴, 프레임워크, 기술
- 2025년 미국 관세의 TMS 시장에 대한 영향
제6장 운송 관리 시스템(TMS) 시장 : 제공 구분별
- 솔루션
- 계획 및 시행
- 주문 관리
- 감사, 결제 및 청구
- 분석 및 리포팅
- 라우팅 및 추적
- 기타
- 서비스
- 전문 서비스
- 매니지드 서비스
제7장 운송 관리 시스템(TMS) 시장 : 운송 모드별
- 도로
- 철도
- 항공
- 해로
제8장 운송 관리 시스템(TMS) 시장 : 최종사용자별
- 3PL
- 하송업자
- 화물 운송업자
- 기타
제9장 운송 관리 시스템(TMS) 시장 : 지역별
- 북미
- 시장 성장 촉진요인
- 거시경제 전망
- 미국
- 캐나다
- 유럽
- 시장 성장 촉진요인
- 거시경제 전망
- 영국
- 독일
- 프랑스
- 스페인
- 이탈리아
- 북유럽 국가
- 기타
- 아시아태평양
- 시장 성장 촉진요인
- 거시경제 전망
- 중국
- 인도
- 일본
- 호주 및 뉴질랜드
- 한국
- 동남아시아
- 기타
- 중동 및 아프리카
- 시장 성장 촉진요인
- 거시경제 전망
- GCC 국가
- 남아프리카공화국
- 기타
- 라틴아메리카
- 시장 성장 촉진요인
- 거시경제 전망
- 브라질
- 멕시코
- 아르헨티나
- 기타
제10장 경쟁 구도
- 개요
- 주요 시장 진출기업의 전략/강점
- 매출 분석
- 시장 점유율 분석
- 기업 평가와 재무 지표
- 브랜드/제품 비교
- 기업 평가 매트릭스 : 주요 기업
- 기업 평가 매트릭스 : 스타트업/중소기업
- 경쟁 시나리오
제11장 기업 개요
- 주요 기업
- ORACLE
- SAP
- MANHATTAN ASSOCIATES
- C.H. ROBINSON
- BLUE YONDER
- TRIMBLE
- WISETECH GLOBAL
- DESCARTES
- GENERIX GROUP
- KORBER AG
- UBER FREIGHT
- ALPEGA GROUP
- WWEX GROUP
- INFOR
- 기타 기업
- KINAXIS
- SHIPWELL
- APTEAN
- RATELINX
- OTMS
- NSHIFT
- BLUEROCK TMS
- ELEMICA
- TESISQUARE
- VTRADEX
- SHIPTIFY
- LOGISTICALLY
- INTELLITRANS
- ALLOTRAC
- REVENOVA
- PRINCETON TMX
- CTSI GLOBAL
- PCS SOFTWARE
- SHIPSY
제12장 인접 시장/관련 시장
제13장 부록
LSH 25.09.05The transportation management system (TMS) market is estimated to be USD 18,503.2 million in 2025 and is projected to reach USD 37,036.8 million by 2030 at a CAGR of 14.9%. Technologies such as artificial intelligence (AI), machine learning (ML), and the Internet of Things (IoT) are significantly enhancing TMS capabilities.
| Scope of the Report | |
|---|---|
| Years Considered for the Study | 2020-2030 |
| Base Year | 2024 |
| Forecast Period | 2025-2030 |
| Units Considered | Value (USD) Million/Billion |
| Segments | Offering (solutions and services), transportation mode, end user, and region |
| Regions covered | North America, Europe, Asia Pacific, Middle East & Africa, and Latin America |
AI and ML algorithms can predict demand patterns, optimize routes in real-time, and automate decision-making processes, reducing human error and increasing efficiency. IoT devices provide real-time data from vehicles and shipments, allowing for proactive management of transportation operations. These technologies improve operational efficiency and enable better strategic planning and forecasting.
However, fragmented standards in freight documentation, telematics, and regulatory filings hinder TMS adoption by increasing costs and limiting scalability for logistics providers. Carriers often use proprietary EDI formats, Europe favors XML, and emerging markets prioritize API-first JSON schemas. This protocol fragmentation restricts market growth and undermines economies of scale.
"Managed services segment is projected to register the highest CAGR during the forecast period"
The managed services segment is projected to register the highest CAGR in the transportation management system (TMS) market, fueled by the growing demand for end-to-end logistics optimization, real-time freight visibility, and scalable, cost-effective transportation solutions. Managed services allow businesses to outsource complex transportation planning, execution, and analytics, enabling them to focus on core operations while benefiting from expert process management and advanced technology. Leading industry examples, such as C.H. Robinson's Managed TMS and Uber Freight's technology-enabled managed transportation services, demonstrate how global shippers are leveraging managed solutions for continuous process improvement, lower operational costs, and enhanced service quality.
Recent trends include the integration of artificial intelligence, machine learning, and real-time tracking, which support omnichannel logistics and proactive issue resolution. As companies invest more in digital transformation and customizable logistics strategies, managed services are increasingly essential for driving supply chain resilience and strategic advantage in an evolving market landscape.
"Third-party logistics providers end user segment is expected to hold the largest market share during the forecast period"
The third-party logistics providers (3PLs) end user segment is projected to be the largest contributor to the transportation management system (TMS) market due to its pivotal role in streamlining and optimizing complex supply chains for a diverse range of clients. 3PLs act as supply chain integrators, leveraging TMS platforms to manage high transaction volumes and coordinate multi-modal shipments across global networks. Their operations demand advanced capabilities such as real-time freight visibility, dynamic routing, automated carrier selection, and seamless integration with shippers' ERP and warehouse systems.
Industry leaders, such as C.H. Robinson, have demonstrated the transformative power of TMS through technology-enabled managed transportation services, offering shippers flexible, scalable, and data-driven logistics solutions. Similarly, WWEX Group and Uber Freight have utilized TMS-driven digital brokerage platforms to enhance shipment transparency, improve carrier engagement, and deliver superior customer service. The centrality of 3PLs in orchestrating end-to-end logistics, combined with their adoption of cutting-edge TMS solutions, positions them as the largest and most influential end-user group in the TMS market.
"Asia Pacific will register the highest growth rate while North America will hold the largest market during the forecast period"
Asia Pacific is poised to achieve the highest growth rate, propelled by accelerated digitalization, ambitious government infrastructure projects, and regulatory advancements. China and India are rolling out large-scale smart city and logistics corridor initiatives, while governments across the region are actively incentivizing cloud adoption and real-time data integration in transport networks. New regulations, such as Singapore's environmental compliance standards and Japan's push for digital freight documentation, support sustainable logistics and operational transparency. Regional TMS providers are rapidly launching AI-powered, cloud-based platforms tailored for local e-commerce and supply chain needs, further fueling Asia Pacific's robust TMS market expansion.
The North American market remains the global leader, propelled by significant technological innovations, critical regulatory changes, and strategic growth initiatives within the industry. This dominance is underpinned by the swift transition to cloud-based solutions, comprehensive integration of Internet of Things (IoT) frameworks, and the advanced use of artificial intelligence for dynamic routing and real-time data analytics. These developments substantially enhance operational visibility and efficiency for logistics providers and shippers, optimizing supply chain performance and responsiveness.
Breakdown of primaries
The study contains insights from various industry experts, from solution vendors to Tier 1 companies. The break-up of the primaries is as follows:
- By Company Type: Tier 1 - 18%, Tier 2 - 44%, and Tier 3 - 38%
- By Designation: C-level - 32%, D-level - 36%, and Managers - 32%
- By Region: North America - 38%, Europe - 26%, Asia Pacific - 18%, Middle East & Africa - 10%, and Latin America - 8%.
The major players in the TMS market are Oracle (US), SAP (Germany), Manhattan Associates (US), C.H. Robinson (US), Trimble (US), Wisetech Global (Australia), Descartes (Canada), Generix Group (France), Korber AG (Germany), Blue Yonder (US), Uber Freight (US), Alpega Group (Belgium), WWEX Group (US), and Infor (US). These players have adopted various growth strategies, such as partnerships, agreements, collaborations, new product launches, product enhancements, and acquisitions, to expand their TMS footprint.
Research Coverage
The market study covers the TMS market size across different segments. It aims to estimate the market size and the growth potential across various segments, including offering (solutions and services), transportation mode, end user, vertical, and regions. The study includes an in-depth competitive analysis of the leading market players, their company profiles, key observations related to product and business offerings, recent developments, and market strategies.
Key Benefits of Buying the Report
The report will help market leaders and new entrants with information on the closest approximations of the global TMS market's revenue numbers and subsegments. It will also help stakeholders understand the competitive landscape and gain more insights to better position their businesses and plan suitable go-to-market strategies. Moreover, the report will provide insights for stakeholders to understand the market's pulse and provide them with information on key market drivers, restraints, challenges, and opportunities.
The report provides insights into the following pointers:
1. Analysis of key drivers (Modernization of transport infrastructure leading to adoption of integrated multimodal logistics, Real-time data analytics and visibility fuels demand for efficient transportation management systems, Supply chain diversification is a catalyst for market expansion), restraints (Fragmented industry standards & protocols, Data migration challenges undermine TMS adoption and market growth, Synchronizing TMS with warehouse operations in real time), opportunities (Push for sustainability and green logistics, Smart-city and urban logistics integration, Advanced reverse-logistics orchestration), and challenges (Trade tensions and tariff volatility suppress market momentum, System integration complexities between TMS and enterprise systems, Bridging EDI and API workflows for seamless TMS integration) influencing the growth of the transportation management system market
2. Product Development/Innovation: Detailed insights on upcoming technologies, research and development activities, and new product and service launches in the TMS market
3. Market Development: Comprehensive information about lucrative markets - the report analyses various regions' TMS markets
4. Market Diversification: Exhaustive information about new products and services, untapped geographies, recent developments, and investments in the TMS market
5. Competitive Assessment: In-depth assessment of market shares, growth strategies, and service offerings of leading players, such as Oracle (US), SAP (Germany), Manhattan Associates (US), C.H. Robinson (US), Trimble (US), Wisetech Global (Australia), Descartes (Canada), Generix Group (France), Korber AG (Germany), Blue Yonder (US), Uber Freight (US), Alpega Group (Belgium), WWEX Group (US), and Infor (US)
TABLE OF CONTENTS
1 INTRODUCTION
- 1.1 STUDY OBJECTIVES
- 1.2 MARKET DEFINITION
- 1.3 STUDY SCOPE
- 1.3.1 MARKET SEGMENTATION AND REGIONAL SCOPE
- 1.3.2 INCLUSIONS & EXCLUSIONS
- 1.3.3 YEARS CONSIDERED
- 1.4 CURRENCY CONSIDERED
- 1.5 STAKEHOLDERS
- 1.6 SUMMARY OF CHANGES
2 RESEARCH METHODOLOGY
- 2.1 RESEARCH DATA
- 2.1.1 SECONDARY DATA
- 2.1.1.1 Key data from secondary sources
- 2.1.2 PRIMARY DATA
- 2.1.2.1 Key primary participants
- 2.1.2.2 Breakup of primary profiles
- 2.1.2.3 Key industry insights
- 2.1.1 SECONDARY DATA
- 2.2 MARKET SIZE ESTIMATION
- 2.2.1 BOTTOM-UP APPROACH
- 2.2.2 TOP-DOWN APPROACH
- 2.2.3 TRANSPORTATION MANAGEMENT SYSTEM MARKET ESTIMATION: DEMAND-SIDE ANALYSIS
- 2.3 DATA TRIANGULATION
- 2.4 RISK ASSESSMENT
- 2.5 ASSUMPTIONS
- 2.6 LIMITATIONS
3 EXECUTIVE SUMMARY
4 PREMIUM INSIGHTS
- 4.1 ATTRACTIVE OPPORTUNITIES FOR PLAYERS IN TRANSPORTATION MANAGEMENT SYSTEM MARKET
- 4.2 NORTH AMERICA: TRANSPORTATION MANAGEMENT SYSTEM MARKET, BY END-USERS AND COUNTRY
- 4.3 ASIA PACIFIC: TRANSPORTATION MANAGEMENT SYSTEM MARKET, BY TRANSPORTATION MODE AND COUNTRY
5 MARKET OVERVIEW
- 5.1 INTRODUCTION
- 5.2 MARKET DYNAMICS
- 5.2.1 DRIVERS
- 5.2.1.1 Modernization of transport infrastructure leading to adoption of integrated multimodal logistics
- 5.2.1.2 Real-time data analytics and visibility to fuel demand for efficient transportation management systems
- 5.2.1.3 Supply chain diversification to fuel market expansion
- 5.2.2 RESTRAINTS
- 5.2.2.1 Fragmented industry standards & protocols
- 5.2.2.2 Data migration challenges undermine TMS adoption and market growth
- 5.2.2.3 Synchronizing TMS with warehouse operations in real time
- 5.2.3 OPPORTUNITIES
- 5.2.3.1 Push for sustainability and green logistics
- 5.2.3.2 Smart city and urban logistics integration
- 5.2.3.3 Advanced reverse-logistics orchestration
- 5.2.4 CHALLENGES
- 5.2.4.1 Trade tensions and tariff volatility suppress market momentum
- 5.2.4.2 System integration complexities between TMS and enterprise systems
- 5.2.4.3 Bridging EDI and API workflows for seamless TMS integration
- 5.2.1 DRIVERS
- 5.3 HISTORY OF TRANSPORTATION MANAGEMENT SYSTEM
- 5.4 ECOSYSTEM ANALYSIS
- 5.4.1 PLATFORM PROVIDERS
- 5.4.2 SYSTEM INTEGRATORS
- 5.4.3 SOLUTIONS/SERVICES & LOGISTICS PROVIDERS
- 5.4.4 MULTI-ENTERPRISE COLLABORATION PLATFORMS
- 5.4.5 REGULATORY BODIES, STANDARDS, & COMPLIANCE
- 5.5 CASE STUDY ANALYSIS
- 5.5.1 CASE STUDY 1: TETRA PAK MODERNIZES GLOBAL LOGISTICS WITH ORACLE CLOUD
- 5.5.2 CASE STUDY 2: SAP HELPS XIWEI BUILD EFFICIENT TRANSPORTATION AND DELIVERY PLATFORM
- 5.5.3 CASE STUDY 3: CARHARTT IMPLEMENTS MANHATTAN TMS SOLUTION IN SUPPLY CHAIN
- 5.5.4 CASE STUDY 4: BILLERUD RESHAPES OUTBOUND LOGISTICS WITH MERCURYGATE TMS
- 5.5.5 CASE STUDY 5: TRIMBLE TRANSPORTATION SOLUTIONS DRIVE EFFICIENCY AND INNOVATION AT MCCOY GROUP
- 5.5.6 CASE STUDY 6: AVERY DENNISON ADOPTS TRANSPLACE TMS TO SIMPLIFY CUSTOMS COMPLIANCE IN US AND MEXICO
- 5.6 VALUE CHAIN ANALYSIS
- 5.7 PRICING ANALYSIS
- 5.7.1 AVERAGE SELLING PRICE OF TMS SOLUTIONS & SERVICES, BY KEY PLAYERS, 2024
- 5.7.2 INDICATIVE PRICING FOR TMS SOLUTIONS (PER MONTH), TRANSPORTATION MODE, 2024
- 5.8 TECHNOLOGY ANALYSIS
- 5.8.1 KEY TECHNOLOGIES
- 5.8.1.1 Artificial Intelligence & Machine Learning
- 5.8.1.2 Cloud-native & SaaS Architecture
- 5.8.1.3 Internet of Things & Telematics Integration
- 5.8.2 COMPLEMENTARY TECHNOLOGIES
- 5.8.2.1 Enterprise Resource Planning
- 5.8.2.2 E-Commerce & Order Management Platforms
- 5.8.3 ADJACENT TECHNOLOGIES
- 5.8.3.1 Autonomous & Connected Vehicles
- 5.8.3.2 Warehouse Management Systems
- 5.8.1 KEY TECHNOLOGIES
- 5.9 PATENT ANALYSIS
- 5.9.1 METHODOLOGY
- 5.9.2 TRANSPORTATION MANAGEMENT SYSTEM MARKET: KEY PATENTS (2016-2025)
- 5.10 TRENDS/DISRUPTIONS IMPACTING CUSTOMER BUSINESS
- 5.11 PORTER'S FIVE FORCES ANALYSIS
- 5.11.1 THREAT OF NEW ENTRANTS
- 5.11.2 THREAT OF SUBSTITUTES
- 5.11.3 BARGAINING POWER OF SUPPLIERS
- 5.11.4 BARGAINING POWER OF BUYERS
- 5.11.5 INTENSITY OF COMPETITIVE RIVALRY
- 5.12 REGULATORY LANDSCAPE
- 5.12.1 REGULATORY BODIES, GOVERNMENT AGENCIES, AND OTHER ORGANIZATIONS
- 5.12.1.1 International Organization for Standardization
- 5.12.1.1.1 ISO/IEC JTC 1
- 5.12.1.1.2 ISO/IEC 27001
- 5.12.1.1.3 ISO/IEC 19770
- 5.12.1.1.4 ISO/IEC JTC 1/SWG 5
- 5.12.1.1.5 ISO/IEC JTC 1/SC 31
- 5.12.1.1.6 ISO/IEC JTC 1/SC 27
- 5.12.1.1.7 ISO/IEC JTC 1/WG 7
- 5.12.1.2 General Data Protection Regulation
- 5.12.1.3 Federal Motor Carrier Safety Administration (FMCSA)
- 5.12.1.4 Federal Highway Administration (FHWA)
- 5.12.1.5 Maritime Administration (MARAD)
- 5.12.1.6 Federal Aviation Administration (FAA)
- 5.12.1.7 Federal Railroad Administration (FRA)
- 5.12.1.8 Institute of Electrical and Electronics Engineers
- 5.12.1.9 CEN/ISO
- 5.12.1.10 CEN/CENELEC
- 5.12.1.11 European Telecommunications Standards Institute
- 5.12.1.12 ITU-T
- 5.12.1.1 International Organization for Standardization
- 5.12.1 REGULATORY BODIES, GOVERNMENT AGENCIES, AND OTHER ORGANIZATIONS
- 5.13 KEY STAKEHOLDERS AND BUYING CRITERIA
- 5.13.1 KEY STAKEHOLDERS IN BUYING PROCESS
- 5.13.2 BUYING CRITERIA
- 5.14 KEY CONFERENCES AND EVENTS IN 2025-2026
- 5.15 TECHNOLOGY ROADMAP FOR TRANSPORTATION MANAGEMENT SYSTEM MARKET
- 5.15.1 SHORT-TERM ROADMAP (2025-2026)
- 5.15.2 MID-TERM ROADMAP (2027-2028)
- 5.15.3 LONG-TERM ROADMAP (2029-2030)
- 5.16 IMPACT OF AI/GENERATIVE AI ON TRANSPORTATION MANAGEMENT SYSTEM MARKET
- 5.16.1 USE CASES OF AI/GENERATIVE AI IN TRANSPORTATION MANAGEMENT SYSTEM MARKET
- 5.17 INVESTMENT AND FUNDING SCENARIO, 2024
- 5.18 BEST PRACTICES IN TRANSPORTATION MANAGEMENT SYSTEM MARKET
- 5.19 CURRENT AND EMERGING BUSINESS MODELS
- 5.20 TOOLS, FRAMEWORKS, AND TECHNIQUES USED IN TRANSPORTATION MANAGEMENT
- 5.21 IMPACT OF 2025 US TARIFF-TRANSPORTATION MANAGEMENT SYSTEM MARKET
- 5.21.1 INTRODUCTION
- 5.21.2 KEY TARIFF RATES
- 5.21.3 PRICE IMPACT ANALYSIS
- 5.21.3.1 Strategic shifts and emerging trends
- 5.21.4 IMPACT ON COUNTRY/REGION
- 5.21.4.1 US
- 5.21.4.2 China
- 5.21.4.3 Europe
- 5.21.4.4 Asia Pacific (excluding China)
- 5.21.5 IMPACT ON END USERS
- 5.21.5.1 3PLs
- 5.21.5.2 Shippers
- 5.21.5.3 Freight forwarders
- 5.21.5.4 Other end users
6 TRANSPORTATION MANAGEMENT SYSTEM MARKET, BY OFFERING
- 6.1 INTRODUCTION
- 6.1.1 OFFERING: TRANSPORTATION MANAGEMENT SYSTEM MARKET DRIVERS
- 6.2 SOLUTIONS
- 6.2.1 NEED FOR ENHANCED TRANSPORT MANAGEMENT AND RISE OF DIGITALIZATION TO FUEL DEMAND
- 6.2.2 PLANNING & EXECUTION
- 6.2.3 ORDER MANAGEMENT
- 6.2.4 AUDIT, PAYMENT, & CLAIMS
- 6.2.5 ANALYTICS & REPORTING
- 6.2.6 ROUTING & TRACKING
- 6.2.7 OTHER SOLUTIONS
- 6.3 SERVICES
- 6.3.1 RISING DEMAND FOR OPTIMIZED LOGISTICS STRATEGIES TAILORED TO SPECIFIC BUSINESS NEEDS TO DRIVE MARKET
- 6.3.2 PROFESSIONAL SERVICES
- 6.3.2.1 Consulting
- 6.3.2.2 Integration & Implementation
- 6.3.2.3 Support & Maintenance
- 6.3.3 MANAGED SERVICES
7 TRANSPORTATION MANAGEMENT SYSTEM MARKET, BY TRANSPORTATION MODE
- 7.1 INTRODUCTION
- 7.1.1 TRANSPORTATION MODE: TRANSPORTATION MANAGEMENT SYSTEM MARKET DRIVERS
- 7.2 ROADWAYS
- 7.2.1 INCREASING ON-ROAD COMMERCIAL TRANSPORTATION TO FUEL MARKET GROWTH
- 7.3 RAILWAYS
- 7.3.1 CUSTOMER-CENTRIC ROUTE OPTIMIZATION OPTIONS TO DRIVE MARKET
- 7.4 AIRWAYS
- 7.4.1 INCREASING INTERNATIONAL E-COMMERCE TO LEAD TO SEGMENT GROWTH
- 7.5 MARITIME
- 7.5.1 RISING INTERNATIONAL MARITIME TRANSPORT COSTS TO BOOST DEMAND FOR MANAGEMENT SYSTEMS
8 TRANSPORTATION MANAGEMENT SYSTEM MARKET, BY END USER
- 8.1 INTRODUCTION
- 8.1.1 END USER: TRANSPORTATION MANAGEMENT SYSTEM MARKET DRIVERS
- 8.2 3PLS
- 8.2.1 NEED TO ELIMINATE MANUAL WORK AND INCREASE EFFICIENCY TO FUEL MARKET GROWTH
- 8.3 SHIPPERS
- 8.3.1 NEED TO IMPROVE SUPPLY CHAIN AND CUSTOMER RELATIONSHIPS TO DRIVE MARKET
- 8.4 FREIGHT FORWARDERS
- 8.4.1 MANAGE AND OPTIMIZE COMPLEX LOGISTICS OPERATIONS ACROSS GLOBAL SUPPLY CHAINS
- 8.5 OTHER END USERS
9 TRANSPORTATION MANAGEMENT SYSTEM MARKET, BY REGION
- 9.1 INTRODUCTION
- 9.2 NORTH AMERICA
- 9.2.1 NORTH AMERICA: TRANSPORTATION MANAGEMENT SYSTEM MARKET DRIVERS
- 9.2.2 NORTH AMERICA: MACROECONOMIC OUTLOOK
- 9.2.3 US
- 9.2.3.1 Established presence of key TMS players and advanced IT infrastructure drive market
- 9.2.4 CANADA
- 9.2.4.1 Strategic investments in infrastructure and technology to drive market
- 9.3 EUROPE
- 9.3.1 EUROPE: TRANSPORTATION MANAGEMENT SYSTEM MARKET DRIVERS
- 9.3.2 EUROPE: MACROECONOMIC OUTLOOK
- 9.3.3 UK
- 9.3.3.1 Government initiatives supported by collaborations and partnerships to drive market
- 9.3.4 GERMANY
- 9.3.4.1 Major investments by public and private sectors to drive market
- 9.3.5 FRANCE
- 9.3.5.1 Major investments by government in ICT infrastructure to drive market
- 9.3.6 SPAIN
- 9.3.6.1 Significant government investments in transportation sector to drive market
- 9.3.7 ITALY
- 9.3.7.1 Major opportunities for TMS vendors to fuel market growth
- 9.3.8 NORDIC COUNTRIES
- 9.3.8.1 Significant shift toward cloud-based TMS solutions to boost market
- 9.3.9 REST OF EUROPE
- 9.4 ASIA PACIFIC
- 9.4.1 ASIA PACIFIC: TRANSPORTATION MANAGEMENT SYSTEM MARKET DRIVERS
- 9.4.2 ASIA PACIFIC: MACROECONOMIC OUTLOOK
- 9.4.3 CHINA
- 9.4.3.1 Need for robust infrastructure for transportation management to boost growth
- 9.4.4 INDIA
- 9.4.4.1 Digitalization across business verticals to drive market
- 9.4.5 JAPAN
- 9.4.5.1 R&D capabilities and regulatory reforms by government to drive market
- 9.4.6 AUSTRALIA & NEW ZEALAND
- 9.4.6.1 Growing need for safety and reducing carbon emissions to boost market
- 9.4.7 SOUTH KOREA
- 9.4.7.1 Investments in advanced technologies to drive market
- 9.4.8 SOUTHEAST ASIA
- 9.4.8.1 Rising investments in infrastructure and digital transformation to boost market
- 9.4.9 REST OF ASIA PACIFIC
- 9.5 MIDDLE EAST & AFRICA
- 9.5.1 MIDDLE EAST & AFRICA: MARKET DRIVERS
- 9.5.2 MIDDLE EAST & AFRICA: MACROECONOMIC OUTLOOK
- 9.5.3 GCC COUNTRIES
- 9.5.3.1 Rapid urbanization and focus on cost reduction to drive market
- 9.5.3.2 Kingdom of Saudi Arabia
- 9.5.3.2.1 Government initiatives to develop advanced logistics and transportation systems to fuel market growth
- 9.5.3.3 United Arab Emirates
- 9.5.3.3.1 Data-driven transportation services facilitating seamless transits to drive market
- 9.5.3.4 Rest of GCC Countries
- 9.5.4 SOUTH AFRICA
- 9.5.4.1 High spending on IT infrastructure to fuel market
- 9.5.5 REST OF MIDDLE EAST & AFRICA
- 9.6 LATIN AMERICA
- 9.6.1 LATIN AMERICA: MARKET DRIVERS
- 9.6.2 LATIN AMERICA: MACROECONOMIC OUTLOOK
- 9.6.3 BRAZIL
- 9.6.3.1 Low IT spending, meager cloud adoption, and limited investments from vendors to boost market
- 9.6.4 MEXICO
- 9.6.4.1 Stable logistics market and technical expertise in cloud adoption to drive market
- 9.6.5 ARGENTINA
- 9.6.5.1 Growing digitalization to drive market
- 9.6.6 REST OF LATIN AMERICA
10 COMPETITIVE LANDSCAPE
- 10.1 OVERVIEW
- 10.2 KEY PLAYER STRATEGIES/RIGHT TO WIN
- 10.3 REVENUE ANALYSIS, 2020-2024
- 10.4 MARKET SHARE ANALYSIS, 2024
- 10.5 COMPANY VALUATION AND FINANCIAL METRICS
- 10.6 BRAND/PRODUCT COMPARISON
- 10.7 COMPANY EVALUATION MATRIX: KEY PLAYERS, 2025
- 10.7.1 STARS
- 10.7.2 EMERGING LEADERS
- 10.7.3 PERVASIVE PLAYERS
- 10.7.4 PARTICIPANTS
- 10.7.5 COMPANY FOOTPRINT: KEY PLAYERS, 2025
- 10.7.5.1 Company footprint
- 10.7.5.2 Regional footprint
- 10.7.5.3 Offering footprint
- 10.7.5.4 Transportation Mode footprint
- 10.7.5.5 End User footprint
- 10.8 COMPANY EVALUATION MATRIX: STARTUP/SMES, 2025
- 10.8.1 PROGRESSIVE COMPANIES
- 10.8.2 RESPONSIVE COMPANIES
- 10.8.3 DYNAMIC COMPANIES
- 10.8.4 STARTING BLOCKS
- 10.8.5 COMPETITIVE BENCHMARKING: STARTUPS/SMES, 2025
- 10.8.5.1 Detailed list of key startups/SMEs
- 10.9 COMPETITIVE SCENARIO
- 10.9.1 PRODUCT LAUNCHES & ENHANCEMENTS
- 10.9.2 DEALS
11 COMPANY PROFILES
- 11.1 MAJOR PLAYERS
- 11.1.1 ORACLE
- 11.1.1.1 Business overview
- 11.1.1.2 Products/Solutions/Services offered
- 11.1.1.3 Recent developments
- 11.1.1.3.1 Product launches
- 11.1.1.3.2 Deals
- 11.1.1.4 MnM view
- 11.1.1.4.1 Key strengths
- 11.1.1.4.2 Strategic choices
- 11.1.1.4.3 Weaknesses & competitive threats
- 11.1.2 SAP
- 11.1.2.1 Business overview
- 11.1.2.2 Products/Solutions/Services offered
- 11.1.2.3 Recent developments
- 11.1.2.3.1 Product launches
- 11.1.2.3.2 Deals
- 11.1.2.4 MnM view
- 11.1.2.4.1 Key strengths
- 11.1.2.4.2 Strategic choices
- 11.1.2.4.3 Weaknesses & competitive threats
- 11.1.3 MANHATTAN ASSOCIATES
- 11.1.3.1 Business overview
- 11.1.3.2 Products/Solutions/Services offered
- 11.1.3.3 Recent developments
- 11.1.3.3.1 Product launches
- 11.1.3.3.2 Deals
- 11.1.3.4 MnM view
- 11.1.3.4.1 Key strengths
- 11.1.3.4.2 Strategic choices
- 11.1.3.4.3 Weaknesses & competitive threats
- 11.1.4 C.H. ROBINSON
- 11.1.4.1 Business overview
- 11.1.4.2 Products/Solutions/Services offered
- 11.1.4.3 Recent developments
- 11.1.4.3.1 Product launches
- 11.1.4.3.2 Deals
- 11.1.4.4 MnM view
- 11.1.4.4.1 Key strengths
- 11.1.4.4.2 Strategic choices
- 11.1.4.4.3 Weaknesses & competitive threats
- 11.1.5 BLUE YONDER
- 11.1.5.1 Business overview
- 11.1.5.2 Products/Solutions/Services offered
- 11.1.5.3 Recent developments
- 11.1.5.3.1 Product launches
- 11.1.5.3.2 Deals
- 11.1.5.4 MnM view
- 11.1.5.4.1 Key strengths
- 11.1.5.4.2 Strategic choices
- 11.1.5.4.3 Weaknesses & competitive threats
- 11.1.6 TRIMBLE
- 11.1.6.1 Business overview
- 11.1.6.2 Products/Solutions/Services offered
- 11.1.6.3 Recent developments
- 11.1.6.3.1 Product launches
- 11.1.6.3.2 Deals
- 11.1.7 WISETECH GLOBAL
- 11.1.7.1 Business overview
- 11.1.7.2 Products/Solutions/Services offered
- 11.1.7.3 Recent developments
- 11.1.7.3.1 Product launches
- 11.1.7.3.2 Deals
- 11.1.8 DESCARTES
- 11.1.8.1 Business overview
- 11.1.8.2 Products/Solutions/Services offered
- 11.1.8.3 Recent developments
- 11.1.8.3.1 Product launches
- 11.1.8.3.2 Deals
- 11.1.9 GENERIX GROUP
- 11.1.9.1 Business overview
- 11.1.9.2 Products/Solutions/Services offered
- 11.1.9.3 Recent developments
- 11.1.9.3.1 Deals
- 11.1.10 KORBER AG
- 11.1.10.1 Business overview
- 11.1.10.2 Products/Solutions/Services offered
- 11.1.10.3 Recent developments
- 11.1.10.3.1 Deals
- 11.1.11 UBER FREIGHT
- 11.1.11.1 Business overview
- 11.1.11.2 Products/Solutions/Services offered
- 11.1.11.3 Recent developments
- 11.1.11.3.1 Product launches
- 11.1.11.3.2 Deals
- 11.1.12 ALPEGA GROUP
- 11.1.12.1 Business overview
- 11.1.12.2 Products/Solutions/Services offered
- 11.1.12.3 Recent developments
- 11.1.12.3.1 Deals
- 11.1.13 WWEX GROUP
- 11.1.13.1 Business overview
- 11.1.13.2 Products/Solutions/Services offered
- 11.1.13.3 Recent developments
- 11.1.13.3.1 Deals
- 11.1.14 INFOR
- 11.1.14.1 Business overview
- 11.1.14.2 Products/Solutions/Services offered
- 11.1.14.3 Recent developments
- 11.1.14.3.1 Product launches
- 11.1.14.3.2 Deals
- 11.1.1 ORACLE
- 11.2 OTHER PLAYERS
- 11.2.1 KINAXIS
- 11.2.2 SHIPWELL
- 11.2.3 APTEAN
- 11.2.4 RATELINX
- 11.2.5 OTMS
- 11.2.6 NSHIFT
- 11.2.7 BLUEROCK TMS
- 11.2.8 ELEMICA
- 11.2.9 TESISQUARE
- 11.2.10 VTRADEX
- 11.2.11 SHIPTIFY
- 11.2.12 LOGISTICALLY
- 11.2.13 INTELLITRANS
- 11.2.14 ALLOTRAC
- 11.2.15 REVENOVA
- 11.2.16 PRINCETON TMX
- 11.2.17 CTSI GLOBAL
- 11.2.18 PCS SOFTWARE
- 11.2.19 SHIPSY
12 ADJACENT/RELATED MARKETS
- 12.1 INTRODUCTION
- 12.1.1 LIMITATIONS
- 12.2 SMART TRANSPORTATION MARKET - GLOBAL FORECAST TO 2029
- 12.2.1 MARKET DEFINITION
- 12.2.2 MARKET OVERVIEW
- 12.2.2.1 Smart transportation market, by transportation mode
- 12.2.2.2 Smart transportation market, by roadway
- 12.2.2.3 Smart transportation market, by railway
- 12.2.2.4 Smart transportation market, by airway
- 12.2.2.5 Smart transportation market, by maritime
- 12.2.2.6 Smart transportation market, by end user
- 12.2.2.7 Smart transportation market, by region
- 12.3 FLEET MANAGEMENT MARKET - GLOBAL FORECAST TO 2028
- 12.3.1 MARKET DEFINITION
- 12.3.2 MARKET OVERVIEW
- 12.3.2.1 Fleet management market, by component
- 12.3.2.2 Fleet management market, by fleet type
- 12.3.2.3 Fleet management market, by vertical
- 12.3.2.4 Fleet management market, by region
13 APPENDIX
- 13.1 DISCUSSION GUIDE
- 13.2 KNOWLEDGESTORE: MARKETSANDMARKETS' SUBSCRIPTION PORTAL
- 13.3 CUSTOMIZATION OPTIONS
- 13.4 RELATED REPORTS
- 13.5 AUTHOR DETAILS
