


|
시장보고서
상품코드
1833295
근접 센서 시장 : 기술별, 제품 유형별, 감지 범위별, 출력별, 최종 용도 업계별, 지역별 - 예측(-2030년)Proximity Sensor Market by Technology (Inductive, Capacitive, Magnetic, Photoelectric/Optical, Ultrasonic), Product Type (Fixed & Adjustable distance), Range (<10 MM, 10-20 MM, 21-40 MM, >40 MM), Output and Region - Global Forecast to 2030 |
||||||
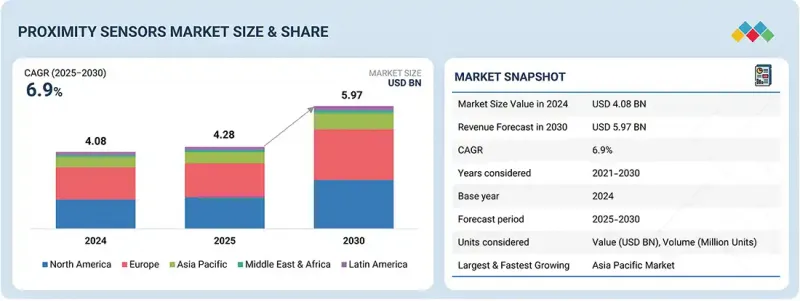
근접 센서 시장 규모는 예측 기간중 CAGR이 6.9%를 보이고, 2025년 42억 8,000만 달러에서 2030년에는 59억 7,000만 달러에 이를 것으로 예측됩니다.
| 조사 범위 | |
|---|---|
| 조사 대상 연도 | 2021-2030년 |
| 기준 연도 | 2024년 |
| 예측 기간 | 2025-2030년 |
| 검토 단위 | 금액(100만 달러) |
| 부문별 | 기술별, 제품 유형별, 측정 범위별, 출력별, 최종 용도 업계별, 지역별 |
| 대상 지역 | 북미, 유럽, 아시아태평양, 기타 지역 |
세계 근접 센서 시장을 이끄는 주요 요인 중 하나는 다양한 산업에서 자동화 및 스마트 기술 채택이 증가하고 있다는 점입니다. 근접 센서는 비접촉식 감지, 안전, 공정 효율을 실현하는 데 필수적이며, 자동차 제조, 산업용 로봇, 가전기기에서 높은 가치를 발휘하고 있습니다. 첨단운전자보조시스템(ADAS)와 전기자동차의 급속한 확산으로 주차지원, 충돌감지 등의 기능을 지원하는 이러한 센서에 대한 수요가 크게 증가하고 있습니다.

또한, IoT 기기 및 스마트 홈 기술의 보급은 일상 생활에의 통합을 더욱 촉진하고 있습니다. 열악한 환경에서도 안정적으로 작동하는 능력과 초음파 감지, 광전 감지 등 센싱 기술의 발전으로 그 사용 범위가 넓어지고 있습니다. 또한, 산업 자동화 및 디지털화를 촉진하는 정부 이니셔티브는 전체 시장의 성장을 가속화하고 더 많은 모멘텀을 제공합니다.
10-20mm 감지 범위 부문은 2030년까지 근접 센서 시장에서 두 번째로 큰 시장 점유율을 차지할 것으로 예측됩니다. 이 범위는 감지 거리와 정확도의 최적 균형을 제공하여 자동차, 전자, 산업 자동화 용도에 매우 적합합니다. 중거리 감지가 필수적인 조립 라인, 로봇 공학, 포장 산업에서 널리 사용됩니다. 또한, 소형 기기에서 소형화 센서에 대한 수요 증가도 이 부문의 채택을 촉진하고 있습니다. 또한, 다양한 환경에서 금속 및 비금속 물체를 감지할 수 있는 범용성도 시장 침투를 촉진하고 있습니다.
거리 조절이 가능한 제품 유형 부문은 예측 기간 동안 근접 센서 시장에서 가장 높은 CAGR을 나타낼 것으로 예측됩니다. 이러한 성장의 원동력은 유연성과 다양한 용도에 맞게 감지 범위를 미세 조정할 수 있는 능력으로 오감지를 줄이고 정확도를 향상시킵니다. 자동차, 패키징, 가전 등의 산업에서는 다양한 대상의 크기와 거리에 대응하기 위해 조정 가능한 센서가 점점 더 선호되고 있습니다. 스마트 제조 및 IoT 지원 시스템의 채택이 증가하고 있는 것도 수요를 촉진하고 있으며, 조정 가능한 센서는 역동적인 환경에서 더 높은 적응력을 발휘합니다.
중국은 강력한 제조거점과 산업 자동화의 급속한 도입으로 2030년까지 아시아태평양 근접 센서 시장에서 가장 큰 점유율을 차지할 것으로 예측됩니다. 중국의 자동차 생산 리더십은 전기차와 자율주행차에 대한 수요 증가와 맞물려 센서의 활용도를 크게 끌어올리고 있습니다. 중국의 가전제품 제조에서의 우위도 스마트폰, 웨어러블, 스마트홈 기기에서 근접 센서 통합에 대한 엄청난 기회를 창출하고 있습니다. 스마트 팩토리와 IoT 도입을 촉진하는 정부 이니셔티브는 이 지역의 주요 시장으로서 중국의 입지를 더욱 강화하고 있습니다.
세계의 근접 센서 시장에 대해 조사했으며, 기술별, 제품 유형별, 감지 범위별, 출력별, 최종 이용 산업별, 지역별 동향, 시장 진출기업 프로파일 등의 정보를 정리하여 전해드립니다.
목차
제1장 서론
제2장 조사 방법
제3장 주요 요약
제4장 프리미엄 인사이트
제5장 시장 개요
- 서론
- 시장 역학
- 고객의 비즈니스에 영향을 미치는 동향/혼란
- 가격 분석
- 밸류체인 분석
- 생태계 분석
- 투자 및 자금조달 시나리오
- 기술 분석
- 특허 분석
- 무역 분석
- 2025년-2026년 주요 컨퍼런스 및 이벤트
- 사례 연구 분석
- 규제 상황
- Porter의 Five Forces 분석
- 주요 이해관계자와 구입 기준
- AI/생성형 AI가 근접 센서 시장에 미치는 영향
- 2025년 미국 관세가 근접 센서 시장에 미치는 영향
제6장 근접 센서 시장(기술별)
- 서론
- 유도
- 용량성
- 자기
- 광전식/광학식
- 초음파
- 기타
제7장 근접 센서 시장(제품 유형별)
- 서론
- 고정 거리
- 조정 가능 거리
제8장 근접 센서 시장(감지 범위별)
- 서론
- 10 밀리미터 미만
- 10-20 밀리미터
- 21-40 밀리미터
- 40 밀리미터 이상
제9장 근접 센서 시장(출력별)
- 서론
- 아날로그
- 디지털
제10장 근접 센서 시장(최종 용도 업계별)
- 서론
- 항공우주 및 방위
- 자동차
- 의약품
- 제조
- 빌딩 자동화
- 가전
- 기타
제11장 근접 센서 시장(지역별)
- 서론
- 북미
- 북미의 거시경제 전망
- 미국
- 캐나다
- 멕시코
- 유럽
- 유럽의 거시경제 전망
- 영국
- 독일
- 이탈리아
- 프랑스
- 기타
- 아시아태평양
- 아시아태평양의 거시경제 전망
- 중국
- 일본
- 한국
- 인도
- 기타
- 기타 지역
- 기타 지역 거시경제 전망
- 중동
- 아프리카
- 남미
제12장 경쟁 구도
- 개요
- 주요 시장 진출기업의 전략/강점, 2021년-2025년
- 매출 분석, 2021년-2024년
- 시장 점유율 분석, 2024년
- 기업 평가와 재무 지표
- 브랜드/제품 비교
- 기업 평가 매트릭스 : 주요 시장 진출기업, 2024년
- 기업 평가 매트릭스 : 스타트업/중소기업, 2023년
- 경쟁 시나리오
제13장 기업 개요
- 주요 시장 진출기업
- OMRON CORPORATION
- KEYENCE CORPORATION
- PANASONIC CORPORATION
- SICK AG
- STMICROELECTRONICS
- ROCKWELL AUTOMATION
- DELTA ELECTRONICS, INC.
- HONEYWELL INTERNATIONAL INC.
- BROADCOM
- SCHNEIDER ELECTRIC
- ZF FRIEDRICHSHAFEN AG
- BALLUFF AUTOMATION INDIA PVT. LTD.
- PEPPERL+FUCHS SE
- BAUMER
- BANNER ENGINEERING CORP.
- 기타 기업
- AUTONICS CORPORATION
- IFM ELECTRONIC GMBH
- LEUZE ELECTRONIC PVT. LTD.
- HANS TRUCK GMBH & CO. KG
- FARGO CONTROLS INC.
- TMSS FRANCE
- MIGRATION CORP.
- INFINITE ELECTRONICS INTERNATIONAL, INC.
- SENSTRONIC
- HTMSENSORS
제14장 부록
LSH 25.10.17The proximity sensors market is projected to reach USD 5.97 billion by 2030 from USD 4.28 billion in 2025 at a CAGR of 6.9% during the forecast period.
| Scope of the Report | |
|---|---|
| Years Considered for the Study | 2021-2030 |
| Base Year | 2024 |
| Forecast Period | 2025-2030 |
| Units Considered | Value (USD Million) |
| Segments | By Technology, Product Type, Range, Output, End-Use Industry, and Region |
| Regions covered | North America, Europe, APAC, RoW |
One of the key factors driving the global proximity sensors market is the increasing adoption of automation and smart technologies across diverse industries. Proximity sensors are integral to enabling non-contact detection, safety, and process efficiency, making them highly valuable in automotive manufacturing, industrial robotics, and consumer electronics. The rapid expansion of advanced driver-assistance systems (ADAS) and electric vehicles is creating significant demand for these sensors to support functions like parking assistance and collision detection.
Additionally, the proliferation of IoT devices and smart home technologies is further boosting their integration into everyday applications. Their ability to operate reliably in harsh environments and advancements in sensing technologies, such as ultrasonic and photoelectric detection, are broadening their scope of use. Moreover, government initiatives promoting industrial automation and digitalization are providing additional momentum, accelerating overall market growth.
"10-20 mm sensing range to account for the second-largest market share in the proximity sensors market by 2030."
The 10-20 mm sensing range segment is projected to hold the second-largest market share in the proximity sensors market by 2030. This range offers an optimal balance between detection distance and precision, making it highly suitable for automotive, electronics, and industrial automation applications. It is widely used in assembly lines, robotics, and packaging industries where medium-range detection is essential. The growing demand for miniaturized sensors in compact devices also supports the adoption of this segment. Furthermore, its versatility in detecting metallic and non-metallic objects across diverse environments drives strong market penetration.
"Adjustable distance in the product type segment to register the highest CAGR in the proximity sensors market during the forecast period"
The adjustable distance product type segment is expected to register the highest CAGR in the proximity sensors market during the forecast period. This growth is driven by their flexibility and ability to fine-tune sensing ranges for diverse applications, reducing false detections and improving accuracy. Industries such as automotive, packaging, and consumer electronics increasingly prefer adjustable sensors to handle varying target sizes and distances. The rising adoption of smart manufacturing and IoT-enabled systems further supports demand, as adjustable sensors offer greater adaptability in dynamic environments.
"China to account for the largest share of the Asia Pacific proximity sensors market by 2030."
China is projected to account for the largest share of the Asia Pacific proximity sensors market by 2030, driven by its strong manufacturing base and rapid adoption of industrial automation. The country's leadership in automotive production, coupled with rising demand for electric and autonomous vehicles, is significantly boosting sensor usage. China's dominance in consumer electronics manufacturing also creates vast opportunities for proximity sensor integration in smartphones, wearables, and smart home devices. Government initiatives promoting smart factories and IoT adoption further reinforce China's position as the leading market in the region.
Extensive primary interviews were conducted with key industry experts in the proximity sensors market space to determine and verify the market size for various segments and subsegments gathered through secondary research. The breakup of primary participants for the report is shown below:
The study contains insights from various industry experts, from component suppliers to Tier 1 companies and OEMs. The breakup of the primaries is as follows:
- By Company Type: Tier 1 - 40%, Tier 2 - 35%, and Tier 3 - 25%
- By Designation: C-level Executives - 45%, Directors - 35%, and Others - 20%
- By Region: North America - 40%, Europe - 18%, Asia Pacific - 35%, and RoW - 7%
Notes: The three tiers of companies are based on their total revenue as of 2024: Tier 1 - equal to or more than USD 1,000 million; Tier 2 - between USD 500 million and USD 1,000 million; and Tier 3 - less than or equal to USD 500 million. Other designations include managers and academicians.
OMRON Corporation (Japan), KEYENCE CORPORATION (Japan), Panasonic Corporation (Japan), SICK AG (Germany), STMicroelectronics (Switzerland), Rockwell Automation (US), Delta Electronics, Inc. (Taiwan), Honeywell International Inc. (US), Nissha Co., Ltd (Japan), and Broadcom (US) are some key players in the proximity sensors market.
The study includes an in-depth competitive analysis of these key players in the proximity sensors market, with their company profiles, recent developments, and key market strategies.
Study Coverage:
This research report categorizes the proximity sensors market based on technology (inductive, capacitive, magnetic, photoelectric/optical, ultrasonic, other technologies), product type (fixed, adjustable), range (<10mm, 10-20mm, 21-40 mm, >40 mm), output (analog, digital), end user industry (aerospace & defense, automotive, pharmaceuticals, manufacturing, building automation, consumer electronics, other end user industries) and region (North America, Europe, Asia Pacific and RoW). The report describes the major drivers, restraints, challenges, and opportunities pertaining to the proximity sensors market and forecasts the same till 2030. The report also consists of leadership mapping and analysis of all companies in the proximity sensors ecosystem.
Key Benefits of Buying the Report
The report will help the market leaders/new entrants in this market by providing information on the closest approximations of the revenue numbers for the overall proximity sensors market and the subsegments. This report will help stakeholders understand the competitive landscape and gain more insights to position their businesses better and plan suitable go-to-market strategies. The report also helps stakeholders understand the market pulse and provides information on key market drivers, restraints, challenges, and opportunities.
The report provides insights into the following pointers:
- Analysis of key drivers (Increasing adoption of Industry 4.0 technologies, Growing preference for non-contact sensors, and Mounting demand for smart home devices)
consumer electronics, increasing adoption of ADAS and vehicle safety systems) restraints (Limited sensing range, High price sensitivity in emerging economies), opportunities (Surging adoption of industrial robots, increasing use in industrial applications due to technological advancements, growing trend of sensor miniaturization), and challenges (Availability of alternative sensing technologies, Cybersecurity risks associated with IoT sensors ), influencing the growth of the proximity sensors market
- Product Development/Innovation: Detailed insights into upcoming technologies, research and development activities, and the latest product and service launches in the proximity sensors market
- Market Development: Comprehensive information about lucrative markets - the report analyzes the proximity sensors market across varied regions.
- Market Diversification: Exhaustive information about new products and services, untapped geographies, recent developments, and investments in the proximity sensors market
- Competitive Assessment: In-depth assessment of market shares, growth strategies, and service offerings of leading players, such as OMRON Corporation (Japan), KEYENCE CORPORATION (Japan), Panasonic Corporation (Japan), SICK AG (Germany), and STMicroelectronics (Switzerland) in the proximity sensors market
TABLE OF CONTENTS
1 INTRODUCTION
- 1.1 STUDY OBJECTIVES
- 1.2 MARKET DEFINITION
- 1.3 STUDY SCOPE
- 1.3.1 MARKETS COVERED AND REGIONAL SCOPE
- 1.3.2 INCLUSIONS AND EXCLUSIONS
- 1.3.3 YEARS CONSIDERED
- 1.4 CURRENCY CONSIDERED
- 1.5 UNIT CONSIDERED
- 1.6 LIMITATIONS
- 1.7 STAKEHOLDERS
- 1.8 SUMMARY OF CHANGES
2 RESEARCH METHODOLOGY
- 2.1 RESEARCH DATA
- 2.1.1 SECONDARY DATA
- 2.1.1.1 List of key secondary sources
- 2.1.1.2 Key data from secondary sources
- 2.1.2 PRIMARY DATA
- 2.1.2.1 List of primary interview participants
- 2.1.2.2 Key data from primary sources
- 2.1.2.3 Key industry insights
- 2.1.2.4 Breakdown of primaries
- 2.1.3 SECONDARY AND PRIMARY RESEARCH
- 2.1.1 SECONDARY DATA
- 2.2 MARKET SIZE ESTIMATION METHODOLOGY
- 2.2.1 BOTTOM-UP APPROACH
- 2.2.1.1 Approach to arrive at market size using bottom-up analysis (demand side)
- 2.2.2 TOP-DOWN APPROACH
- 2.2.2.1 Approach to arrive at market size using top-down analysis (supply side)
- 2.2.1 BOTTOM-UP APPROACH
- 2.3 MARKET BREAKDOWN AND DATA TRIANGULATION
- 2.4 RESEARCH ASSUMPTIONS
- 2.5 RESEARCH LIMITATIONS
- 2.6 RISK ANALYSIS
3 EXECUTIVE SUMMARY
4 PREMIUM INSIGHTS
- 4.1 ATTRACTIVE OPPORTUNITIES FOR PLAYERS IN PROXIMITY SENSOR MARKET
- 4.2 PROXIMITY SENSOR MARKET, BY TECHNOLOGY
- 4.3 PROXIMITY SENSOR MARKET, BY RANGE
- 4.4 PROXIMITY SENSOR MARKET, BY OUTPUT
- 4.5 PROXIMITY SENSOR MARKET, BY END-USE INDUSTRY
- 4.6 PROXIMITY SENSOR MARKET, BY COUNTRY
5 MARKET OVERVIEW
- 5.1 INTRODUCTION
- 5.2 MARKET DYNAMICS
- 5.2.1 DRIVERS
- 5.2.1.1 Increasing adoption of Industry 4.0 technologies
- 5.2.1.2 Growing preference for non-contact sensors
- 5.2.1.3 Rising application in smart devices and consumer electronics
- 5.2.1.4 Increasing adoption of ADAS and vehicle safety systems
- 5.2.2 RESTRAINTS
- 5.2.2.1 Limited sensing range
- 5.2.2.2 High price sensitivity in emerging markets
- 5.2.3 OPPORTUNITIES
- 5.2.3.1 Growing adoption of industrial robots
- 5.2.3.2 Increasing application in medical devices, environmental monitoring, and smart cities
- 5.2.3.3 Advancements in sensor technology
- 5.2.4 CHALLENGES
- 5.2.4.1 Availability of alternative sensing technologies
- 5.2.4.2 Cybersecurity risks associated with IoT sensors
- 5.2.1 DRIVERS
- 5.3 TRENDS/DISRUPTIONS IMPACTING CUSTOMER BUSINESS
- 5.4 PRICING ANALYSIS
- 5.4.1 PRICING RANGE OF PROXIMITY SENSORS OFFERED BY KEY PLAYERS, BY TECHNOLOGY, 2024
- 5.4.2 AVERAGE SELLING PRICE TREND OF PROXIMITY SENSORS, BY REGION, 2021-2024
- 5.5 VALUE CHAIN ANALYSIS
- 5.6 ECOSYSTEM ANALYSIS
- 5.7 INVESTMENT AND FUNDING SCENARIO
- 5.8 TECHNOLOGY ANALYSIS
- 5.8.1 KEY TECHNOLOGIES
- 5.8.1.1 Microcontrollers
- 5.8.1.2 Miniaturized sensors
- 5.8.2 COMPLEMENTARY TECHNOLOGIES
- 5.8.2.1 Sensor fusions
- 5.8.2.2 MEMS
- 5.8.3 ADJACENT TECHNOLOGIES
- 5.8.3.1 AI and IoT
- 5.8.3.2 AR and VR
- 5.8.1 KEY TECHNOLOGIES
- 5.9 PATENT ANALYSIS
- 5.10 TRADE ANALYSIS
- 5.10.1 IMPORT SCENARIO (HS CODE 853690)
- 5.10.2 EXPORT SCENARIO (HS CODE 853690)
- 5.11 KEY CONFERENCES AND EVENTS, 2025-2026
- 5.12 CASE STUDY ANALYSIS
- 5.12.1 IPH INDUCTIVE PROXIMITY SENSORS IMPROVE RELIABILITY AND EFFICIENCY IN SEED PROCESSING FACILITY AUTOMATION
- 5.12.2 GPS PROXIMITY COLLARS CAPTURE PREDATOR-PREY INTERACTIONS, ADVANCING SCANDINAVIAN WILDLIFE RESEARCH
- 5.12.3 STRATEGIC SENSOR INTEGRATION STREAMLINES TRAVEL EXPERIENCE AND OPERATIONAL CONTROL FOR RV USERS
- 5.12.4 INDUCTIVE PROXIMITY SWITCHES ENSURE RELIABLE PIPE DETECTION AND SAFETY IN INDUSTRIAL MILL OPERATIONS
- 5.12.5 ADVANCED PROXIMITY SENSORS ENHANCE OPERATIONAL SAFETY AND EFFICIENCY IN ROBOTIC SYSTEMS
- 5.13 REGULATORY LANDSCAPE
- 5.13.1 REGULATORY BODIES, GOVERNMENT AGENCIES, AND OTHER ORGANIZATIONS
- 5.13.2 STANDARDS
- 5.14 PORTER'S FIVE FORCES ANALYSIS
- 5.14.1 THREAT OF NEW ENTRANTS
- 5.14.2 THREAT OF SUBSTITUTES
- 5.14.3 BARGAINING POWER OF SUPPLIERS
- 5.14.4 BARGAINING POWER OF BUYERS
- 5.14.5 INTENSITY OF COMPETITIVE RIVALRY
- 5.15 KEY STAKEHOLDERS AND BUYING CRITERIA
- 5.15.1 KEY STAKEHOLDERS IN BUYING PROCESS
- 5.15.2 BUYING CRITERIA
- 5.16 IMPACT OF AI/GEN AI ON PROXIMITY SENSOR MARKET
- 5.17 IMPACT OF 2025 US TARIFF ON PROXIMITY SENSOR MARKET
- 5.17.1 INTRODUCTION
- 5.17.2 KEY TARIFF RATES
- 5.17.3 PRICE IMPACT ANALYSIS
- 5.17.4 IMPACT ON COUNTRIES/REGIONS
- 5.17.4.1 US
- 5.17.4.2 Europe
- 5.17.4.3 Asia Pacific
- 5.17.5 IMPACT ON END-USE INDUSTRIES
6 PROXIMITY SENSOR MARKET, BY TECHNOLOGY
- 6.1 INTRODUCTION
- 6.2 INDUCTIVE
- 6.2.1 RISING INDUSTRIAL AUTOMATION TO FUEL MARKET GROWTH
- 6.3 CAPACITIVE
- 6.3.1 ABILITY TO DETECT NON-METALLIC TARGETS TO DRIVE MARKET
- 6.4 MAGNETIC
- 6.4.1 PROLIFERATION OF ELECTRIC AND AUTONOMOUS VEHICLES TO BOOST DEMAND
- 6.5 PHOTOELECTRIC/OPTICAL
- 6.5.1 ABILITY TO MAINTAIN HIGH-QUALITY STANDARDS IN DIVERSE INDUSTRIES TO FOSTER MARKET GROWTH
- 6.6 ULTRASONIC
- 6.6.1 GROWING DEMAND FOR AUTONOMOUS VEHICLES TO DRIVE MARKET
- 6.7 OTHER TECHNOLOGIES
7 PROXIMITY SENSOR MARKET, BY PRODUCT TYPE
- 7.1 INTRODUCTION
- 7.2 FIXED DISTANCE
- 7.2.1 RISING ADOPTION IN MANUFACTURING PLANTS TO BOOST SEGMENTAL GROWTH
- 7.3 ADJUSTABLE DISTANCE
- 7.3.1 INCREASING REGULATORY REQUIREMENTS FOR WORKPLACE AND VEHICLE SAFETY TO DRIVE MARKET
8 PROXIMITY SENSOR MARKET, BY RANGE
- 8.1 INTRODUCTION
- 8.2 <10 MM
- 8.2.1 TREND TOWARD MINIATURIZATION TO BOOST DEMAND
- 8.3 10-20 MM
- 8.3.1 GROWING DEMAND FOR AUTOMATION ACROSS SECTORS TO DRIVE MARKET
- 8.4 21-40 MM
- 8.4.1 EMPHASIS ON ROBOTICS TO FUEL MARKET GROWTH
- 8.5 >40 MM
- 8.5.1 DEPLOYMENT OF INDUSTRY 4.0 TECHNOLOGIES TO SUPPORT MARKET GROWTH
9 PROXIMITY SENSOR MARKET, BY OUTPUT
- 9.1 INTRODUCTION
- 9.2 ANALOG
- 9.2.1 ADVENT OF INDUSTRY 4.0 TECHNOLOGIES TO FUEL MARKET GROWTH
- 9.3 DIGITAL
- 9.3.1 PROLIFERATION OF IOT DEVICES TO SUPPORT MARKET GROWTH
10 PROXIMITY SENSOR MARKET, BY END-USE INDUSTRY
- 10.1 INTRODUCTION
- 10.2 AEROSPACE & DEFENSE
- 10.2.1 INCREASING FOCUS ON SAFETY AND AUTOMATION TO FUEL MARKET GROWTH
- 10.3 AUTOMOTIVE
- 10.3.1 GROWING EMPHASIS ON VEHICLE SAFETY TO BOOST DEMAND
- 10.4 PHARMACEUTICALS
- 10.4.1 ABILITY TO WITHSTAND HIGH-PRESSURE WATER TREATMENT TO SUPPORT MARKET GROWTH
- 10.5 MANUFACTURING
- 10.5.1 GROWING TREND OF INDUSTRY 4.0 AND SMART FACTORIES TO DRIVE MARKET
- 10.6 BUILDING AUTOMATION
- 10.6.1 INCREASING EMPHASIS ON SAFETY AND SECURITY IN MODERN BUILDINGS TO FOSTER MARKET GROWTH
- 10.7 CONSUMER ELECTRONICS
- 10.7.1 EXPANSION OF IOT-CONNECTED DEVICES TO FUEL MARKET GROWTH
- 10.8 OTHER END-USE INDUSTRIES
11 PROXIMITY SENSOR MARKET, BY REGION
- 11.1 INTRODUCTION
- 11.2 NORTH AMERICA
- 11.2.1 MACROECONOMIC OUTLOOK FOR NORTH AMERICA
- 11.2.2 US
- 11.2.2.1 Growing adoption to develop smart cities to foster market growth
- 11.2.3 CANADA
- 11.2.3.1 Increasing investments in industrial automation to boost demand
- 11.2.4 MEXICO
- 11.2.4.1 Thriving manufacturing sector to support market growth
- 11.3 EUROPE
- 11.3.1 MACROECONOMIC OUTLOOK FOR EUROPE
- 11.3.2 UK
- 11.3.2.1 Adoption of Industry 4.0 to drive market
- 11.3.3 GERMANY
- 11.3.3.1 Emphasis on transitioning to clean transportation to fuel market growth
- 11.3.4 ITALY
- 11.3.4.1 Shift toward electric mobility to foster market growth
- 11.3.5 FRANCE
- 11.3.5.1 Growth of cobots to boost demand
- 11.3.6 REST OF EUROPE
- 11.4 ASIA PACIFIC
- 11.4.1 MACROECONOMIC OUTLOOK FOR ASIA PACIFIC
- 11.4.2 CHINA
- 11.4.2.1 Rapid industrial automation to fuel market growth
- 11.4.3 JAPAN
- 11.4.3.1 Rising deployment of advanced technologies in manufacturing sector to bolster market growth
- 11.4.4 SOUTH KOREA
- 11.4.4.1 Rise of smart factories to boost demand
- 11.4.5 INDIA
- 11.4.5.1 Focus on enhancing urban living through technology-driven solutions to boost demand
- 11.4.6 REST OF ASIA PACIFIC
- 11.5 ROW
- 11.5.1 MACROECONOMIC OUTLOOK FOR ROW
- 11.5.2 MIDDLE EAST
- 11.5.2.1 GCC
- 11.5.2.1.1 Investments in modernizing transportation infrastructure to foster market growth
- 11.5.2.2 Rest of Middle East
- 11.5.2.1 GCC
- 11.5.3 AFRICA
- 11.5.3.1 Growing adoption of automation technologies to improve productivity to drive market
- 11.5.4 SOUTH AMERICA
- 11.5.4.1 Increasing emphasis on improving urban management to fuel market growth
12 COMPETITIVE LANDSCAPE
- 12.1 OVERVIEW
- 12.2 KEY PLAYER STRATEGIES/RIGHT TO WIN, 2021-2025
- 12.3 REVENUE ANALYSIS, 2021-2024
- 12.4 MARKET SHARE ANALYSIS, 2024
- 12.5 COMPANY VALUATION AND FINANCIAL METRICS
- 12.6 BRAND/PRODUCT COMPARISON
- 12.7 COMPANY EVALUATION MATRIX: KEY PLAYERS, 2024
- 12.7.1 STARS
- 12.7.2 EMERGING LEADERS
- 12.7.3 PERVASIVE PLAYERS
- 12.7.4 PARTICIPANTS
- 12.7.5 COMPANY FOOTPRINT: KEY PLAYERS, 2024
- 12.7.5.1 Company footprint
- 12.7.5.2 Region footprint
- 12.7.5.3 Technology footprint
- 12.7.5.4 Product type footprint
- 12.7.5.5 Range footprint
- 12.7.5.6 Output footprint
- 12.7.5.7 End-use industry footprint
- 12.8 COMPANY EVALUATION MATRIX: STARTUPS/SMES, 2023
- 12.8.1 PROGRESSIVE COMPANIES
- 12.8.2 RESPONSIVE COMPANIES
- 12.8.3 DYNAMIC COMPANIES
- 12.8.4 STARTING BLOCKS
- 12.8.5 COMPETITIVE BENCHMARKING: STARTUPS/SMES, 2024
- 12.8.5.1 Detailed list of key startups/SMEs
- 12.8.5.2 Competitive benchmarking of key startups/SMEs
- 12.9 COMPETITIVE SCENARIOS
- 12.9.1 PRODUCT LAUNCHES
- 12.9.2 DEALS
13 COMPANY PROFILES
- 13.1 KEY PLAYERS
- 13.1.1 OMRON CORPORATION
- 13.1.1.1 Business overview
- 13.1.1.2 Products/Solutions/Services offered
- 13.1.1.3 Recent developments
- 13.1.1.3.1 Deals
- 13.1.1.4 MnM view
- 13.1.1.4.1 Key strengths/Right to win
- 13.1.1.4.2 Strategic choices
- 13.1.1.4.3 Weaknesses/Competitive threats
- 13.1.2 KEYENCE CORPORATION
- 13.1.2.1 Business overview
- 13.1.2.2 Products/Solutions/Services offered
- 13.1.2.3 MnM view
- 13.1.2.3.1 Key strengths/Right to win
- 13.1.2.3.2 Strategic choices
- 13.1.2.3.3 Weaknesses/Competitive threats
- 13.1.3 PANASONIC CORPORATION
- 13.1.3.1 Business overview
- 13.1.3.2 Products/Solutions/Services offered
- 13.1.3.3 Recent developments
- 13.1.3.3.1 Deals
- 13.1.3.4 MnM view
- 13.1.3.4.1 Key strengths/Right to win
- 13.1.3.4.2 Strategic choices
- 13.1.3.4.3 Weaknesses/Competitive threats
- 13.1.4 SICK AG
- 13.1.4.1 Business overview
- 13.1.4.2 Products/Solutions/Services offered
- 13.1.4.3 Recent developments
- 13.1.4.3.1 Product launches
- 13.1.4.3.2 Deals
- 13.1.4.4 MnM view
- 13.1.4.4.1 Key strengths/Right to win
- 13.1.4.4.2 Strategic choices
- 13.1.4.4.3 Weaknesses/Competitive threats
- 13.1.5 STMICROELECTRONICS
- 13.1.5.1 Business overview
- 13.1.5.2 Products/Solutions/Services offered
- 13.1.5.3 Recent developments
- 13.1.5.3.1 Deals
- 13.1.5.3.2 Other developments
- 13.1.5.4 MnM view
- 13.1.5.4.1 Key strengths/Right to win
- 13.1.5.4.2 Strategic choices
- 13.1.5.4.3 Weaknesses/Competitive threats
- 13.1.6 ROCKWELL AUTOMATION
- 13.1.6.1 Business overview
- 13.1.6.2 Products/Solutions/Services offered
- 13.1.6.3 Recent developments
- 13.1.6.3.1 Deals
- 13.1.6.3.2 Expansions
- 13.1.7 DELTA ELECTRONICS, INC.
- 13.1.7.1 Business overview
- 13.1.7.2 Products/Solutions/Services offered
- 13.1.7.3 Recent developments
- 13.1.7.3.1 Developments
- 13.1.8 HONEYWELL INTERNATIONAL INC.
- 13.1.8.1 Business overview
- 13.1.8.2 Products/Solutions/Services offered
- 13.1.8.3 Recent developments
- 13.1.8.3.1 Deals
- 13.1.8.3.2 Other developments
- 13.1.9 BROADCOM
- 13.1.9.1 Business overview
- 13.1.9.2 Products/Solutions/Services offered
- 13.1.9.3 Recent developments
- 13.1.9.3.1 Deals
- 13.1.9.3.2 Other developments
- 13.1.10 SCHNEIDER ELECTRIC
- 13.1.10.1 Business overview
- 13.1.10.2 Products/Solutions/Services offered
- 13.1.10.3 Recent developments
- 13.1.10.3.1 Deals
- 13.1.10.3.2 Other developments
- 13.1.11 ZF FRIEDRICHSHAFEN AG
- 13.1.11.1 Business overview
- 13.1.11.2 Products/Solutions/Services offered
- 13.1.11.3 Recent developments
- 13.1.11.3.1 Deals
- 13.1.12 BALLUFF AUTOMATION INDIA PVT. LTD.
- 13.1.12.1 Business overview
- 13.1.12.2 Products/Solutions/Services offered
- 13.1.13 PEPPERL+FUCHS SE
- 13.1.13.1 Business overview
- 13.1.13.2 Products/Solutions/Services offered
- 13.1.13.3 Recent developments
- 13.1.13.3.1 Deals
- 13.1.13.3.2 Other developments
- 13.1.14 BAUMER
- 13.1.14.1 Business overview
- 13.1.14.2 Products/Solutions/Services offered
- 13.1.14.3 Recent developments
- 13.1.14.3.1 Other developments
- 13.1.15 BANNER ENGINEERING CORP.
- 13.1.15.1 Business overview
- 13.1.15.2 Products/Solutions/Services offered
- 13.1.1 OMRON CORPORATION
- 13.2 OTHER PLAYERS
- 13.2.1 AUTONICS CORPORATION
- 13.2.2 IFM ELECTRONIC GMBH
- 13.2.3 LEUZE ELECTRONIC PVT. LTD.
- 13.2.4 HANS TRUCK GMBH & CO. KG
- 13.2.5 FARGO CONTROLS INC.
- 13.2.6 TMSS FRANCE
- 13.2.7 MIGRATION CORP.
- 13.2.8 INFINITE ELECTRONICS INTERNATIONAL, INC.
- 13.2.9 SENSTRONIC
- 13.2.10 HTMSENSORS
14 APPENDIX
- 14.1 INSIGHTS FROM INDUSTRY EXPERTS
- 14.2 DISCUSSION GUIDE
- 14.3 KNOWLEDGESTORE: MARKETSANDMARKETS' SUBSCRIPTION PORTAL
- 14.4 CUSTOMIZATION OPTIONS
- 14.5 RELATED REPORTS
- 14.6 AUTHOR DETAILS
