


|
시장보고서
상품코드
1883933
화학 농도 모니터 시장 예측(-2030년) : 매체별, 제품별, 기술별, 최종 용도 산업별, 지역별Chemical Concentration Monitor Market by Medium, Product, Technology, End use Industry and Region - Global Forecast to 2030 |
||||||
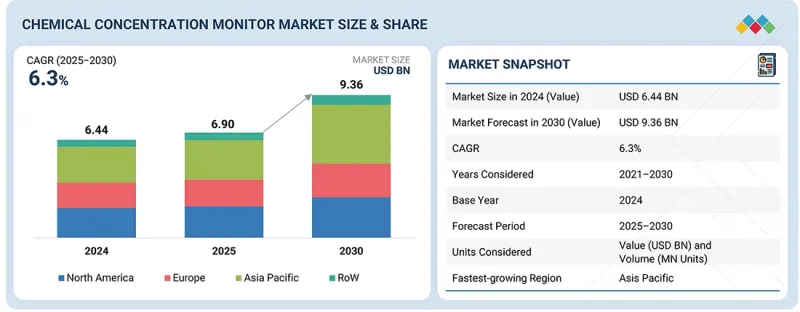
세계의 화학 농도 모니터 시장 규모는 2025년에 69억 달러로, 2030년까지 93억 6,000만 달러에 달할 것으로 예측되며, 예측 기간에 CAGR로 6.3%의 성장이 전망되고 있습니다.
시장은 다양한 산업 공정에서 실시간 지속적이고 정밀한 농도 측정에 대한 수요 증가로 인해 강력한 성장세를 보이고 있습니다. 공정 자동화의 확산, 강화되는 환경 규제, 품질관리 및 안전 규정 준수에 대한 관심이 높아지면서 첨단 모니터링 시스템에 대한 수요가 더욱 증가하고 있습니다. 광학, 초음파, 굴절률 측정식 센싱 기술의 발전과 더불어 IoT에 대응하는 연결성 및 AI 분석 기능의 통합으로 정확성, 신뢰성, 처리 효율성이 향상되고 있습니다.
| 조사 범위 | |
|---|---|
| 조사 대상 기간 | 2021-2030년 |
| 기준연도 | 2024년 |
| 예측 기간 | 2025-2030년 |
| 단위 | 10억 달러 |
| 부문 | 유형, 매체, 제공, 제품, 기술, 최종 용도 산업, 지역 |
| 대상 지역 | 북미, 유럽, 아시아태평양, 기타 지역 |
또한 화학 제조, 제약, 반도체, 식품 및 음료, 물 및 폐수 처리 등의 분야에서 급속한 산업 확장은 큰 성장 기회를 창출하고 있습니다. 이러한 시스템은 수작업으로 인한 테스트 오류를 줄이고, 자원 활용을 최적화하며, 전 세계 현대식 자동화 시설에서 환경적 및 운영적 지속가능성을 보장하는 데 매우 중요한 역할을 합니다.

"유형별로는 고정형 모니터가 예측 기간 중 가장 큰 시장 점유율을 차지할 것으로 보입니다. "
고정식 모니터는 높은 정확도, 안정성, 지속적인 모니터링 능력으로 인해 예측 기간 중 화학 농도 모니터 시장에서 가장 큰 점유율을 차지할 것으로 예측됩니다. 이러한 시스템은 실시간 분석 및 품질관리를 목적으로 산업 생산 라인, 연구소, 공정 공장에 널리 통합되어 있습니다. 휴대용 장치와 달리 고정식 모니터는 장기간에 걸쳐 자동화된 중단 없는 데이터 측정을 제공합니다. 이는 프로세스 최적화 및 규제 준수에 필수적입니다. 첨단 공정 자동화 시스템, IoT 연결성, 디지털 제어 플랫폼과의 호환성이 운영 효율성을 더욱 향상시킵니다. 화학, 반도체, 제약 등의 분야에서 채용이 확대되면서 시장에서의 우위를 점하고 있습니다.
"매체별로는 가스 부문이 예측 기간 중 가장 높은 CAGR을 나타낼 것으로 보입니다. "
반도체, 석유화학, 제약, 환경 모니터링 등의 산업에서 정밀 가스 농도 분석에 대한 수요가 증가함에 따라 가스 부문이 예측 기간 중 화학 농도 모니터 시장에서 가장 높은 CAGR을 나타낼 것으로 예측됩니다. 대기질 관리, 배출가스 저감, 공정 안전에 대한 관심이 높아지면서 첨단 가스 농도 모니터링 기술의 채택이 촉진되고 있습니다. 또한 비접촉식 광학/적외선 분석기 개발 및 IoT 지원 원격 모니터링과 실시간 데이터 분석의 결합으로 이러한 장치의 정확성과 신뢰성이 향상되고 있습니다. 이러한 혁신을 통해 산업용 가스 용도 전반에 걸쳐 효율적인 누출 감지, 규제 준수 및 운영 관리를 개선할 수 있습니다.
"아시아태평양이 예측 기간 중 가장 높은 CAGR을 나타낼 것입니다. "
아시아태평양은 중국, 일본, 한국, 인도 등의 국가에서 급속한 산업화, 제조업의 대폭적인 확대, 공정 자동화의 확산으로 인해 예측 기간 중 화학 농도 모니터 시장에서 가장 높은 CAGR을 나타낼 것으로 예측됩니다. 이 지역의 화학, 반도체, 제약, 수처리 산업이 지속적으로 성장하면서 정밀하고 지속적인 농도 모니터링 솔루션에 대한 수요가 증가하고 있습니다. 또한 환경 규제 준수를 촉진하는 정부 규제와 스마트 제조 및 품질관리 시스템에 대한 투자 증가가 기술 채택을 촉진하고 있습니다. 공정 효율성, 안전, 지속가능성에 대한 인식이 높아지면서 이 지역 시장 성장을 더욱 지원하고 있습니다.
세계의 화학 농도 모니터 시장에 대해 조사분석했으며, 주요 촉진요인과 억제요인, 경쟁 구도, 향후 동향 등의 정보를 제공하고 있습니다.
자주 묻는 질문
목차
제1장 서론
제2장 조사 방법
제3장 개요
제4장 중요 인사이트
- 화학 농도 모니터 시장에서의 매력적인 기회
- 화학 농도 모니터 시장 : 유형별
- 화학 농도 모니터 시장 : 매체별
- 화학 농도 모니터 시장 : 기술별
- 화학 농도 모니터 시장 : 최종 용도 산업별
- 화학 농도 모니터 시장 : 지역별
- 화학 농도 모니터 시장 : 국가별
제5장 시장 개요
- 서론
- 시장 역학
- 촉진요인
- 억제요인
- 기회
- 과제
- 고객 비즈니스에 영향을 미치는 동향/혼란
- 가격결정 분석
- 주요 기업이 제공하는 화학 농도 모니터의 평균 판매 가격 : 제품별(2024년)
- 화학 농도 모니터의 평균 판매 가격 동향 : 지역별(2021-2024년)
- 밸류체인 분석
- 에코시스템 분석
- 기술 분석
- 주요 기술
- 보완 기술
- 인접 기술
- 특허 분석
- 무역 분석
- 수입 시나리오(HS 코드 9027)
- 수출 시나리오(HS 코드 9027)
- 주요 컨퍼런스와 이벤트(2025-2026년)
- 사례 연구
- 투자와 자금조달 시나리오
- 관세와 규제 상황
- 관세 분석(HS 코드 9027)
- 규제기관, 정부기관, 기타 조직
- 주요 규제
- Porter's Five Forces 분석
- 주요 이해관계자와 구입 기준
- 화학 농도 모니터 시장에 대한 AI/생성형 AI의 영향
- 화학 농도 모니터 시장에 대한 2025년 미국 관세의 영향
- 서론
- 주요 관세율
- 가격의 영향 분석
- 국가/지역에 대한 영향
- 최종 용도 산업에 대한 영향
제6장 화학 농도 모니터 시장 : 유형별
- 서론
- 휴대식
- 고정식
제7장 화학 농도 모니터 시장 : 매체별
- 서론
- 액체
- 가스
제8장 화학 농도 모니터 시장 : 제품별
- 서론
- 인라인 굴절계
- 광섬유 농도 모니터
- 비접촉 광학 모니터
- IR/NIR 분석기
- 암페로메트릭 이온 센서
- 기타 제품
제9장 화학 농도 모니터 시장 : 기술별
- 서론
- 초음파
- 광학
- IR·NIR 분광법
- 자외 가시 분광법
- 라만 분광법
- 전도성
- 전기화학
- 기타 기술
제10장 화학 농도 모니터 시장 : 제공별
- 서론
- 하드웨어
- 센서·프로브
- 송신기
- 컨트롤러
- 디스플레이·인터페이스 유닛
- 기타 하드웨어
- 소프트웨어
- 서비스
제11장 화학 농도 모니터 시장 : 최종 용도 산업별
- 서론
- 반도체·전자기기 제조
- 식품 및 음료
- 의료·의약품
- 수처리·폐수 처리
- 기타 최종 용도 산업
제12장 화학 농도 모니터 시장 : 지역별
- 서론
- 북미
- 북미의 거시경제 전망
- 미국
- 캐나다
- 멕시코
- 유럽
- 유럽의 거시경제 전망
- 영국
- 독일
- 프랑스
- 이탈리아
- 스페인
- 폴란드
- 벨기에
- 네덜란드
- 북유럽
- 기타 유럽
- 아시아태평양
- 아시아태평양의 거시경제 전망
- 중국
- 일본
- 호주
- 인도
- 한국
- 동남아시아
- 기타 아시아태평양
- 기타 지역
- 기타 지역의 거시경제 전망
- 중동
- 아프리카
- 남미
제13장 경쟁 구도
- 개요
- 주요 참여 기업의 전략/강점(2021-2025년)
- 시장 점유율 분석(2024년)
- 매출 분석(2020-2024년)
- 기업의 평가와 재무 지표
- 브랜드/제품 비교
- 기업 평가 매트릭스 : 주요 기업(2024년)
- 기업 평가 매트릭스 : 스타트업/중소기업(2024년)
- 경쟁 시나리오
제14장 기업 개요
- 서론
- 주요 기업
- THERMO FISHER SCIENTIFIC INC.
- EMERSON ELECTRIC CO.
- ABB
- ENDRESS+HAUSER GROUP SERVICES AG
- VERALTO
- AMETEK.INC.
- METTLER TOLEDO
- YOKOGAWA ELECTRIC CORPORATION
- XYLEM
- HORIBA GROUP
- 기타 기업
- AGILENT TECHNOLOGIES, INC.
- TELEDYNE TECHNOLOGIES INCORPORATED
- HONEYWELL INTERNATIONAL INC.
- FUJI ELECTRIC CO., LTD.
- SIEMENS
- ENTEGRIS
- KURABO INDUSTRIES LTD.
- ANTON PAAR GMBH
- CI SEMI
- VAISALA
- SHIMADZU CORPORATION
- SENSOTECH GMBH
- SERVOMEX
- PIMACS
- PERKINELMER
제15장 부록
KSA 25.12.17The global chemical concentration monitor market was valued at USD 6.90 billion in 2025 and is projected to reach USD 9.36 billion by 2030, growing at a CAGR of 6.3% during the forecast period. The market is experiencing strong growth driven by the growing demand for real-time, continuous, and precise concentration measurement across various industrial processes. The rising adoption of process automation, stringent environmental regulations, and the increasing emphasis on quality control and safety compliance are further driving demand for advanced monitoring systems. Technological advancements in optical, ultrasonic, and refractometric sensing, along with the integration of IoT-enabled connectivity and AI-based analytics, are enhancing accuracy, reliability, and process efficiency.
| Scope of the Report | |
|---|---|
| Years Considered for the Study | 2021-2030 |
| Base Year | 2024 |
| Forecast Period | 2025-2030 |
| Units Considered | Value (USD Billion) |
| Segments | By Type, Medium, Offering, Product, Technology End use Industry and Region |
| Regions covered | North America, Europe, APAC, RoW |
Additionally, rapid industrial expansion in sectors such as chemical manufacturing, pharmaceuticals, semiconductors, food & beverages, and water & wastewater treatment is creating significant growth opportunities. These systems play a vital role in reducing manual testing errors, optimizing resource utilization, and ensuring environmental and operational sustainability across modern automated facilities worldwide.
"Based on type, stationary monitors to account for largest market share throughout forecast period"
Stationary monitors are expected to account for the largest share of the chemical concentration monitor market during the forecast period due to their high precision, stability, and continuous monitoring capabilities. These systems are widely integrated into industrial production lines, laboratories, and process plants for real-time analysis and quality control. Unlike portable units, stationary monitors offer long-term, automated, and uninterrupted data measurement, which is essential for process optimization and regulatory compliance. Their compatibility with advanced process automation systems, IoT connectivity, and digital control platforms further enhances operational efficiency. Growing adoption in sectors such as chemicals, semiconductors, and pharmaceuticals drives their market dominance.
"Based on medium, gas segment projected to register highest CAGR during forecast period"
The gas segment is projected to register the highest CAGR in the chemical concentration monitor market during the forecast period, driven by the increasing demand for precise gas concentration analysis in industries such as semiconductors, petrochemicals, pharmaceuticals, and environmental monitoring. The growing emphasis on air quality control, emission reduction, and process safety is driving the adoption of advanced gas concentration monitoring technologies. Moreover, the development of non-contact optical and infrared analyzers, coupled with IoT-enabled remote monitoring and real-time data analytics, is enhancing the accuracy and reliability of these devices. These innovations are enabling efficient leak detection, regulatory compliance, and improved operational control across industrial gas applications.
" Asia Pacific to register highest CAGR during forecast period"
The Asia Pacific region is projected to register the highest CAGR in the chemical concentration monitor market during the forecast period, driven by rapid industrialization, substantial manufacturing expansion, and increasing adoption of process automation across countries such as China, Japan, South Korea, and India. The region's growing chemicals, semiconductors, pharmaceuticals, and water treatment industries are driving demand for precise and continuous concentration monitoring solutions. Additionally, government regulations promoting environmental compliance, combined with increasing investments in smart manufacturing and quality control systems, are driving the adoption of technology. Increasing awareness of process efficiency, safety, and sustainability further supports market growth in the region.
Extensive primary interviews were conducted with key industry experts in the chemical concentration monitor market to determine and verify the market size for various segments and subsegments gathered through secondary research. The breakdown of primary participants for the report is shown below.
The study draws insights from a range of industry experts, including component suppliers, tier 1 companies, and OEMs. The break-up of the primaries is as follows:
- By Company Type - Tier 1 - 55%, Tier 2 - 25%, and Tier 3 - 20%
- By Designation - Directors - 50%, Managers - 30%, and Others - 20%
- By Region - North America - 45%, Europe - 30%, Asia Pasific - 20%, and RoW - 5%
The chemical concentration monitor market is dominated by a few globally established players, such as Thermo Fisher Scientific Inc. (US), Emerson Electric Co. (US), ABB Ltd. (Switzerland), Endress+Hauser Group Services AG (Switzerland), Veralto (US), Mettler-Toledo International Inc. (US), AMETEK, Inc. (US), Yokogawa Electric Corporation (Japan), Xylem (US), and HORIBA Group (Japan).
The study includes an in-depth competitive analysis of these key players in the chemical concentration monitor market, with their company profiles, recent developments, and key market strategies.
Study Coverage:
The report segments the chemical concentration monitor market and forecasts its size, by type (portable monitors, stationary monitors), medium (liquid, gas), product (inline refractometer, fiber-optic concentration monitor, non-contact optical monitor, NIR/IR analyzer, amperometric ion sensor, other products), technology (ultrasonic, optical, conductivity, electrochemical, other technologies), end-use industry (semiconductor & electronics, food & beverages, healthcare & pharmaceuticals, water & wastewater treatment, other applications), offering (hardware, software, services). It also discusses the market's drivers, restraints, opportunities, and challenges. It gives a detailed view of the market across four main regions (North America, Europe, Asia Pacific, and RoW). The report includes a value chain analysis of the key players and their competitive analysis in the chemical concentration monitor ecosystem.
Key Benefits of Buying the Report:
- Analysis of key drivers (Growing demand for real-time chemical analysis in industries such as healthcare & pharmaceuticals, stringent food & beverage safety standards), restraints (high upfront cost of chemical concentration monitors), opportunities (expansion into emerging markets and decentralized treatment systems, rising adoption by high-precision industries such as batteries, semiconductors, and electronics), challenges (integration challenges with legacy infrastructure, standardization and interoperability issues).
- Product development/innovation: Detailed insights on upcoming technologies, research and development activities, and new product launches in the chemical concentration monitor market
- Market development: Comprehensive information about lucrative markets - the report analyzes the chemical concentration monitor market across varied regions
- Market diversification: Exhaustive information about new products, untapped geographies, recent developments, and investments in the chemical concentration monitor market
- Competitive assessment: In-depth assessment of market shares and growth strategies of leading players, such as Thermo Fisher Scientific Inc. (US), Emerson Electric Co. (US), ABB Ltd. (Switzerland), Endress+Hauser Group Services AG (Switzerland), Veralto (US), Mettler-Toledo International Inc. (US), AMETEK, Inc. (US), Yokogawa Electric Corporation (Japan), Xylem (US), and HORIBA Group (Japan).
TABLE OF CONTENTS
1 INTRODUCTION
- 1.1 STUDY OBJECTIVES
- 1.2 MARKET DEFINITION
- 1.3 STUDY SCOPE
- 1.3.1 MARKETS COVERED AND REGIONAL SCOPE
- 1.3.2 INCLUSIONS AND EXCLUSIONS
- 1.3.3 YEARS CONSIDERED
- 1.4 CURRENCY CONSIDERED
- 1.5 UNIT CONSIDERED
- 1.6 STAKEHOLDERS
2 RESEARCH METHODOLOGY
- 2.1 RESEARCH DATA
- 2.1.1 SECONDARY DATA
- 2.1.1.1 List of key secondary sources
- 2.1.1.2 Key data from secondary sources
- 2.1.2 PRIMARY DATA
- 2.1.2.1 List of primary interview participants
- 2.1.2.2 Breakdown of primary interviews
- 2.1.2.3 Key data from primary sources
- 2.1.2.4 Key industry insights
- 2.1.3 SECONDARY AND PRIMARY RESEARCH
- 2.1.1 SECONDARY DATA
- 2.2 MARKET SIZE ESTIMATION
- 2.2.1 BOTTOM-UP APPROACH
- 2.2.1.1 Approach to arrive at market size using bottom-up analysis (demand side)
- 2.2.2 TOP-DOWN APPROACH
- 2.2.2.1 Approach to arrive at market size using top-down analysis (supply side)
- 2.2.1 BOTTOM-UP APPROACH
- 2.3 FACTOR ANALYSIS
- 2.3.1 DEMAND-SIDE ANALYSIS
- 2.3.2 SUPPLY-SIDE ANALYSIS
- 2.4 MARKET BREAKDOWN AND DATA TRIANGULATION
- 2.5 RESEARCH ASSUMPTIONS
- 2.6 RESEARCH LIMITATIONS
- 2.7 RISK ANALYSIS
3 EXECUTIVE SUMMARY
4 PREMIUM INSIGHTS
- 4.1 ATTRACTIVE OPPORTUNITIES FOR PLAYERS IN CHEMICAL CONCENTRATION MONITOR MARKET
- 4.2 CHEMICAL CONCENTRATION MONITOR MARKET, BY TYPE
- 4.3 CHEMICAL CONCENTRATION MONITOR MARKET, BY MEDIUM
- 4.4 CHEMICAL CONCENTRATION MONITOR MARKET, BY TECHNOLOGY
- 4.5 CHEMICAL CONCENTRATION MONITOR MARKET, BY END-USE INDUSTRY
- 4.6 CHEMICAL CONCENTRATION MONITOR MARKET, BY REGION
- 4.7 CHEMICAL CONCENTRATION MONITOR MARKET, BY COUNTRY
5 MARKET OVERVIEW
- 5.1 INTRODUCTION
- 5.2 MARKET DYNAMICS
- 5.2.1 DRIVERS
- 5.2.1.1 Increasing need for real-time chemical analysis in industries
- 5.2.1.2 Rising implementation of stringent food and beverage safety standards
- 5.2.2 RESTRAINTS
- 5.2.2.1 High upfront and maintenance costs
- 5.2.3 OPPORTUNITIES
- 5.2.3.1 Rapid urbanization and water scarcity concerns
- 5.2.3.2 Emphasis on accurate chemical control in semiconductors, batteries, and electronics
- 5.2.4 CHALLENGES
- 5.2.4.1 Issues related to integration with legacy infrastructure
- 5.2.4.2 Standardization and interoperability challenges
- 5.2.1 DRIVERS
- 5.3 TRENDS/DISRUPTIONS IMPACTING CUSTOMER BUSINESS
- 5.4 PRICING ANALYSIS
- 5.4.1 AVERAGE SELLING PRICE OF CHEMICAL CONCENTRATION MONITORS OFFERED BY KEY PLAYERS, BY PRODUCT, 2024
- 5.4.2 AVERAGE SELLING PRICE TREND OF CHEMICAL CONCENTRATION MONITORS, BY REGION, 2021-2024
- 5.5 VALUE CHAIN ANALYSIS
- 5.6 ECOSYSTEM ANALYSIS
- 5.7 TECHNOLOGY ANALYSIS
- 5.7.1 KEY TECHNOLOGIES
- 5.7.1.1 Ultrasonic
- 5.7.1.2 Near-infrared (NIR) spectroscopy
- 5.7.2 COMPLEMENTARY TECHNOLOGIES
- 5.7.2.1 Internet of Things (IoT)
- 5.7.2.2 Edge computing
- 5.7.3 ADJACENT TECHNOLOGIES
- 5.7.3.1 Conductivity measurement systems
- 5.7.1 KEY TECHNOLOGIES
- 5.8 PATENT ANALYSIS
- 5.9 TRADE ANALYSIS
- 5.9.1 IMPORT SCENARIO (HS CODE 9027)
- 5.9.2 EXPORT SCENARIO (HS CODE 9027)
- 5.10 KEY CONFERENCES AND EVENTS, 2025-2026
- 5.11 CASE STUDIES
- 5.11.1 SEMICONDUCTOR MANUFACTURER UNITES WITH PROCESS AUTOMATION VENDOR TO PRECISELY CONTROL CHEMICAL CONCENTRATIONS
- 5.11.2 NESTLE IMPLEMENTS INLINE MONITORING SYSTEM TO MAINTAIN CHEMICAL CONCENTRATION LEVELS
- 5.11.3 SWISS PHARMACEUTICAL PRODUCER PARTNERS WITH INSTRUMENTATION VENDOR TO IMPLEMENT CHEMICAL CONCENTRATION MONITORING SYSTEM
- 5.11.4 JAPANESE PROCESS AUTOMATION COMPANIES USE CCM TO MAINTAIN CHEMICAL CONCENTRATION LEVELS IN CRITICAL MANUFACTURING PROCESSES
- 5.12 INVESTMENT AND FUNDING SCENARIO
- 5.13 TARIFF AND REGULATORY LANDSCAPE
- 5.13.1 TARIFF ANALYSIS (HS CODE 9027)
- 5.13.2 REGULATORY BODIES, GOVERNMENT AGENCIES, AND OTHER ORGANIZATIONS
- 5.13.3 KEY REGULATIONS
- 5.14 PORTER'S FIVE FORCES ANALYSIS
- 5.14.1 THREATS OF NEW ENTRANTS
- 5.14.2 THREAT OF SUBSTITUTES
- 5.14.3 BARGAINING POWER OF SUPPLIERS
- 5.14.4 BARGAINING POWER OF BUYERS
- 5.14.5 INTENSITY OF COMPETITIVE RIVALRY
- 5.15 KEY STAKEHOLDERS AND BUYING CRITERIA
- 5.15.1 KEY STAKEHOLDER IN BUYING PROCESS
- 5.15.2 BUYING CRITERIA
- 5.16 IMPACT OF AI/GEN AI ON CHEMICAL CONCENTRATION MONITOR MARKET
- 5.17 IMPACT OF 2025 US TARIFF ON CHEMICAL CONCENTRATION MONITOR MARKET
- 5.17.1 INTRODUCTION
- 5.17.2 KEY TARIFF RATES
- 5.17.3 PRICE IMPACT ANALYSIS
- 5.17.4 IMPACT ON COUNTRIES/REGIONS
- 5.17.4.1 US
- 5.17.4.2 Europe
- 5.17.4.3 Asia pacific
- 5.17.5 IMPACT ON END-USE INDUSTRIES
6 CHEMICAL CONCENTRATION MONITOR MARKET, BY TYPE
- 6.1 INTRODUCTION
- 6.2 PORTABLE 93 6.2.1 FLEXIBILITY AND ABILITY TO PROVIDE RAPID AND ACCURATE CHEMICAL ANALYSIS TO FUEL SEGMENTAL GROWTH
- 6.3 STATIONARY
- 6.3.1 USE TO DELIVER CONTINUOUS, UNATTENDED OPERATION WITH MINIMAL MANUAL INTERVENTION TO BOOST SEGMENTAL GROWTH
7 CHEMICAL CONCENTRATION MONITOR MARKET, BY MEDIUM
- 7.1 INTRODUCTION
- 7.2 LIQUID
- 7.2.1 HIGH EMPHASIS ON PROCESS AUTOMATION, PRODUCT QUALITY, AND ENVIRONMENTAL COMPLIANCE TO SPUR DEMAND
- 7.3 GAS
- 7.3.1 RISING IMPLEMENTATION OF STRINGENT ENVIRONMENTAL REGULATIONS TO ACCELERATE SEGMENTAL GROWTH
8 CHEMICAL CONCENTRATION MONITOR MARKET, BY PRODUCT
- 8.1 INTRODUCTION
- 8.2 INLINE REFRACTOMETERS
- 8.2.1 USE TO ACHIEVE CONTINUOUS, HIGH ACCURACY MONITORING OF LIQUID CONCENTRATION AND COMPOSITION TO SPUR DEMAND
- 8.3 FIBER-OPTIC CONCENTRATION MONITORS
- 8.3.1 IMMUNITY TO ELECTROMAGNETIC INTERFERENCE AND SUITABILITY FOR REMOTE AND HAZARDOUS ENVIRONMENTS TO FUEL SEGMENTAL GROWTH
- 8.4 NON-CONTACT OPTICAL MONITOR
- 8.4.1 ABILITY TO PERFORM PRECISE MEASUREMENT WITHOUT DIRECT PHYSICAL CONTACT TO BOLSTER SEGMENTAL GROWTH
- 8.5 IR/NIR ANALYZERS
- 8.5.1 RELIANCE ON DATA-DRIVEN MANUFACTURING AND CONTINUOUS PROCESS VERIFICATION TO CONTRIBUTE TO SEGMENTAL GROWTH
- 8.6 AMPEROMETRIC ION SENSORS
- 8.6.1 INCORPORATION OF AI-BASED DATA ANALYTICS AND DIGITAL TWINS IN ION SENSING PLATFORMS TO AUGMENT SEGMENTAL GROWTH
- 8.7 OTHER PRODUCTS
9 CHEMICAL CONCENTRATION MONITOR MARKET, BY TECHNOLOGY
- 9.1 INTRODUCTION
- 9.2 ULTRASONIC
- 9.2.1 NON-CONTACT MEASUREMENT CAPABILITY AND HIGH RELIABILITY TO BOLSTER SEGMENTAL GROWTH
- 9.3 OPTICAL
- 9.3.1 IR & NIR SPECTROSCOPY
- 9.3.1.1 Ability to deliver precise, rapid, and non-destructive measurement of chemical compositions to fuel segmental growth
- 9.3.2 UV-VISIBLE SPECTROSCOPY
- 9.3.2.1 Use to ensure regulatory compliance to accelerate segmental growth
- 9.3.3 RAMAN SPECTROSCOPY
- 9.3.3.1 Ability to analyze complex multi-component mixtures and detect low-level contaminants to drive market
- 9.3.1 IR & NIR SPECTROSCOPY
- 9.4 CONDUCTIVITY
- 9.4.1 SIMPLICITY, RELIABILITY, AND COST-EFFECTIVENESS IN MEASURING ION CONCENTRATION TO CONTRIBUTE TO SEGMENTAL GROWTH
- 9.5 ELECTROCHEMICAL
- 9.5.1 SUITABILITY FOR DETECTING SPECIFIC IONS OR COMPOUNDS IN LIQUID AND GASEOUS MEDIA TO BOOST SEGMENTAL GROWTH
- 9.6 OTHER TECHNOLOGIES
10 CHEMICAL CONCENTRATION MONITOR MARKET, BY OFFERING
- 10.1 INTRODUCTION
- 10.2 HARDWARE
- 10.2.1 SENSORS & PROBES
- 10.2.1.1 Ability to withstand harsh industrial environments to contribute to segmental growth
- 10.2.2 TRANSMITTERS
- 10.2.2.1 Focus on smart process control and digitalization in industries to drive market
- 10.2.3 CONTROLLERS
- 10.2.3.1 Adoption of Industry 4.0 and smart factory initiatives to accelerate segmental growth
- 10.2.4 DISPLAY & INTERFACE UNITS
- 10.2.4.1 Prioritization of digital transformation and workforce efficiency to bolster segmental growth
- 10.2.5 OTHER HARDWARE
- 10.2.1 SENSORS & PROBES
- 10.3 SOFTWARE
- 10.3.1 SHIFT TOWARD INDUSTRY 4.0 AND DIGITAL TRANSFORMATION TO ACCELERATE SEGMENTAL GROWTH
- 10.4 SERVICES
- 10.4.1 ADOPTION OF COMPLEX, AUTOMATED, AND NETWORKED MONITORING INFRASTRUCTURE TO FOSTER SEGMENTAL GROWTH
11 CHEMICAL CONCENTRATION MONITOR MARKET, BY END-USE INDUSTRY
- 11.1 INTRODUCTION
- 11.2 SEMICONDUCTOR & ELECTRONICS MANUFACTURING
- 11.2.1 DEMAND FOR ADVANCED, CONTAMINATION-FREE MONITORING TO CONTRIBUTE TO SEGMENTAL GROWTH
- 11.3 FOOD & BEVERAGES
- 11.3.1 FOCUS ON ENSURING CONSISTENT PRODUCT QUALITY, PROCESS EFFICIENCY, AND REGULATORY COMPLIANCE TO DRIVE MARKET
- 11.4 HEALTHCARE & PHARMACEUTICALS
- 11.4.1 EMPHASIS ON REGULATORY COMPLIANCE, DRUG QUALITY, AND PROCESS ACCURACY TO BOOST SEGMENTAL GROWTH
- 11.5 WATER & WASTEWATER TREATMENT
- 11.5.1 GLOBAL CONCERNS AROUND WATER SCARCITY AND ENVIRONMENTAL PROTECTION TO BOLSTER SEGMENTAL GROWTH
- 11.6 OTHER END-USE INDUSTRIES
12 CHEMICAL CONCENTRATION MONITOR MARKET, BY REGION
- 12.1 INTRODUCTION
- 12.2 NORTH AMERICA
- 12.2.1 MACROECONOMIC OUTLOOK FOR NORTH AMERICA
- 12.2.2 US
- 12.2.2.1 Mounting demand for advanced process control and monitoring solutions to drive market
- 12.2.3 CANADA
- 12.2.3.1 Strong focus on process optimization and quality management to expedite market growth
- 12.2.4 MEXICO
- 12.2.4.1 Rising enforcement of standards for effluent and potable water quality maintenance to boost market growth
- 12.3 EUROPE
- 12.3.1 MACROECONOMIC OUTLOOK FOR EUROPE
- 12.3.2 UK
- 12.3.2.1 High emphasis on water quality compliance and industrial digitalization to bolster market growth
- 12.3.3 GERMANY
- 12.3.3.1 Implementation of strict effluent compliance norms to accelerate market growth
- 12.3.4 FRANCE
- 12.3.4.1 Enforcement of strict national and EU water quality regulations to boost market growth
- 12.3.5 ITALY
- 12.3.5.1 Strong focus on drought resilience and wastewater reuse to contribute to market growth
- 12.3.6 SPAIN
- 12.3.6.1 Rapid modernization of industrial infrastructure to fuel market growth
- 12.3.7 POLAND
- 12.3.7.1 Focus on strengthening environmental compliance and modernization of industrial infrastructure to drive market
- 12.3.8 BELGIUM
- 12.3.8.1 Emphasis on wastewater reuse and decentralized treatment systems to expedite market growth
- 12.3.9 NETHERLANDS
- 12.3.9.1 Implementation of circular water management policies to accelerate market growth
- 12.3.10 NORDICS
- 12.3.10.1 Focus on conforming to stringent environmental protection policies to augment market growth
- 12.3.11 REST OF EUROPE
- 12.4 ASIA PACIFIC
- 12.4.1 MACROECONOMIC OUTLOOK FOR ASIA PACIFIC
- 12.4.2 CHINA
- 12.4.2.1 Rapid industrial expansion and tightening environmental regulations to fuel market growth
- 12.4.3 JAPAN
- 12.4.3.1 Strong commitment to industrial automation and environmental protection to accelerate market growth
- 12.4.4 AUSTRALIA
- 12.4.4.1 Expansion of water infrastructure, mining operations, and sustainability initiatives to drive market
- 12.4.5 INDIA
- 12.4.5.1 Increasing investment in water and wastewater treatment and industrial automation to support market growth
- 12.4.6 SOUTH KOREA
- 12.4.6.1 Strong regulatory framework for water quality and technological innovation to contribute to market growth
- 12.4.7 SOUTHEAST ASIA
- 12.4.7.1 Rapid industrialization and expanding water and wastewater infrastructure to bolster market growth
- 12.4.8 REST OF ASIA PACIFIC
- 12.5 ROW
- 12.5.1 MACROECONOMIC OUTLOOK FOR ROW
- 12.5.2 MIDDLE EAST
- 12.5.2.1 Bahrain
- 12.5.2.1.1 Growing emphasis on environmental protection and industrial modernization to accelerate market growth
- 12.5.2.2 Kuwait
- 12.5.2.2.1 Strong focus on sustainable water management to contribute to market growth
- 12.5.2.3 Oman
- 12.5.2.3.1 Mounting demand for precise and automated concentration monitoring systems to fuel market growth
- 12.5.2.4 Qatar
- 12.5.2.4.1 Heavy reliance on desalination for freshwater supply to drive market
- 12.5.2.5 Saudi Arabia
- 12.5.2.5.1 Growing emphasis on environmental sustainability to augment market growth
- 12.5.2.6 UAE
- 12.5.2.6.1 Strong focus on meeting net-zero strategy to expedite market growth
- 12.5.2.7 Rest of Middle East
- 12.5.2.1 Bahrain
- 12.5.3 AFRICA
- 12.5.3.1 South Africa
- 12.5.3.1.1 Increasing investment in water and wastewater treatment to bolster market growth
- 12.5.3.2 Rest of Africa
- 12.5.3.1 South Africa
- 12.5.4 SOUTH AMERICA
- 12.5.4.1 Brazil
- 12.5.4.1.1 Expanding industrial base and strict environmental regulations to expedite market growth
- 12.5.4.2 Argentina
- 12.5.4.2.1 Aging infrastructure and recurring water quality challenges to support market growth
- 12.5.4.3 Rest of South America
- 12.5.4.1 Brazil
13 COMPETITIVE LANDSCAPE
- 13.1 OVERVIEW
- 13.2 KEY PLAYER STRATEGIES/RIGHT TO WIN, 2021-2025
- 13.3 MARKET SHARE ANALYSIS, 2024
- 13.4 REVENUE ANALYSIS, 2020-2024
- 13.5 COMPANY VALUATION AND FINANCIAL METRICS
- 13.6 BRAND/PRODUCT COMPARISON
- 13.7 COMPANY EVALUATION MATRIX: KEY PLAYERS, 2024
- 13.7.1 STARS
- 13.7.2 EMERGING LEADERS
- 13.7.3 PERVASIVE PLAYERS
- 13.7.4 PARTICIPANTS
- 13.7.5 COMPANY FOOTPRINT: KEY PLAYERS, 2024
- 13.7.5.1 Company footprint
- 13.7.5.2 Region footprint
- 13.7.5.3 Type footprint
- 13.7.5.4 Medium footprint
- 13.7.5.5 Product footprint
- 13.7.5.6 Technology footprint
- 13.7.5.7 End-use industry footprint
- 13.8 COMPANY EVALUATION MATRIX: STARTUPS/SMES, 2024
- 13.8.1 PROGRESSIVE COMPANIES
- 13.8.2 RESPONSIVE COMPANIES
- 13.8.3 DYNAMIC COMPANIES
- 13.8.4 STARTING BLOCKS
- 13.8.5 COMPETITIVE BENCHMARKING: STARTUPS/SMES, 2024
- 13.8.5.1 Detailed list of key startups/SMEs
- 13.8.5.2 Competitive benchmarking of startups/SMEs
- 13.9 COMPETITIVE SCENARIO
- 13.9.1 PRODUCT LAUNCHES
- 13.9.2 DEALS
14 COMPANY PROFILES
- 14.1 INTRODUCTION
- 14.2 KEY PLAYERS
- 14.2.1 THERMO FISHER SCIENTIFIC INC.
- 14.2.1.1 Business overview
- 14.2.1.2 Products/Solutions/Services offered
- 14.2.1.3 MnM view
- 14.2.1.3.1 Key strengths/Right to win
- 14.2.1.3.2 Strategic choices
- 14.2.1.3.3 Weaknesses/Competitive threats
- 14.2.2 EMERSON ELECTRIC CO.
- 14.2.2.1 Business overview
- 14.2.2.2 Products/Solutions/Services offered
- 14.2.2.3 MnM view
- 14.2.2.3.1 Key strengths/Right to win
- 14.2.2.3.2 Strategic choices
- 14.2.2.3.3 Weaknesses/Competitive threats
- 14.2.3 ABB
- 14.2.3.1 Business overview
- 14.2.3.2 Products/Solutions/Services offered
- 14.2.3.3 Recent developments
- 14.2.3.3.1 Product launches
- 14.2.3.3.2 Deals
- 14.2.3.4 MnM view
- 14.2.3.4.1 Key strengths/Right to win
- 14.2.3.4.2 Strategic choices
- 14.2.3.4.3 Weaknesses/Competitive threats
- 14.2.4 ENDRESS+HAUSER GROUP SERVICES AG
- 14.2.4.1 Business overview
- 14.2.4.2 Products/Solutions/Services offered
- 14.2.4.3 Recent developments
- 14.2.4.3.1 Product launches
- 14.2.4.3.2 Deals
- 14.2.4.4 MnM view
- 14.2.4.4.1 Key strengths/Right to win
- 14.2.4.4.2 Strategic choices
- 14.2.4.4.3 Weaknesses/Competitive threats
- 14.2.5 VERALTO
- 14.2.5.1 Business overview
- 14.2.5.2 Products/Solutions/Services offered
- 14.2.5.3 MnM view
- 14.2.5.3.1 Key strengths/Right to win
- 14.2.5.3.2 Strategic choices
- 14.2.5.3.3 Weaknesses/Competitive threats
- 14.2.6 AMETEK.INC.
- 14.2.6.1 Business overview
- 14.2.6.2 Products/Solutions/Services offered
- 14.2.6.3 Recent developments
- 14.2.6.3.1 Product launches
- 14.2.6.3.2 Deals
- 14.2.7 METTLER TOLEDO
- 14.2.7.1 Business overview
- 14.2.7.2 Products/Solutions/Services offered
- 14.2.8 YOKOGAWA ELECTRIC CORPORATION
- 14.2.8.1 Business overview
- 14.2.8.2 Products/Solutions/Services offered
- 14.2.8.3 Recent developments
- 14.2.8.3.1 Product launches
- 14.2.9 XYLEM
- 14.2.9.1 Business overview
- 14.2.9.2 Products/Solutions/Services offered
- 14.2.9.3 Recent developments
- 14.2.9.3.1 Product launches
- 14.2.9.3.2 Deals
- 14.2.10 HORIBA GROUP
- 14.2.10.1 Business overview
- 14.2.10.2 Products/Solutions/Services offered
- 14.2.10.3 Recent developments
- 14.2.10.3.1 Product launches
- 14.2.10.3.2 Deals
- 14.2.1 THERMO FISHER SCIENTIFIC INC.
- 14.3 OTHER PLAYERS
- 14.3.1 AGILENT TECHNOLOGIES, INC.
- 14.3.2 TELEDYNE TECHNOLOGIES INCORPORATED
- 14.3.3 HONEYWELL INTERNATIONAL INC.
- 14.3.4 FUJI ELECTRIC CO., LTD.
- 14.3.5 SIEMENS
- 14.3.6 ENTEGRIS
- 14.3.7 KURABO INDUSTRIES LTD.
- 14.3.8 ANTON PAAR GMBH
- 14.3.9 CI SEMI
- 14.3.10 VAISALA
- 14.3.11 SHIMADZU CORPORATION
- 14.3.12 SENSOTECH GMBH
- 14.3.13 SERVOMEX
- 14.3.14 PIMACS
- 14.3.15 PERKINELMER
15 APPENDIX
- 15.1 INSIGHTS FROM INDUSTRY EXPERTS
- 15.2 KNOWLEDGESTORE: MARKETSANDMARKETS' SUBSCRIPTION PORTAL
- 15.3 CUSTOMIZATION OPTIONS
- 15.4 RELATED REPORTS
- 15.5 AUTHOR DETAILS
