|
시장보고서
상품코드
1993563
디지털 사이니지 시장 : 오퍼링별, 제품 유형별, 디스플레이 사이즈별, 설치 장소별, 용도별, 최종 용도별, 기업 규모별, 지역별 - 세계 예측(-2030년)Digital Signage Market by Product (Video Walls, Kiosks, Billboards, Menu Boards, System-on-chip Displays), Resolution (4K, 8K, FHD, HD), Installation Location (Indoor, Outdoor), Software, Display Size, Application, and Region - Global Forecast to 2030 |
||||||
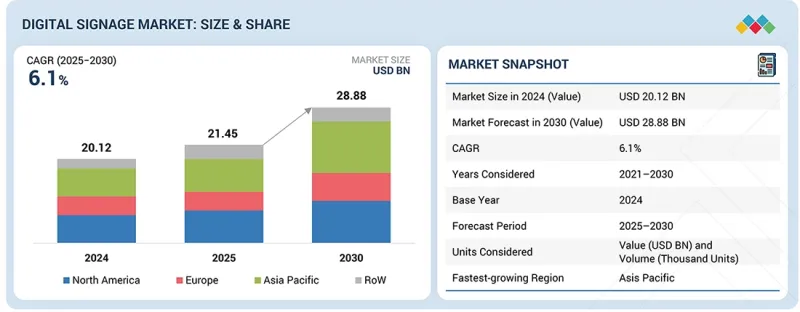
세계의 디지털 사이니지 시장 규모는 2025년 214억 5,000만 달러에서 2030년까지 288억 8,000만 달러로 확대할 것으로 예측되고 있으며, 예측 기간 중 CAGR은 6.1%에 달합니다.
이러한 성장은 상업시설의 디지털 사이니지 도입 확대, 인프라 관련 용도의 디지털 디스플레이 수요 증가, 고해상도 4K 및 8K 스크린에 대한 수요 증가에 힘입어 성장세를 보이고 있습니다.
| 조사 범위 | |
|---|---|
| 조사 대상 기간 | 2021-2030년 |
| 기준연도 | 2024년 |
| 예측 기간 | 2025-2030년 |
| 대상 단위 | 금액(10억 달러) |
| 부문 | 오퍼링별, 제품 유형별, 디스플레이 사이즈별, 설치 장소별, 용도별, 최종 용도별, 기업 규모별, 지역별 |
| 대상 지역 | 북미, 유럽, 아시아태평양, 기타 지역 |
디스플레이 기술의 지속적인 발전은 전체 디지털 사이니지 솔루션의 성능, 효율성 및 화질 향상을 통해 시장 성장에 기여하고 있습니다.
실시간 컨텐츠 전송에 대한 요구, 기술 발전, 지능형 사이니지 솔루션의 채택 확대는 디지털 사이니지 소프트웨어 솔루션에 대한 수요를 촉진하고 있습니다. 소프트웨어 업그레이드와 이에 따른 라이선스 구매도 이 부문의 성장을 가속할 것으로 예측됩니다. 동시에 인터랙티브 디지털 사이니지에 대한 수요가 지속적으로 증가하고 있으며, 터치 기능, 제스처 인식 및 기타 인터랙티브 기능을 지원하는 고급 소프트웨어에 대한 요구가 증가하고 있습니다. 이러한 기능들은 사용자 참여를 향상시키고, 보다 몰입감 있는 시청 경험을 제공합니다. 최신 디지털 사이니지 소프트웨어에는 일반적으로 사용자가 컨텐츠를 쉽게 스케줄링, 관리, 업데이트할 수 있는 강력한 컨텐츠 관리 시스템(CMS)이 탑재되어 있습니다. 이러한 유연성은 디스플레이에 표시되는 내용을 시의적절하고 관련성 있고 매력적으로 유지하는 데 필수적입니다. 또한 분석 툴이 내장된 소프트웨어 플랫폼을 통해 기업은 디지털 사이니지 캠페인의 성과를 모니터링하고, 시청자 참여를 평가하고, 컨텐츠의 효과를 측정할 수 있습니다.
52인치 이상 디스플레이 부문은 2025-2030년 가장 빠르게 성장할 것으로 예측됩니다. 이러한 성장은 디지털 사이니지 디스플레이 기술의 지속적인 혁신과 더불어 실내외를 막론하고 대형 스크린에 대한 수요 증가가 원동력이 되고 있습니다. 아시아태평양의 급속한 도시화도 다양한 분야에서 야외 디지털 사이니지의 사용 확대를 촉진하고 있습니다. 또한 소매업 및 인프라 분야에서 대형 OLED 디스플레이의 사용 증가는 전체 시장 확대에 중요한 역할을 하고 있습니다.
아시아태평양 시장은 예측 기간 중 가장 높은 성장률을 나타낼 것으로 예측됩니다. 이는 주로 상업, 공공, 인프라, 산업 부문에서 사물인터넷(IoT), 디지털 전환(DX) 등의 기술 도입에 의해 주도되고 있습니다. 이러한 요인들로 인해 이 지역에서는 디지털 사이니지에 대한 수요가 증가하고 있습니다. 또한 도시의 발전, 소비자의 구매력 향상, 사용자 경험 향상에 대한 수요 증가는 다양한 상업 및 공공 분야의 응용 분야에서 아시아태평양의 디지털 사이니지 시장을 촉진할 것으로 예측됩니다.
이 보고서는 디지털 사이니지 시장을 세분화하여 제공 제품, 디스플레이 크기, 제품 유형, 설치 장소, 용도, 기업 규모, 지역(북미, 유럽, 아시아태평양, 기타 지역) 별로 시장 규모(금액 기준)를 예측했습니다. 또한 디지털 사이니지 시장 시장 성장 촉진요인 및 과제에 대해서도 종합적으로 분석했습니다. 또한 이러한 시장의 양적 측면뿐만 아니라 질적 측면도 함께 다루고 있습니다.
이 보고서는 시장 리더와 신규 시장 진출기업에게 전체 디지털 사이니지 시장 및 관련 부문의 매출에 대한 가장 정확한 정보를 제공합니다. 이 보고서는 이해관계자들이 경쟁 구도를 이해하고, 시장에서의 입지를 강화하며, 효과적인 시장 진출 전략을 수립하기 위한 귀중한 인사이트을 얻을 수 있도록 돕습니다. 또한 주요 시장 성장 촉진요인, 억제요인, 기회, 과제에 대한 정보를 제공함으로써 이해관계자들이 시장 동향을 파악하는 데 도움이 될 것입니다.
이 보고서에서는 다음과 같은 사항에 대한 인사이트을 제공
- 주요 촉진요인(상업용 디지털 사이니지 도입 확대, 인프라 용도의 디지털 사이니지 수요 증가, 4K 및 8K 해상도 디스플레이에 대한 수요 증가, 디스플레이 기술의 지속적인 발전), 제약 요인(디지털 사이니지의 높은 비용), 기회 요인(신흥 국가 인프라의 급속한 발전, 공공시설의 디지털 사이니지 보급 확대, 산업 분야의 디지털 사이니지 도입 확대), 도전 요인(디지털 사이니지와 관련된 보안 문제) 공공시설에서의 디지털 사이니지의 인기, 산업 분야에서의 디지털 사이니지 도입 확대), 과제(디지털 사이니지 관련 보안 문제, 디지털 사이니지 솔루션 설치에 따른 인프라 관련 문제, 전력 소비 및 환경에 미치는 영향)를 분석하여 디지털 사이니지 시장의 성장에 영향을 미치는 요인을 분석하여 디지털 사이니지 시장의 성장에 영향을 미치는 요인을 파악했습니다.
- 제품 개발/혁신 : 디지털 사이니지 시장의 기술 동향, 연구개발 활동 및 신제품 출시, 사업 확장, 계약, 제휴, 인수 등의 전략에 대한 심층적인 인사이트을 제공합니다.
- 시장 개발: 수익성 높은 시장에 대한 종합적인 정보 - 이 보고서는 다양한 지역의 디지털 사이니지 시장을 분석합니다.
- 시장 다각화 : 디지털 사이니지 시장의 신제품, 미개발 지역, 최근 동향 및 투자에 대한 종합적인 정보
- 경쟁사 분석 : 삼성(한국), LG전자(한국), 샤프(일본), LEYARD(중국), 소니그룹(일본) 등 주요 기업 시장 점유율, 성장전략, 제품 라인업에 대한 상세한 평가.
자주 묻는 질문
목차
제1장 서론
제2장 개요
제3장 주요 인사이트
제4장 시장 개요
제5장 업계 동향
제6장 기술 진보, AI에 의한 영향, 특허, 혁신, 향후 응용
제7장 규제 상황
제8장 고객 상황과 구매 행동
제9장 디지털 사이니지 시장(오퍼링별)
제10장 디지털 사이니지 시장(제품 유형별)
제11장 디지털 사이니지 시장(디스플레이 사이즈별)
제12장 디지털 사이니지 시장(설치 장소별)
제13장 디지털 사이니지 시장(용도별)
제14장 디지털 사이니지 시장(용도별)
제15장 디지털 사이니지 시장(기업 규모별)
제16장 디지털 사이니지 시장(지역별)
제17장 경쟁 구도
제18장 기업 개요
제19장 조사 방법
제20장 부록
KSA 26.04.16The global digital signage market is forecast to expand from USD 21.45 billion in 2025 to USD 28.88 billion by 2030, reflecting a CAGR of 6.1% over the forecast period. This growth is driven by the growing adoption of digital signage across commercial spaces, increasing requirements for digital displays in infrastructure-related applications, and increasing demand for high-resolution 4K and 8K screens.
| Scope of the Report | |
|---|---|
| Years Considered for the Study | 2021-2030 |
| Base Year | 2024 |
| Forecast Period | 2025-2030 |
| Units Considered | Value (USD Billion) |
| Segments | By Offering, Product Type, Application and Region |
| Regions covered | North America, Europe, APAC, RoW |
Ongoing advancements in display technologies are also contributing to market growth by improving performance, efficiency, and visual quality across digital signage solutions.

"By offering, the software segment is expected to register the highest CAGR between 2025 and 2030."
The requirements for real-time content delivery, advances in technology, as well as the increasing adoption of intelligent signage solutions, are fostering demand for digital signage software solutions. Upgrades for the software and subsequent licensed purchases are also anticipated to boost the growth of this segment. At the same time, demand for interactive digital signage continues to rise, creating a need for advanced software that supports touch functionality, gesture recognition, and other interactive features. These capabilities improve user engagement and deliver a more immersive viewing experience. Modern digital signage software typically includes robust content management systems (CMS) that make it easy for users to schedule, manage, and update content. This flexibility is essential for keeping displays timely, relevant, and engaging. In addition, software platforms with built-in analytics tools allow businesses to monitor the performance of their digital signage campaigns, assess audience engagement, and measure content effectiveness.
"Based on display size, the above 52 inches segment is projected to account for the largest market share in 2030."
The segment for displays above 52 inches is expected to see the fastest growth between 2025 and 2030. This growth is being driven by ongoing innovation in digital signage display technologies, along with an increasing preference for large screens in both indoor and outdoor settings. Rapid urbanization across the Asia Pacific region is also driving increased usage of outdoor digital signage for a wide range of applications. In addition, the increasing use of large-format OLED displays in retail and infrastructure settings is playing a key role in supporting overall market expansion.
"The Asia Pacific region is projected to exhibit the highest CAGR from 2025 to 2030."
The Asia Pacific market is predicted to register the highest growth rate during the forecast period. This is primarily driven by the adoption of technologies such as the internet of things (IoT) and digital transformation initiatives in the commercial, institutional, infrastructure, and industrial segments. These factors have led to a high demand for digital signage in the region. Further, the growth of cities, rising consumer purchasing power, increased need for enhanced user experience are anticipated to drive the digital signage market in Asia Pacific across various commercial and institutional applications.
The break-up of the profile of primary participants in the digital signage market-
- By Company Type: Tier 1 - 30%, Tier 2 - 50%, Tier 3 - 20%
- By Designation: C-level Executives - 25%, Directors - 35%, Others - 40%
- By Region: North America - 35%, Europe - 30%, Asia Pacific - 25% , RoW - 10%
Note: Other designations include sales, marketing, and product managers. The three tiers of the companies are based on their total revenues as of 2024: Tier 1: >USD 1 billion, Tier 2: USD 500 million-1 billion, and Tier 3: USD 500 million.
The major companies in the digital signage market are SAMSUNG (South Korea), LG Electronics (South Korea), Sharp Corporation (Japan), LEYARD (China), and Sony Group Corporation (Japan) among others.
Research Coverage
The report segments the digital signage market and forecasts its size, by value, based on offering, display size, product type, installation location, application, enterprise size, and region (North America, Europe, Asia Pacific, and the Rest of the World). The report also comprehensively reviews market drivers, restraints, opportunities, and challenges in the digital signage market. The report also covers qualitative aspects in addition to the quantitative aspects of these markets.
Reasons to Buy the Report:
The report will help the market leaders/new entrants with information on the closest approximate revenues for the overall digital signage market and related segments. This report will help stakeholders understand the competitive landscape and gain valuable insights to strengthen their market position and develop effective go-to-market strategies. The report also helps stakeholders understand the pulse of the market, providing them with information on key market drivers, restraints, opportunities, and challenges.
The report provides insights into the following pointers:
- Analysis of key drivers (growing adoption of digital signage in commercial applications, rising demand of demand signage in infrastructural applications, increasing demand for 4K and 8K resolution displays, and continuous technological advancements in displays), restraints (high cost of digital signage), opportunities (burgeoning infrastructure advancements in emerging economies, increasing popularity of digital signage in institutional settings, and rising adoption of digital signage in industrial sector), and challenges (security concerns linked with digital signage, infrastructure-related issues associated with installation of digital signage solutions, and power consumption and environmental impact) influencing the growth of the digital signage market.
- Product Development/Innovation: Detailed insights on upcoming technologies, research & development activities, and strategies such as new product launches, expansions, contracts, partnerships, and acquisitions in the digital signage market
- Market Development: Comprehensive information about lucrative markets-the report analyses the digital signage market across varied regions
- Market Diversification: Exhaustive information about new products, untapped geographies, recent developments, and investments in the digital signage market
- Competitive Assessment: In-depth assessment of market shares, growth strategies and product offerings of leading players like SAMSUNG (South Korea), LG Electronics (South Korea), Sharp Corporation (Japan), LEYARD (China), and Sony Group Corporation (Japan), among others.
TABLE OF CONTENTS
1 INTRODUCTION
- 1.1 STUDY OBJECTIVES
- 1.2 MARKET DEFINITION
- 1.3 STUDY SCOPE
- 1.3.1 MARKETS COVERED AND REGIONAL SCOPE
- 1.3.2 INCLUSIONS AND EXCLUSIONS
- 1.3.3 YEARS CONSIDERED
- 1.3.4 CURRENCY CONSIDERED
- 1.3.5 UNIT CONSIDERED
- 1.4 STAKEHOLDERS
2 EXECUTIVE SUMMARY
- 2.1 KEY INSIGHTS AND MARKET HIGHLIGHTS
- 2.2 KEY MARKET PARTICIPANTS: MAPPING OF STRATEGIC DEVELOPMENTS
- 2.3 DISRUPTIVE TRENDS SHAPING DIGITAL SIGNAGE MARKET
- 2.4 HIGH-GROWTH SEGMENTS
- 2.5 SNAPSHOT: GLOBAL MARKET SIZE, GROWTH RATE, AND FORECAST
3 PREMIUM INSIGHTS
- 3.1 ATTRACTIVE OPPORTUNITIES FOR PLAYERS IN DIGITAL SIGNAGE MARKET
- 3.2 DIGITAL SIGNAGE MARKET, BY OFFERING
- 3.3 DIGITAL SIGNAGE MARKET, BY PRODUCT TYPE
- 3.4 DIGITAL SIGNAGE MARKET, BY INSTALLATION LOCATION
- 3.5 DIGITAL SIGNAGE MARKET, BY END USE
- 3.6 DIGITAL SIGNAGE MARKET, BY REGION
- 3.7 DIGITAL SIGNAGE MARKET, BY COUNTRY
4 MARKET OVERVIEW
- 4.1 INTRODUCTION
- 4.2 MARKET DYNAMICS
- 4.2.1 DRIVERS
- 4.2.1.1 Growing adoption of digital signage solutions in commercial applications
- 4.2.1.2 Rising deployment of digital signage solutions in infrastructural applications
- 4.2.1.3 Surging demand for 4K and 8K resolution displays
- 4.2.1.4 Increasing focus on launching technologically advanced displays
- 4.2.2 RESTRAINTS
- 4.2.2.1 High ownership cost of digital signage solutions
- 4.2.3 OPPORTUNITIES
- 4.2.3.1 Ongoing infrastructure improvements in emerging economies
- 4.2.3.2 Rising adoption of digital signage in industrial sector
- 4.2.4 CHALLENGES
- 4.2.4.1 Security concerns associated with digital signage solutions
- 4.2.4.2 Infrastructure-related issues with digital signage installation
- 4.2.1 DRIVERS
- 4.3 UNMET NEEDS AND WHITE SPACES
- 4.4 INTERCONNECTED MARKETS AND CROSS-SECTOR OPPORTUNITIES
- 4.5 STRATEGIC MOVES BY TIER 1/2/3/ PLAYERS
5 INDUSTRY TRENDS
- 5.1 INTRODUCTION
- 5.2 PORTER'S FIVE FORCES ANALYSIS
- 5.2.1 THREAT OF NEW ENTRANTS
- 5.2.2 THREAT OF SUBSTITUTES
- 5.2.3 BARGAINING POWER OF SUPPLIERS
- 5.2.4 BARGAINING POWER OF BUYERS
- 5.2.5 INTENSITY OF COMPETITIVE RIVALRY
- 5.3 MACROECONOMIC INDICATORS
- 5.3.1 INTRODUCTION
- 5.3.2 GDP TRENDS AND FORECAST
- 5.3.3 TRENDS IN GLOBAL TRANSPORTATION INDUSTRY
- 5.3.4 TRENDS IN GLOBAL RETAIL INDUSTRY
- 5.4 VALUE CHAIN ANALYSIS
- 5.5 ECOSYSTEM ANALYSIS
- 5.6 PRICING ANALYSIS
- 5.6.1 AVERAGE SELLING PRICE OF DIGITAL SIGNAGE SOLUTIONS OFFERED BY KEY PLAYERS, BY PRODUCT TYPE, 2024
- 5.6.2 AVERAGE SELLING PRICE TREND OF DIGITAL SIGNAGE SOLUTIONS, BY REGION, 2021-2024
- 5.7 TRADE ANALYSIS
- 5.7.1 IMPORT SCENARIO (HS CODE 852859)
- 5.7.2 EXPORT DATA (HS CODE 852859)
- 5.8 KEY CONFERENCES AND EVENTS, 2026-2027
- 5.9 TRENDS/DISRUPTIONS IMPACTING CUSTOMER BUSINESS
- 5.10 INVESTMENT AND FUNDING SCENARIO, 2021-2024
- 5.11 CASE STUDY ANALYSIS
- 5.11.1 GLOBAL QUICK-SERVICE RESTAURANT (QSR) CHAIN IMPLEMENTS CLOUD-BASED DIGITAL MENU BOARDS TO IMPROVE SALES AGILITY AND OPERATIONAL EFFICIENCY
- 5.11.2 INTERNATIONAL AIRPORT DEPLOYS LED VIDEO WALLS AND SMART WAYFINDING SIGNAGE TO ENHANCE PASSENGER EXPERIENCE
- 5.11.3 RETAIL CHAIN ADOPTS AI-DRIVEN DIGITAL SIGNAGE TO ENABLE OMNICHANNEL PERSONALIZATION
- 5.11.4 MULTI-LOCATION BANKING NETWORK IMPLEMENTS INTERACTIVE DIGITAL SIGNAGE TO ENHANCE CUSTOMER ENGAGEMENT AND CROSS-SELLING
- 5.12 IMPACT OF 2025 US TARIFF - DIGITAL SIGNAGE MARKET
- 5.12.1 INTRODUCTION
- 5.12.2 KEY TARIFF RATES
- 5.12.3 PRICE IMPACT ANALYSIS
- 5.12.4 IMPACT ON COUNTRY/REGION
- 5.12.4.1 US
- 5.12.4.2 Europe
- 5.12.4.3 Asia Pacific
- 5.12.5 IMPACT ON INDUSTRIES
6 TECHNOLOGICAL ADVANCEMENTS, AI-DRIVEN IMPACT, PATENTS, INNOVATIONS, AND FUTURE APPLICATIONS
- 6.1 KEY EMERGING TECHNOLOGIES
- 6.1.1 SYSTEM-ON-CHIP DISPLAYS
- 6.1.2 INTERACTIVE DISPLAYS
- 6.2 COMPLEMENTARY TECHNOLOGIES
- 6.2.1 CLOUD AND SAAS INFRASTRUCTURE
- 6.2.2 DATA & ANALYTICS PLATFORMS FOR DIGITAL SIGNAGE
- 6.3 ADJACENT TECHNOLOGIES
- 6.3.1 MOBILE & OMNI-CHANNEL TECHNOLOGIES
- 6.3.2 AR/XR & IMMERSIVE TECHNOLOGIES
- 6.4 TECHNOLOGY/PRODUCT ROADMAP
- 6.4.1 SHORT-TERM (2025-2027): SYSTEM OPTIMIZATION AND DIGITAL INTEGRATION
- 6.4.2 MID-TERM (2027-2030): INTELLIGENT AUTOMATION AND ECOSYSTEM EXPANSION
- 6.5 PATENT ANALYSIS
- 6.6 IMPACT OF AI ON DIGITAL SIGNAGE MARKET
- 6.6.1 TOP USE CASES AND MARKET POTENTIAL
- 6.6.2 BEST PRACTICES IN DIGITAL SIGNAGE MARKET
- 6.6.3 CASE STUDIES RELATED TO AI IMPLEMENTATION IN DIGITAL SIGNAGE MARKET
- 6.6.4 INTERCONNECTED ECOSYSTEM AND IMPACT ON MARKET PLAYERS
- 6.6.5 CLIENTS' READINESS TO ADOPT AI-INTEGRATED DIGITAL SIGNAGE
7 REGULATORY LANDSCAPE
- 7.1 REGIONAL REGULATIONS AND COMPLIANCE
- 7.1.1 REGULATORY BODIES, GOVERNMENT AGENCIES, AND OTHER ORGANIZATIONS
- 7.1.2 STANDARDS
8 CUSTOMER LANDSCAPE AND BUYER BEHAVIOR
- 8.1 INTRODUCTION
- 8.2 DECISION-MAKING PROCESS
- 8.3 KEY STAKEHOLDERS INVOLVED IN BUYING PROCESS AND THEIR EVALUATION CRITERIA
- 8.3.1 KEY STAKEHOLDERS IN BUYING PROCESS
- 8.3.2 BUYING CRITERIA
- 8.4 ADOPTION BARRIERS AND INTERNAL CHALLENGES
- 8.5 UNMET NEEDS OF VARIOUS END USERS
9 DIGITAL SIGNAGE MARKET, BY OFFERING
- 9.1 INTRODUCTION
- 9.2 HARDWARE
- 9.2.1 ADVANCEMENTS IN DISPLAY TECHNOLOGIES AND EXPANDING VISUAL COMMUNICATION INFRASTRUCTURE TO DRIVE DEMAND
- 9.2.2 DISPLAYS
- 9.2.3 MEDIA PLAYERS
- 9.2.4 PROJECTORS
- 9.2.5 OTHER HARDWARE OFFERINGS
- 9.3 SOFTWARE
- 9.3.1 ADVANCEMENTS IN DISPLAY TECHNOLOGIES AND EXPANDING VISUAL COMMUNICATION INFRASTRUCTURE TO DRIVE DEMAND
- 9.3.2 CONTENT MANAGEMENT SYSTEMS
- 9.3.3 EDGE SERVER SOFTWARE
- 9.3.4 OTHER SOFTWARE OFFERINGS
- 9.4 SERVICES
- 9.4.1 END-TO-END DEPLOYMENT SUPPORT AND LIFECYCLE MANAGEMENT SERVICES TO PROPEL MARKET
- 9.4.2 INSTALLATION
- 9.4.3 CONSULTING & OTHER SERVICES
- 9.4.4 MAINTENANCE & OTHER SERVICES
10 DIGITAL SIGNAGE MARKET, BY PRODUCT TYPE
- 10.1 INTRODUCTION
- 10.2 VIDEO WALLS
- 10.2.1 LARGE-FORMAT IMMERSIVE VISUAL EXPERIENCES AND HIGH-VISIBILITY COMMUNICATION TO DRIVE ADOPTION
- 10.3 STANDALONE DISPLAYS
- 10.3.1 FLEXIBLE DEPLOYMENT AND COST-EFFECTIVE DIGITAL COMMUNICATION TO DRIVE GROWTH
- 10.3.2 KIOSKS
- 10.3.2.1 Self-service kiosks
- 10.3.2.2 Information kiosks
- 10.3.3 INFORMATION DISPLAYS
- 10.3.3.1 Menu boards
- 10.3.3.2 Billboards
- 10.3.3.3 Electronic shelf labels
- 10.3.3.4 Others
11 DIGITAL SIGNAGE MARKET, BY DISPLAY SIZE
- 11.1 INTRODUCTION
- 11.2 SMALLER THAN 32 INCHES
- 11.3 32 TO 52 INCHES
- 11.4 LARGER THAN 52 INCHES
12 DIGITAL SIGNAGE MARKET, BY INSTALLATION LOCATION
- 12.1 INTRODUCTION
- 12.2 INDOOR
- 12.2.1 ENHANCED CUSTOMER ENGAGEMENT AND CONTROLLED ENVIRONMENT DEPLOYMENTS TO DRIVE MARKET
- 12.3 OUTDOOR
- 12.3.1 HIGH-VISIBILITY ADVERTISING AND SMART CITY INFRASTRUCTURE EXPANSION TO PROPEL MARKET
13 DIGITAL SIGNAGE MARKET, BY APPLICATION
- 13.1 INTRODUCTION
- 13.2 INFORMATION & MESSAGING
- 13.2.1 REAL-TIME COMMUNICATION AND CENTRALIZED INFORMATION DELIVERY TO DRIVE GROWTH
- 13.3 WAYFINDING
- 13.3.1 ENHANCED VISITOR NAVIGATION AND SMART FACILITY MANAGEMENT TO DRIVE MARKET
- 13.4 ADVERTISING & PROMOTION
- 13.4.1 NEED FOR TARGETED DIGITAL ADVERTISING AND DYNAMIC CONTENT DELIVERY TO PROPEL MARKET
- 13.5 TRANSACTION ENABLEMENT
- 13.5.1 SELF-SERVICE AUTOMATION AND CONTACTLESS INTERACTIONS TO DRIVE GROWTH
- 13.6 ENTERTAINMENT
- 13.6.1 RISE IN IMMERSIVE VISUAL EXPERIENCES AND AUDIENCE ENGAGEMENT TO PROPEL MARKET
- 13.7 CORPORATE COMMUNICATION & PROCESS MANAGEMENT
- 13.7.1 WORKPLACE DIGITALIZATION AND REAL-TIME OPERATIONAL VISIBILITY TO DRIVE MARKET
14 DIGITAL SIGNAGE MARKET, BY END USE
- 14.1 INTRODUCTION
- 14.2 COMMERCIAL
- 14.2.1 RETAIL
- 14.2.1.1 IN-STORE DIGITAL TRANSFORMATION AND OMNICHANNEL CUSTOMER ENGAGEMENT TO DRIVE GROWTH
- 14.2.2 CORPORATE OFFICES
- 14.2.2.1 WORKPLACE DIGITALIZATION AND ENHANCED INTERNAL COMMUNICATION TO DRIVE GROWTH
- 14.2.3 HEALTHCARE FACILITIES
- 14.2.3.1 PATIENT EXPERIENCE ENHANCEMENT AND OPERATIONAL COMMUNICATION EFFICIENCY TO PROPEL MARKET
- 14.2.4 HOSPITALITY FACILITIES & RESTAURANTS
- 14.2.4.1 DIGITAL DINING EXPERIENCES AND SERVICE AUTOMATION TO DRIVE SEGMENT GROWTH
- 14.2.1 RETAIL
- 14.3 INFRASTRUCTURAL
- 14.3.1 TRANSPORTATION HUBS & PUBLIC PLACES
- 14.3.1.1 Real-time information dissemination and crowd management to drive demand
- 14.3.2 SPORTS & ENTERTAINMENT VENUES
- 14.3.2.1 Enhanced fan engagement and immersive venue experiences to drive market
- 14.3.1 TRANSPORTATION HUBS & PUBLIC PLACES
- 14.4 INSTITUTIONAL
- 14.4.1 GOVERNMENT & PUBLIC SECTOR INSTITUTIONS
- 14.4.1.1 Transparent public information delivery and citizen engagement initiatives to drive growth
- 14.4.2 BFSI INSTITUTIONS
- 14.4.2.1 Enhanced customer engagement and digital branch transformation to drive adoption
- 14.4.3 EDUCATIONAL INSTITUTIONS
- 14.4.3.1 Smart campus communication and real-time information delivery to drive market
- 14.4.1 GOVERNMENT & PUBLIC SECTOR INSTITUTIONS
- 14.5 INDUSTRIAL
15 DIGITAL SIGNAGE MARKET, BY ENTERPRISE SIZE
- 15.1 INTRODUCTION
- 15.2 SMALL OFFICES/ HOME OFFICES
- 15.2.1 COST-EFFECTIVE DIGITAL COMMUNICATION AND EASY DEPLOYMENT TO DRIVE ADOPTION
- 15.3 SMALL & MEDIUM-SIZED ENTERPRISES
- 15.3.1 SCALABLE COMMUNICATION SOLUTIONS AND OPERATIONAL EFFICIENCY TO PROPEL MARKET
- 15.4 LARGE ENTERPRISES
- 15.4.1 ENTERPRISE-WIDE DIGITAL TRANSFORMATION AND CENTRALIZED CONTENT ECOSYSTEMS TO DRIVE MARKET
16 DIGITAL SIGNAGE MARKET, BY REGION
- 16.1 INTRODUCTION
- 16.2 NORTH AMERICA
- 16.2.1 MACROECONOMIC OUTLOOK IN NORTH AMERICA
- 16.2.2 US
- 16.2.2.1 Rising investments in digital transformation and data-driven customer engagement to drive adoption
- 16.2.3 CANADA
- 16.2.3.1 Increasing adoption of digital communication solutions and smart infrastructure modernization to propel market
- 16.2.4 MEXICO
- 16.2.4.1 Expanding retail infrastructure and urban commercial development to support market growth
- 16.3 EUROPE
- 16.3.1 MACROECONOMIC OUTLOOK IN EUROPE
- 16.3.2 GERMANY
- 16.3.2.1 Growing adoption of smart retail, digital workplaces, and intelligent public communication systems to drive market
- 16.3.3 UK
- 16.3.3.1 Expansion of digital advertising and smart infrastructure to drive adoption
- 16.3.4 FRANCE
- 16.3.4.1 Retail modernization and smart public communication to drive market
- 16.3.5 SPAIN
- 16.3.5.1 Growth in tourism and retail digitization to support market expansion
- 16.3.6 ITALY
- 16.3.6.1 Increasing adoption across retail, hospitality, and transportation environments to propel market
- 16.3.7 NETHERLANDS
- 16.3.7.1 Smart city initiatives and advanced retail technologies to drive adoption
- 16.3.8 BELGIUM
- 16.3.8.1 Increasing deployment in public infrastructure and commercial spaces to support market growth
- 16.3.9 NORDIC COUNTRIES
- 16.3.9.1 Strong digital infrastructure and sustainability focus to drive adoption
- 16.3.10 REST OF EUROPE
- 16.4 ASIA PACIFIC
- 16.4.1 MACROECONOMIC OUTLOOK IN ASIA PACIFIC
- 16.4.2 CHINA
- 16.4.2.1 Rapid expansion of smart retail, urban infrastructure, and digital advertising networks to propel market
- 16.4.3 AUSTRALIA
- 16.4.3.1 Rising adoption of digital signage across retail, transportation, and smart public infrastructure to drive market
- 16.4.4 JAPAN
- 16.4.4.1 Advanced display technologies and smart retail innovation to support market growth
- 16.4.5 INDIA
- 16.4.5.1 Rapid retail expansion and smart city initiatives to accelerate adoption
- 16.4.6 SOUTH KOREA
- 16.4.6.1 Leadership in display innovation and smart commercial environments to drive market
- 16.4.7 SOUTHEAST ASIA
- 16.4.7.1 Expanding retail infrastructure and urban digital advertising to drive adoption
- 16.4.8 REST OF ASIA PACIFIC
- 16.5 ROW
- 16.5.1 MACROECONOMIC OUTLOOK IN ROW
- 16.5.2 MIDDLE EAST
- 16.5.2.1 Bahrain
- 16.5.2.1.1 Growing smart infrastructure development and retail modernization to drive adoption
- 16.5.2.2 Kuwait
- 16.5.2.2.1 Expanding retail infrastructure and smart public communication initiatives to drive adoption
- 16.5.2.3 Oman
- 16.5.2.3.1 Tourism development and public infrastructure modernization to drive adoption
- 16.5.2.4 Qatar
- 16.5.2.4.1 Smart infrastructure investments and large-scale event ecosystems to accelerate deployment
- 16.5.2.5 Saudi Arabia
- 16.5.2.5.1 Vision 2030 smart city development and retail expansion to drive growth
- 16.5.2.6 UAE
- 16.5.2.6.1 Smart city innovation and experience-driven retail ecosystems to fuel expansion
- 16.5.2.7 Rest of Middle East
- 16.5.2.1 Bahrain
- 16.5.3 AFRICA
- 16.5.3.1 South Africa
- 16.5.3.1.1 Retail expansion and growing DOOH advertising to drive adoption
- 16.5.3.2 Rest of Africa
- 16.5.3.1 South Africa
- 16.5.4 SOUTH AMERICA
- 16.5.4.1 Expanding retail networks and growing digital out-of-home advertising to propel market
17 COMPETITIVE LANDSCAPE
- 17.1 OVERVIEW
- 17.2 KEY PLAYER STRATEGIES/RIGHT TO WIN, 2021-2025
- 17.3 MARKET SHARE ANALYSIS, 2025
- 17.4 BRAND/PRODUCT COMPARISON
- 17.5 COMPANY EVALUATION MATRIX: KEY PLAYERS, 2025
- 17.5.1 STARS
- 17.5.2 EMERGING LEADERS
- 17.5.3 PERVASIVE PLAYERS
- 17.5.4 PARTICIPANTS
- 17.5.5 COMPANY FOOTPRINT: KEY PLAYERS, 2025
- 17.5.5.1 Company footprint
- 17.5.5.2 Region footprint
- 17.5.5.3 Offering footprint
- 17.5.5.4 Product type footprint
- 17.5.5.5 Installation location footprint
- 17.5.5.6 Application footprint
- 17.5.5.7 End-use footprint
- 17.6 COMPANY EVALUATION MATRIX: STARTUPS/SMES, 2025
- 17.6.1 PROGRESSIVE COMPANIES
- 17.6.2 RESPONSIVE COMPANIES
- 17.6.3 DYNAMIC COMPANIES
- 17.6.4 STARTING BLOCKS
- 17.6.5 COMPETITIVE BENCHMARKING: STARTUPS/SMES, 2025
- 17.6.5.1 Detailed list of key startups/SMEs
- 17.6.5.2 Competitive benchmarking of startups/SMEs
- 17.7 COMPANY VALUATION & FINANCIAL METRICS
- 17.8 COMPETITIVE SCENARIO
- 17.8.1 PRODUCT LAUNCHES
- 17.8.2 DEALS
18 COMPANY PROFILES
- 18.1 INTRODUCTION
- 18.2 KEY PLAYERS
- 18.2.1 SAMSUNG
- 18.2.1.1 Business overview
- 18.2.1.2 Products/Solutions/Services offered
- 18.2.1.3 Recent developments
- 18.2.1.3.1 Product launches
- 18.2.1.3.2 Deals
- 18.2.1.4 MnM view
- 18.2.1.4.1 Key strengths
- 18.2.1.4.2 Strategic choices
- 18.2.1.4.3 Weaknesses & competitive threats
- 18.2.2 LG ELECTRONICS
- 18.2.2.1 Business overview
- 18.2.2.2 Products/Solutions/Services offered
- 18.2.2.3 Recent developments
- 18.2.2.3.1 Product launches
- 18.2.2.3.2 Deals
- 18.2.2.4 MnM view
- 18.2.2.4.1 Key strengths
- 18.2.2.4.2 Strategic choices
- 18.2.2.4.3 Weaknesses & competitive threats
- 18.2.3 SHARP CORPORATION
- 18.2.3.1 Business overview
- 18.2.3.2 Products/Solutions/Services offered
- 18.2.3.3 Recent developments
- 18.2.3.3.1 Product launches
- 18.2.3.3.2 Deals
- 18.2.3.4 MnM view
- 18.2.3.4.1 Key strengths
- 18.2.3.4.2 Strategic choices
- 18.2.3.4.3 Weaknesses & competitive threats
- 18.2.4 LEYARD
- 18.2.4.1 Business overview
- 18.2.4.2 Products/Solutions/Services offered
- 18.2.4.3 Recent developments
- 18.2.4.3.1 Product launches
- 18.2.4.4 MnM view
- 18.2.4.4.1 Key strengths
- 18.2.4.4.2 Strategic choices
- 18.2.4.4.3 Weaknesses & competitive threats
- 18.2.5 SONY GROUP CORPORATION
- 18.2.5.1 Business overview
- 18.2.5.2 Products/Solutions/Services offered
- 18.2.5.3 Recent developments
- 18.2.5.3.1 Product launches
- 18.2.5.3.2 Deals
- 18.2.5.4 MnM view
- 18.2.5.4.1 Key strengths
- 18.2.5.4.2 Strategic choices
- 18.2.5.4.3 Weaknesses & competitive threats
- 18.2.6 BARCO
- 18.2.6.1 Business overview
- 18.2.6.2 Products/Solutions/Services offered
- 18.2.6.3 Recent developments
- 18.2.6.3.1 Product launches
- 18.2.6.3.2 Deals
- 18.2.7 PANASONIC HOLDINGS CORPORATION
- 18.2.7.1 Business overview
- 18.2.7.2 Products/Solutions/Services offered
- 18.2.7.3 Recent developments
- 18.2.7.3.1 Product launches
- 18.2.8 AUO CORPORATION
- 18.2.8.1 Business overview
- 18.2.8.2 Products/Solutions/Services offered
- 18.2.8.3 Recent developments
- 18.2.8.3.1 Product launches
- 18.2.8.3.2 Deals
- 18.2.8.3.3 Others
- 18.2.9 DAKTRONICS
- 18.2.9.1 Business overview
- 18.2.9.2 Products/Solutions/Services offered
- 18.2.9.3 Recent developments
- 18.2.9.3.1 Product launches
- 18.2.9.3.2 Deals
- 18.2.10 BRIGHTSIGN LLC
- 18.2.10.1 Business overview
- 18.2.10.2 Products/Solutions/Services offered
- 18.2.10.3 Recent developments
- 18.2.10.3.1 Product launches
- 18.2.10.3.2 Deals
- 18.2.1 SAMSUNG
- 18.3 OTHER PLAYERS
- 18.3.1 STRATACACHE
- 18.3.2 BENQ
- 18.3.3 INTUIFACE
- 18.3.4 DELTA ELECTRONICS, INC.
- 18.3.5 BROADSIGN INTERNATIONAL, LLC
- 18.3.6 CHRISTIE DIGITAL SYSTEMS USA, INC.
- 18.3.7 CISCO SYSTEMS, INC.
- 18.3.8 AESYS S.P.A.
- 18.3.9 TATTILE S.R.L.
- 18.3.10 PPDS
- 18.3.11 NAVORI LABS
- 18.3.12 VIEWSONIC
- 18.3.13 22 MILES
- 18.3.14 FLIPNODE LLC
- 18.3.15 SPECTRIO LLC
19 RESEARCH METHODOLOGY
- 19.1 RESEARCH DATA
- 19.1.1 SECONDARY DATA
- 19.1.1.1 List of key secondary sources
- 19.1.1.2 Key data from secondary sources
- 19.1.2 PRIMARY DATA
- 19.1.2.1 List of primary interview participants
- 19.1.2.2 Breakdown of primary interviews
- 19.1.2.3 Key data from primary sources
- 19.1.2.4 Key industry insights
- 19.1.3 SECONDARY AND PRIMARY RESEARCH
- 19.1.1 SECONDARY DATA
- 19.2 MARKET SIZE ESTIMATION
- 19.2.1 BOTTOM-UP APPROACH
- 19.2.1.1 Approach to arrive at market size using bottom-up analysis (demand side)
- 19.2.2 TOP-DOWN APPROACH
- 19.2.2.1 Approach to arrive at market size using top-down analysis (supply side)
- 19.2.1 BOTTOM-UP APPROACH
- 19.3 FACTOR ANALYSIS
- 19.3.1 DEMAND-SIDE ANALYSIS
- 19.3.2 SUPPLY-SIDE ANALYSIS
- 19.4 MARKET BREAKDOWN AND DATA TRIANGULATION
- 19.5 RESEARCH ASSUMPTIONS
- 19.6 RISK ASSESSMENT
- 19.7 RESEARCH LIMITATIONS
20 APPENDIX
- 20.1 KNOWLEDGESTORE: MARKETSANDMARKETS' SUBSCRIPTION PORTAL
- 20.2 CUSTOMIZATION OPTIONS
- 20.3 RELATED REPORTS
- 20.4 AUTHOR DETAILS
