

|
시장보고서
상품코드
2043976
남미의 디지털 사이니지 : 시장 점유율 분석, 산업 동향 및 통계 데이터, 성장 예측(2026-2031년)South America Digital Signage - Market Share Analysis, Industry Trends & Statistics, Growth Forecasts (2026 - 2031) |
||||||
 Mordor Intelligence
남미의 디지털 사이니지 시장 규모는 2025년에 12억 1,000만 달러로 평가되었습니다. 2026년 12억 9,000만 달러에서 2031년까지 17억 7,000만 달러에 이를 것으로 예상되며, 예측 기간(2026-2031년) CAGR은 6.53%를 나타낼 전망입니다.
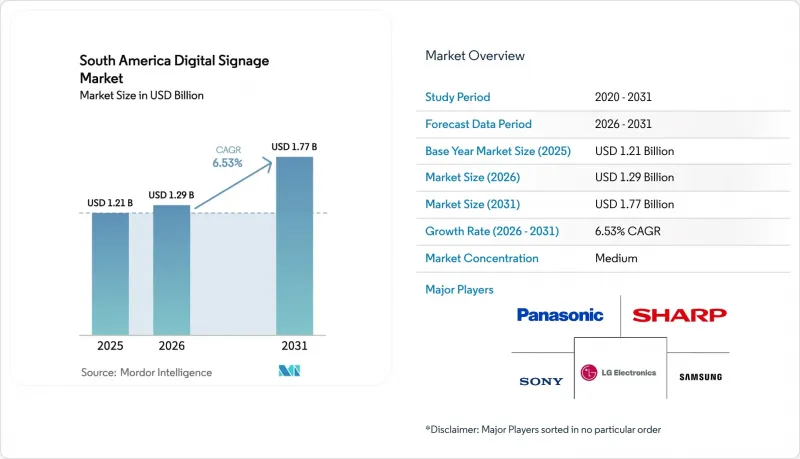
소매 미디어의 도입, 프로그램형 DOOH(digital-out-of-home) 거래, 스마트시티에 대한 투자와 맞물려 쇼핑몰, 교통 허브, 공공 광장 등에서 네트워크 연결형 스크린의 적용 범위가 확대되고 있습니다. 2025년 기준 하드웨어는 여전히 가장 큰 비용 요소이지만, 사업자들은 데이터 기반 콘텐츠 순환을 통해 시청자로부터 수익을 창출하는 매니지드 서비스로 전환하고 있습니다. 패널 가격의 하락, 특히 대형 LED 패널의 가격 하락으로 인해 중규모 자치단체의 진입장벽이 낮아지고 있습니다. 한편, 전자종이 모듈은 아마존 강 유역과 안데스 고원지대에서 전력망에 의존하지 않는 설치 기회를 창출하고 있습니다. 규제 측면의 불확실성은 여전히 남아 있지만, 광대역 보급률 증가와 5G의 보급으로 실시간 입찰과 클라우드 기반 콘텐츠 관리에 대한 이 지역의 기반이 강화되고 있습니다.
남미의 디지털 사이니지 시장 동향과 인사이트
소매업 현대화 및 옴니채널 투자 증가 추세
소매 체인은 매장 내 프로모션을 모바일 앱 및 EC 사이트와 연동하기 위해 통로 끝, 계산대, 약국 카운터에 연결된 스크린을 설치하고 있습니다. 브라질의 리테일 미디어 매출은 2024년 42.3% 증가했고, 조사 대상 브랜드의 81%가 2026년 지출을 확대할 계획이며, 스크린이 브랜드 인지 수단에서 전환을 추적하는 퍼포먼스 마케팅의 엔드포인트로 이동함에 따라 2026년 지출을 확대할 것으로 예상했습니다. 로열티 데이터를 활용하면 식료품점은 실시간 혜택을 제공할 수 있고, QR 코드는 모바일에서 혜택 이용을 촉진할 수 있습니다. 이 전략으로 메르카도 리브레의 블랙프라이데이 매출은 전년 대비 80% 증가했습니다. 아르헨티나의 식료품 소매업체들은 매장 확장 비용을 상쇄하기 위해 유사한 모델을 추구하고 있으며, 칠레의 소매업체들은 현재 옥외 스크린의 야간 소등을 의무화하는 빛 공해 규제를 피할 수 있는 고휘도 실내 디스플레이를 우선시하고 있습니다.
FMCG 및 통신업계 광고주들의 DOOH 도입 급증
일용소비재(FMCG) 및 통신 브랜드들은 정적인 광고판에서 오디언스 측정 및 시간대별 유연한 구매가 가능한 프로그래매틱 DOOH로 예산을 전환하고 있습니다. JCDecaux와 VIOOH는 2024년 8월 상파울루의 거리 가구에 프로그래밍 방식으로 접근하기 시작했으며, 파일럿 광고주인 InfinitePay에서 브랜드 인지도와 웹사이트 트래픽이 모두 증가했음을 입증했습니다. VIOOH의 조사에 따르면, 브라질에서 DOOH에 대한 추가 지출의 87%는 전통적인 옥외광고 포맷이 아닌 온라인 채널로의 전환에 의한 것으로 나타났습니다. 5G 번들을 홍보하는 통신사들은 교통 허브의 스크린을 활용하여 대기 중인 통근자들의 관심을 끌고 있으며, 도박 플랫폼과 같은 새로운 광고주 카테고리가 수요에 힘을 보태고 있습니다. 주요 도시 외 지역에서의 커버리지 부족은 여전히 문제이지만, 4G-5G 보급률 증가로 인해 보다 폭넓은 광고 영역의 활용이 기대됩니다.
높은 초기 시스템 및 통합 비용
디스플레이, 미디어 플레이어, 소프트웨어 라이선스, 설치 비용 등을 모두 합치면 엔드투엔드 비디오월 설치 비용은 25만 달러가 넘을 수 있으며, 이는 소규모 소매업체나 예산이 부족한 지자체에 장벽이 될 수 있습니다. 아르헨티나의 환율 변동으로 인해 수입 하드웨어 가격이 상승함에 따라 구매자들은 업그레이드를 미루거나 프로그래밍 거래를 지원하지 않는 저사양 모델로 타협하는 경향이 있습니다. 미래의 광고 수익에 대한 대가로 지불을 연기하는 수익배분 계약은 존재하지만, 브라질을 제외한 기타 국가에서는 아직 일반적이지 않습니다.
부문 분석
2025년, 소매업체와 운송업체가 패널, 마운트, 배선에 투자한 결과, 하드웨어는 남미의 디지털 사이니지 시장 점유율의 57.37%를 차지했습니다. 서비스 부문은 CAGR 6.84%를 나타낼 것으로 예측되며, 이는 콘텐츠 스케줄링, 가동시간 모니터링, 고정 스폰서십을 노출 기반 수익으로 전환하는 프로그램matic 광고 판매에 대한 수요를 반영하고 있습니다.
서비스의 급격한 성장은 설비투자에서 지속적인 운영비 모델로의 전환을 보여줍니다. 통합업체는 크리에이티브 제작, 데이터 분석, 컴플라이언스 보고를 패키지화하여 브라질, 아르헨티나, 칠레에 200개 매장을 운영하는 소매업체가 기술적 복잡성을 아웃소싱할 수 있도록 지원합니다. 예지보전과 동적 크리에이티브 최적화를 위해 인공지능을 접목한 클라우드 플랫폼은 구독료가 발생하기 때문에 벤더들은 지속적인 수익원으로 전환하고 있습니다.
2025년 남미의 디지털 사이니지 시장 규모의 61.28%를 LCD 및 LED 패널이 차지했습니다. 이들은 실내 소매점이나 옥외 교통 자산에 적합한 밝기와 다양한 사이즈의 제품군으로 평가받고 있습니다. 전자 종이는 틈새 시장이지만, 태양광 발전 모듈을 통해 아마존의 강 항구와 안데스 산맥의 물류 통로에서 상시 가시성 있는 사이니지를 구현할 수 있기 때문에 7.44%의 성장률로 확대될 것입니다.
E Ink의 'Spectra 6'는 전자가격표시기와 버스 정류장 시간표에 적합한 풀 컬러 재생률을 구현하고, 삼성의 13인치 바이오 수지 전자 종이 디스플레이는 지방 자치 단체의 지속가능성 요구 사항을 충족합니다. OLED와 마이크로 LED는 여전히 고가의 옵션으로 고급 소매점이나 기업의 플래그십 로비에 국한되어 있지만, 직접 뷰 LED의 가격 하락과 함께 전통적인 프로젝션 시스템은 감소하는 추세입니다.
기타 혜택 :
- 엑셀 형식 시장 예측(ME) 시트
- 3개월간 애널리스트 지원
자주 묻는 질문
목차
제1장 서론
제2장 분석 방법
제3장 주요 요약
제4장 시장 구도
제5장 시장 규모와 성장 예측
제6장 경쟁 구도
제7장 시장 기회와 향후 전망
KTH 26.05.29The South America digital signage market size was valued at USD 1.21 billion in 2025 and estimated to grow from USD 1.29 billion in 2026 to reach USD 1.77 billion by 2031, at a CAGR of 6.53% during the forecast period (2026-2031).
A confluence of retail-media adoption, programmatic digital-out-of-home (DOOH) trading, and smart-city investments is expanding the addressable base of networked screens across malls, transit hubs, and public plazas. Hardware remained the largest cost center in 2025, yet operators are pivoting toward managed services that monetize audiences through data-driven content rotation. Falling panel prices, especially for large-format LED, are lowering entry barriers for mid-tier municipalities, while e-paper modules open off-grid opportunities in the Amazon Basin and Andean highlands. Regulatory uncertainty persists, but rising broadband penetration and 5G rollout underpin the region's capacity for real-time bidding and cloud-based content management.
South America Digital Signage Market Trends and Insights
Retail Modernization and Omnichannel Investment Up-Trend
Retail chains are embedding connected screens into aisle ends, checkout lanes, and pharmacy counters to synchronize in-store promotions with mobile apps and e-commerce storefronts. Brazil's retail-media revenue grew 42.3% in 2024, and 81% of surveyed brands plan to boost spending in 2026 as screens shift from brand awareness assets to performance marketing endpoints that track conversions. Loyalty data allows grocers to serve real-time offers, while QR codes accelerate mobile redemption, a tactic that lifted Mercado Libre's Black Friday sales by 80% year over year. Argentina's grocery operators pursue similar models to offset store-expansion costs, and Chilean retailers now prioritize high-brightness indoor displays that circumvent a light-pollution ordinance mandating overnight shutdown of outdoor screens.
DOOH Adoption Surge among FMCG and Telecom Advertisers
Fast-moving consumer goods and telecom brands are reallocating budgets from static billboards to programmatic DOOH that supports audience measurement and flexible daypart buying. JCDecaux and VIOOH switched on programmatic access to Sao Paulo street furniture in August 2024, demonstrating uplift in both brand recall and website traffic for pilot advertiser InfinitePay. A VIOOH survey notes 87% of incremental DOOH spend in Brazil now migrates from online channels rather than legacy out-of-home formats. Telcos promoting 5G bundles leverage transit-hub screens to engage commuters at wait times, while new advertiser categories such as betting platforms add depth to demand. Coverage gaps outside tier-one cities remain a challenge, yet rising 4G and 5G penetration promises wider inventory activation.
High Upfront System and Integration Costs
End-to-end video-wall implementations can exceed USD 250,000 once displays, media players, software licenses, and installation labor are tallied, a barrier for small retailers and cost-constrained municipalities. Argentina's currency volatility inflates imported hardware prices, encouraging buyers to delay upgrades or settle for low-spec models that do not support programmatic trading. Revenue-sharing arrangements that defer payment against future ad proceeds exist but remain uncommon outside Brazil.
Other drivers and restraints analyzed in the detailed report include:
- Declining Capex of Large-Format LCD and LED Panels
- Government-Funded Smart-City Kiosk Roll-Outs
- Municipal Permitting Variability across Provinces
For complete list of drivers and restraints, kindly check the Table Of Contents.
Segment Analysis
Hardware retained 57.37% of the South America digital signage market share in 2025 as retailers and transit authorities invested in panels, mounts, and cabling. The services category is projected to deliver a 6.84% CAGR, reflecting demand for content scheduling, uptime monitoring, and programmatic ad sales that convert fixed sponsorships into impression-based revenue.
The services boom signals a shift from capital expenditure to recurring operating expenditure models. Integrators bundle creative production, data analytics, and compliance reporting so retailers spanning 200 stores across Brazil, Argentina, and Chile can outsource technical complexity. Cloud platforms that embed artificial intelligence for predictive maintenance and dynamic creative optimization carry subscription fees, moving vendors toward annuity revenue streams.
LCD and LED panels captured 61.28% of the South America digital signage market size in 2025, prized for brightness and a broad range of dimensions suited to indoor retail and outdoor transit assets. E-paper, although niche, will accelerate at 7.44% as solar-powered modules enable always-readable signage in Amazonian river ports and Andean logistics corridors.
E Ink's Spectra 6 achieves full-color refresh rates suitable for electronic shelf labels and bus-stop schedules, while Samsung's 13-inch bio-resin e-paper display aligns with municipal sustainability mandates. OLED and micro-LED remain high-cost options reserved for luxury retail and flagship corporate lobbies, whereas legacy projection systems decline as direct-view LED prices fall.
The South America Digital Signage Market Report is Segmented by Component (Hardware, Software, and Services), Display Technology (LCD/LED, OLED, Projection and Screens, E-Paper, and More), Installed Location (Indoor, and Outdoor), and End-User Industry (Retail, Transportation and Transit, Hospitality and Leisure, Corporate and Banking, Healthcare, and More) and Country. The Market Forecasts are Provided in Terms of Value (USD).
List of Companies Covered in this Report:
- LG Electronics Inc.
- Samsung Electronics Co., Ltd.
- Panasonic Holdings Corporation
- Sony Group Corporation
- Sharp Corporation
- NEC Display Solutions, Ltd.
- Mitsubishi Electric Corporation
- Barco NV
- Broadsign International, LLC
- Scala, Inc.
- STRATACACHE, Inc.
- Planar Systems, Inc.
- Daktronics, Inc.
- Omnivex Corporation
- E Ink Holdings Inc.
- AU Optronics Corp.
- Leyard Optoelectronic Co., Ltd.
- Clear Channel Outdoor Holdings, Inc.
- Christie Digital Systems USA, Inc.
Additional Benefits:
- The market estimate (ME) sheet in Excel format
- 3 months of analyst support
TABLE OF CONTENTS
1 INTRODUCTION
- 1.1 Study Assumptions and Market Definition
- 1.2 Scope of the Study
2 RESEARCH METHODOLOGY
3 EXECUTIVE SUMMARY
4 MARKET LANDSCAPE
- 4.1 Market Overview
- 4.2 Market Drivers
- 4.2.1 Retail Modernization and Omnichannel Investment Up-Trend
- 4.2.2 DOOH Adoption Surge among FMCG and Telecom Advertisers
- 4.2.3 Declining Capex of Large-Format LCD/LED Panels
- 4.2.4 Government-Funded Smart-City Kiosk Roll-Outs
- 4.2.5 Programmatic DOOH Exchanges Localized for ES-PT Markets
- 4.2.6 E-Paper Signage for Off-Grid Amazon and Andean Logistics
- 4.3 Market Restraints
- 4.3.1 High Upfront System and Integration Costs
- 4.3.2 Complex Multi-Vendor Technology Stack
- 4.3.3 Municipal Permitting Variability across Provinces
- 4.3.4 Power-Consumption Curbs, Grid Instability in Rural Zones
- 4.4 Industry Value Chain Analysis
- 4.5 Regulatory Landscape
- 4.6 Technological Outlook
- 4.7 Porter's Five Forces Analysis
- 4.7.1 Bargaining Power of Suppliers
- 4.7.2 Bargaining Power of Buyers
- 4.7.3 Threat of New Entrants
- 4.7.4 Threat of Substitutes
- 4.7.5 Intensity of Competitive Rivalry
- 4.8 Impact of Macroeconomic Factors on the Market
5 MARKET SIZE AND GROWTH FORECASTS (VALUE)
- 5.1 By Component
- 5.1.1 Hardware
- 5.1.2 Software
- 5.1.3 Services
- 5.2 By Display Technology
- 5.2.1 LCD / LED
- 5.2.2 OLED
- 5.2.3 Projection and Screens
- 5.2.4 E-Paper
- 5.2.5 Other Display Technologies
- 5.3 By Installation Location
- 5.3.1 Indoor
- 5.3.2 Outdoor
- 5.4 By End-User Industry
- 5.4.1 Retail
- 5.4.2 Transportation and Transit
- 5.4.3 Hospitality and Leisure
- 5.4.4 Corporate and Banking
- 5.4.5 Government and Public Spaces
- 5.4.6 Education and Healthcare
- 5.4.7 Other End-User Industries
- 5.5 By Country
- 5.5.1 Brazil
- 5.5.2 Argentina
- 5.5.3 Peru
- 5.5.4 Chile
- 5.5.5 Rest of South America
6 COMPETITIVE LANDSCAPE
- 6.1 Market Concentration
- 6.2 Strategic Moves
- 6.3 Market Share Analysis
- 6.4 Company Profiles (includes Global level Overview, Market level overview, Core Segments, Financials as available, Strategic Information, Market Rank/Share for key companies, Products and Services, and Recent Developments)
- 6.4.1 LG Electronics Inc.
- 6.4.2 Samsung Electronics Co., Ltd.
- 6.4.3 Panasonic Holdings Corporation
- 6.4.4 Sony Group Corporation
- 6.4.5 Sharp Corporation
- 6.4.6 NEC Display Solutions, Ltd.
- 6.4.7 Mitsubishi Electric Corporation
- 6.4.8 Barco NV
- 6.4.9 Broadsign International, LLC
- 6.4.10 Scala, Inc.
- 6.4.11 STRATACACHE, Inc.
- 6.4.12 Planar Systems, Inc.
- 6.4.13 Daktronics, Inc.
- 6.4.14 Omnivex Corporation
- 6.4.15 E Ink Holdings Inc.
- 6.4.16 AU Optronics Corp.
- 6.4.17 Leyard Optoelectronic Co., Ltd.
- 6.4.18 Clear Channel Outdoor Holdings, Inc.
- 6.4.19 Christie Digital Systems USA, Inc.
7 MARKET OPPORTUNITIES AND FUTURE OUTLOOK
- 7.1 White-Space and Unmet-Need Assessment


