|
시장보고서
상품코드
2029869
재활용 검사 시장 : 재활용 소재별, 기술별, 최종사용자 시설별, 지역별 - 세계 예측(-2031년)Recycling Inspection Market by Material Recycled, Technology, End-use Facility, and Region - Global Forecast to 2031 |
||||||
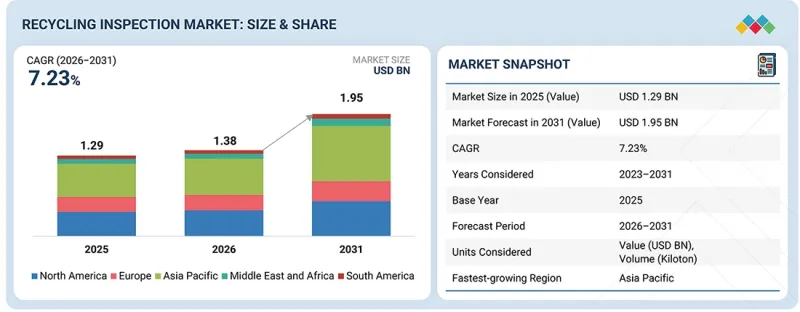
재활용 검사 시장 규모는 2026년에 13억 8,000만 달러로 평가되었으며, 2026년부터 2031년까지 CAGR 7.23%를 기록하며 2031년에는 19억 5,000만 달러에 달할 것으로 예측됩니다.
| 조사 범위 | |
|---|---|
| 조사 대상 기간 | 2023-2031년 |
| 기준 연도 | 2025년 |
| 예측 기간 | 2026-2031년 |
| 단위 | 금액(달러) 및 킬로톤 |
| 부문 | 재활용 소재, 검사 기술, 최종 용도 시설, 지역 |
| 대상 지역 | 아시아태평양, 유럽, 북미, 중동 및 아프리카, 남미 |
"고품질 재생 소재에 대한 수요 증가로 첨단 검사 시스템 도입 촉진"
각 산업계가 원자재 조달에 있어 성능, 균일성, 지속가능성을 점점 더 중요시하는 가운데, 고품질 재생 소재에 대한 수요 증가가 재활용 검사 시장의 주요 촉진요인으로 부상하고 있습니다. 포장, 자동차, 전자제품, 소비재 등의 산업은 현재 특히 식품 포장과 같은 고부가가치 및 섬세한 응용 분야에서 버진 소재의 특성에 매우 근접한 재생 소재를 요구하고 있습니다. 이러한 변화는 규제 요건뿐만 아니라 지속가능성 및 순환 경제 목표에 대한 브랜드의 노력에 의해 촉진되고 있습니다. 그 결과, 재활용 소재에 약간의 혼입이나 오분류가 있더라도 그 유용성과 시장 가치에 심각한 영향을 미칠 수 있습니다.
이러한 높아진 기대에 부응하기 위해 재활용 시설들은 선별 공정의 정확성과 효율성을 향상시켜야 하는 과제를 안고 있습니다. 따라서 AI 탑재 시스템, 근적외선 센서, 광학 선별 솔루션 등 첨단 검사 기술이 중요한 역할을 합니다. 이러한 기술은 다양한 재료의 종류를 정확하게 식별하고 불순물을 제거하며 고속 처리에서도 일관된 품질의 제품을 보장하는 데 도움이 됩니다. 품질이 가격, 고객 신뢰, 장기 계약에 직접적인 영향을 미치는 시장에서 사업자들은 강력한 검사 시스템에 점점 더 많은 투자를 하고 있습니다. 따라서 고순도 재생 소재 생산에 대한 관심이 높아지면서 밸류체인 전반에 걸쳐 첨단 재활용 검사 솔루션의 도입이 크게 촉진되고 있습니다.
"예측 기간 동안 비전 검사 시스템은 금액 기준 3위의 점유율을 차지할 것으로 예상"
비전 검사 시스템은 선별 정확도 향상과 실시간 재료 식별을 가능하게 하는 역할이 확대되고 있는 것을 배경으로 금액 기준 3위의 점유율을 차지하고 있습니다. 이 시스템은 고해상도 카메라, 고급 이미지 처리 및 AI 알고리즘을 활용하여 폐기 물류의 모양, 크기, 색상 및 표면 결함을 감지합니다. 특히 유색 플라스틱 선별, 종이의 불순물 식별, 포장 폐기물의 품질 관리 개선 등 시각적 식별이 필수적인 분야에 특히 효과적입니다. 다른 기술에 비해 비전 시스템은 유연성과 적응성이 뛰어나 운영자가 하드웨어를 크게 변경하지 않고도 소프트웨어와 알고리즘을 업그레이드 할 수 있습니다. 재활용 시설이 점점 더 자동화 및 데이터 기반 운영으로 전환되고 있는 가운데, 비전 검사 시스템의 도입이 확대되고 있으며, 업무 효율성 향상과 안정적인 출력 품질을 지원함으로써 시장에서 주요 기술 분야로 확고히 자리매김하고 있습니다.
"종이 재활용 플랜트 부문은 금액 기준 3위의 점유율을 차지할 것으로 예상"
이는 재활용 종이 제품에서 일관된 섬유 품질을 유지하고 오염을 최소화해야 할 필요성에 의해 주도되고 있습니다. 이들 시설에서는 골판지, 사무용지, 혼합지 등 다양한 폐기물 스트림을 처리하고 있으며, 플라스틱, 잉크, 접착제, 음식물 찌꺼기 등의 불순물이 처리 효율과 최종 제품의 품질에 영향을 미칠 수 있습니다. 특히 포장용도에서 재생지 수요가 증가함에 따라 사업자들은 선별 정확도 향상과 균일한 제품 확보를 위해 검사 시스템을 도입하고 있습니다. 검사의 엄격함은 플라스틱만큼 엄격하지는 않지만, 사업 규모와 높은 품질 요구 사항으로 인해 도입이 꾸준히 확대되고 있으며, 이 부문은 시장에서 3위를 차지하고 있습니다.
"유럽은 3번째로 큰 규모를 보이는 지역"
유럽은 강력한 규제 프레임워크와 지속가능한 폐기물 관리 관행에 대한 오랜 노력에 힘입어 재활용 검사 시장에서 3번째로 큰 점유율을 차지하고 있습니다. 이 지역에서는 엄격한 재활용 목표와 순환 경제 정책이 도입되어 자원 회수 시설 전반에 걸쳐 고도의 검사 및 선별 기술 도입이 촉진되고 있습니다. 또한, 잘 구축된 재활용 인프라의 존재와 산업계와 소비자의 환경적 지속가능성에 대한 높은 인식이 효율적인 검사 솔루션에 대한 수요를 견인하고 있습니다. 특히 플라스틱 및 포장 폐기물의 경우, 재료 품질 향상과 오염 감소에 대한 관심이 높아지면서 첨단 검사 시스템 도입이 더욱 가속화되고 있으며, 이는 세계 재활용 검사 시장에서 유럽의 주요 시장으로서의 입지를 더욱 공고히 하고 있습니다.
세계의 재활용 검사 시장을 조사했으며, 시장 개요, 시장 성장에 영향을 미치는 각종 영향요인 분석, 기술·특허 동향, 법·규제 환경, 사례 분석, 시장 규모 추정 및 예측, 각종 부문별·지역별·주요 국가별 상세 분석, 경쟁 구도, 주요 기업 개요 등의 정보를 정리하여 전해드립니다.
자주 묻는 질문
목차
제1장 소개
제2장 주요 요약
제3장 주요 인사이트
제4장 시장 개요
제5장 업계 동향
제6장 고객 상황과 구매 행동
제7장 기술의 진보, AI에 의한 영향, 특허, 혁신, 향후 응용
제8장 지속가능성과 규제 상황
제9장 재활용 검사 시장 : 재활용 재료별
제10장 재활용 검사 시장 : 검사 기술별
제11장 재활용 검사 시장 : 최종 용도 시설별
제12장 재활용 검사 시장 : 지역별
제13장 경쟁 구도
제14장 기업 개요
제15장 조사 방법
제16장 부록
KSM 26.05.21The recycling inspection market size was valued at USD 1.38 billion in 2026 and is projected to reach USD 1.95 billion by 2031, at a CAGR of 7.23% between 2026 and 2031.
| Scope of the Report | |
|---|---|
| Years Considered for the Study | 2023-2031 |
| Base Year | 2025 |
| Forecast Period | 2026-2031 |
| Units Considered | Value (USD million) and volume (kiloton) |
| Segments | Material recycled, inspection technology, end-use facility, and region |
| Regions covered | Asia Pacific, Europe, North America, Middle East & Africa, and South America |
"Rising demand for high-quality recyclates to drive adoption of advanced inspection systems."
The growing demand for high-quality recycled materials is emerging as a key driver for the recycling inspection market, as industries increasingly prioritize performance, consistency, and sustainability in their material sourcing. Sectors such as packaging, automotive, electronics, and consumer goods are now seeking recyclates that closely match the properties of virgin materials, especially for high-value and sensitive applications like food-grade packaging. This shift is driven not only by regulatory requirements but also by brand commitments to sustainability and circular economy goals. As a result, even minor contamination or misclassification in recycled materials can significantly impact their usability and market value.

To meet these rising expectations, recycling facilities are under pressure to improve the precision and efficiency of their sorting processes. This is where advanced inspection technologies such as AI-enabled systems, near-infrared sensors, and optical sorting solutions play a critical role. These technologies help accurately identify different material types, remove impurities, and ensure consistent output quality at high processing speeds. In a market where quality directly influences pricing, customer trust, and long-term contracts, operators are increasingly investing in robust inspection systems. This growing emphasis on producing high-purity recyclates is therefore significantly driving the adoption of advanced recycling inspection solutions across the value chain.
"Vision inspection systems to account for the third-largest share of the recycling inspection market, in terms of value, during the forecast period."
Vision inspection systems account for the third-largest share of the recycling inspection market, driven by their growing role in enhancing sorting accuracy and enabling real-time material identification. These systems use high-resolution cameras, advanced image processing, and AI algorithms to detect variations in shape, size, color, and surface defects across waste streams. They are particularly effective in applications where visual differentiation is critical, such as sorting colored plastics, identifying contaminants in paper streams, and improving quality control in packaging waste. Compared to other technologies, vision systems offer flexibility and adaptability, allowing operators to upgrade software and algorithms without significant hardware changes. As recycling facilities increasingly move toward automation and data-driven operations, the integration of vision inspection systems is expanding, supporting improved operational efficiency and consistent output quality, thereby securing their position as a key technology segment in the market.
"Paper recycling plant segment to account for the third-largest share of the recycling inspection market in terms of value."
Paper recycling plants account for the third-largest share of the recycling inspection market, driven by the need to maintain consistent fiber quality and minimize contamination in recycled paper products. These facilities process diverse waste streams, such as corrugated boxes, office paper, and mixed paper, in which contaminants like plastics, inks, adhesives, and food residues can affect processing efficiency and final product quality. As demand for recycled paper increases, particularly in packaging applications, operators are adopting inspection systems to improve sorting accuracy and ensure uniform output. While inspection intensity is lower than for plastics, the scale of operations and quality requirements continue to support steady adoption, securing their position as the third-largest segment in the market.
"Europe is the third-largest region of the global recycling inspection market."
Europe holds the third-largest share in the recycling inspection market, supported by its strong regulatory framework and long-standing commitment to sustainable waste management practices. The region has implemented stringent recycling targets and circular economy policies, encouraging the adoption of advanced inspection and sorting technologies across material recovery facilities. Additionally, the presence of a well-developed recycling infrastructure and high awareness regarding environmental sustainability among industries and consumers is driving demand for efficient inspection solutions. The increasing focus on improving material quality and reducing contamination, particularly in plastics and packaging waste, is further accelerating the deployment of advanced inspection systems, reinforcing Europe's position as a key market in the global recycling inspection landscape.
- By Company Type: Tier 1 - 55%, Tier 2 - 25%, and Tier 3 - 20%
- By Designation: Directors - 50%, Managers - 30%, and Others - 20%
- By Region: North America - 40%, Europe - 35%, Asia Pacific - 18%, and Rest of the World - 7%
The key players profiled in the report include TOMRA Systems ASA (Norway), STEINERT GmbH (Germany), Pellenc ST (France), Buhler Group (Switzerland), Hefei Meyer Optoelectronic Technology Inc. (China), MSS, LLC (US), Bunting (US), CASSEL Messtechnik GmbH (Germany), Terex Corporation (US), and Sesotec Group (Germany), among others.
Study Coverage
This report segments the market for recycling inspection based on inspection technology, material recycled, end-use facility, and region, and provides estimations of value (in terms of USD million) for the overall market size across various regions. A detailed analysis of key industry players has been conducted to provide insights into their business overviews, services, and key strategies in the recycling inspection market.
Reasons to Buy this Report
This research report is focused on various levels of analysis - industry analysis (industry trends), market share analysis of top players, and company profiles, which together provide an overall view of the competitive landscape, emerging and high-growth segments of the recycling inspection market; high-growth regions; and market drivers, restraints, and opportunities.
The report provides insights into the following points:
- Market Penetration: Comprehensive information on recycling inspection offered by top players in the global market
- Analysis of key drivers (rising global waste generation and increasing complexity of waste streams, stringent environmental regulations and recycling targets across regions, growing adoption of automation and AI-based sorting technologies in material recovery facilities, increasing focus on circular economy and demand for high-quality recycled materials), restraints (high initial investment and integration costs of advanced inspection systems, limited adoption in developing regions due to cost sensitivity and infrastructure gaps), opportunities (integration of artificial intelligence and machine learning for improved sorting accuracy, expansion of recycling infrastructure in emerging economies, growing demand for high purity recycled materials in manufacturing industries), and challenges (variability in waste composition affecting inspection efficiency and consistency, balancing cost efficiency with high performance and accuracy requirements)
- Product Development/Innovation: Detailed insights on upcoming technologies, research & development activities, and new product & service launches in the recycling inspection market
- Market Development: Comprehensive information about lucrative emerging markets. The report analyzes the markets for recycling inspection across regions
- Market Diversification: Exhaustive information about new products, untapped regions, and recent developments in the global recycling inspection market
- Competitive Assessment: In-depth assessment of market shares, strategies, products, and manufacturing capabilities of leading players in the recycling inspection market
TABLE OF CONTENTS
1 INTRODUCTION
- 1.1 STUDY OBJECTIVES
- 1.2 MARKET DEFINITION
- 1.3 STUDY SCOPE
- 1.3.1 MARKET COVERED & REGIONAL SCOPE
- 1.3.2 INCLUSIONS & EXCLUSIONS
- 1.3.3 YEARS CONSIDERED
- 1.3.4 UNITS CONSIDERED
- 1.3.4.1 Currency/Value unit
- 1.3.4.2 Volume unit
- 1.4 STAKEHOLDERS
2 EXECUTIVE SUMMARY
- 2.1 KEY INSIGHTS AND MARKET HIGHLIGHTS
- 2.2 KEY MARKET PARTICIPANTS: MAPPING OF STRATEGIC DEVELOPMENTS
- 2.3 DISRUPTIVE TRENDS SHAPING RECYCLING INSPECTION MARKET
- 2.4 HIGH GROWTH SEGMENTS
- 2.5 SNAPSHOT: GLOBAL MARKET SIZE, GROWTH RATE, AND FORECAST
3 PREMIUM INSIGHTS
- 3.1 ATTRACTIVE OPPORTUNITIES FOR RECYCLING INSPECTION MARKET PLAYERS
- 3.2 RECYCLING INSPECTION MARKET, BY INSPECTION TECHNOLOGY
- 3.3 RECYCLING INSPECTION MARKET, BY MATERIALS RECYCLED
- 3.4 RECYCLING INSPECTION MARKET, BY END-USE FACILITY
- 3.5 RECYCLING INSPECTION MARKET, BY COUNTRY
4 MARKET OVERVIEW
- 4.1 INTRODUCTION
- 4.2 MARKET DYNAMICS
- 4.2.1 DRIVERS
- 4.2.1.1 Rising global waste generation and increasing complexity of waste streams
- 4.2.1.2 Stringent environmental regulations and recycling targets across regions
- 4.2.1.3 Growing adoption of automation and AI-based sorting technologies in material recovery facilities
- 4.2.1.4 Increasing focus on circular economy and demand for high-quality recycled materials
- 4.2.2 RESTRAINTS
- 4.2.2.1 High initial investment and integration costs of advanced inspection systems
- 4.2.2.2 Limited adoption in developing regions due to cost sensitivity and infrastructure gaps
- 4.2.3 OPPORTUNITIES
- 4.2.3.1 Integration of artificial intelligence and machine learning for improved sorting accuracy
- 4.2.3.2 Expansion of recycling infrastructure in emerging economies
- 4.2.3.3 Growing demand for high-purity recycled materials in manufacturing industries
- 4.2.4 CHALLENGES
- 4.2.4.1 Variability in waste composition affecting inspection efficiency and consistency
- 4.2.4.2 Balancing cost efficiency with high performance and accuracy requirements
- 4.2.1 DRIVERS
- 4.3 UNMET NEEDS AND WHITE SPACES
- 4.3.1 UNMET NEEDS IN RECYCLING INSPECTION MARKET
- 4.3.2 WHITE SPACE OPPORTUNITIES
- 4.4 INTERCONNECTED MARKETS AND CROSS-SECTOR OPPORTUNITIES
- 4.4.1 INTERCONNECTED MARKETS
- 4.4.2 CROSS-SECTOR OPPORTUNITIES
- 4.5 EMERGING BUSINESS MODELS AND ECOSYSTEM SHIFTS
- 4.5.1 EMERGING BUSINESS MODELS
- 4.5.2 ECOSYSTEM SHIFTS
- 4.6 STRATEGIC MOVES BY TIER-1/2/3 PLAYERS
- 4.6.1 KEY MOVES AND STRATEGIC FOCUS
5 INDUSTRY TRENDS
- 5.1 PORTER'S FIVE FORCES ANALYSIS
- 5.1.1 THREAT OF NEW ENTRANTS
- 5.1.2 THREAT OF SUBSTITUTES
- 5.1.3 BARGAINING POWER OF SUPPLIERS
- 5.1.4 BARGAINING POWER OF BUYERS
- 5.1.5 INTENSITY OF COMPETITIVE RIVALRY
- 5.2 KEY CONTAMINANTS IN RECYCLING STREAMS
- 5.2.1 CONTAMINANTS IN PLASTIC RECYCLING
- 5.2.2 CONTAMINANTS IN PAPER RECYCLING
- 5.2.3 IMPACT OF CONTAMINANTS ON RECYCLING EFFICIENCY
- 5.3 MACROECONOMIC INDICATORS
- 5.3.1 GLOBAL GDP TRENDS
- 5.4 VALUE CHAIN ANALYSIS
- 5.5 ECOSYSTEM ANALYSIS
- 5.6 PRICING ANALYSIS
- 5.6.1 AVERAGE SELLING PRICE TREND, BY INSPECTION TECHNOLOGY
- 5.6.2 AVERAGE SELLING PRICE TREND, BY REGION
- 5.7 TRADE ANALYSIS
- 5.7.1 IMPORT SCENARIO (HS CODE 9031)
- 5.7.2 EXPORT SCENARIO (HS CODE 9031)
- 5.8 KEY CONFERENCES AND EVENTS
- 5.9 TRENDS & DISRUPTIONS IMPACTING CUSTOMER BUSINESS
- 5.10 INVESTMENT AND FUNDING SCENARIO
- 5.11 CASE STUDY ANALYSIS
- 5.11.1 IMPLEMENTATION OF AI-BASED VISION INSPECTION IN PLASTIC RECYCLING FACILITIES
- 5.11.2 DEPLOYMENT OF NEAR-INFRARED (NIR) SORTING IN MUNICIPAL SOLID WASTE RECYCLING
- 5.12 2025 US TARIFF
- 5.12.1 INTRODUCTION
- 5.12.2 KEY TARIFF RATES
- 5.12.3 PRICE IMPACT ANALYSIS
- 5.12.4 IMPACT ON KEY REGIONS
- 5.12.4.1 North America
- 5.12.4.2 Europe
- 5.12.4.3 Asia Pacific
- 5.12.5 IMPACT ON END USERS
6 CUSTOMER LANDSCAPE & BUYER BEHAVIOR
- 6.1 DECISION-MAKING PROCESS
- 6.2 KEY STAKEHOLDERS AND BUYING CRITERIA
- 6.2.1 KEY STAKEHOLDERS IN BUYING PROCESS
- 6.2.2 BUYING CRITERIA
- 6.3 ADOPTION BARRIERS & INTERNAL CHALLENGES
- 6.4 UNMET NEEDS IN VARIOUS APPLICATIONS
- 6.5 MARKET PROFITIBILITY
- 6.5.1 REVENUE POTENTIAL
- 6.5.2 COST DYNAMICS
- 6.5.3 MARGIN OPPORTUNITIES IN KEY END-USE INDUSTRIES
7 TECHNOLOGICAL ADVANCEMENTS, AI-DRIVEN IMPACT, PATENTS, INNOVATIONS, AND FUTURE APPLICATIONS
- 7.1 KEY EMERGING TECHNOLOGIES
- 7.1.1 AI-POWERED OPTICAL SORTING & COMPUTER VISION INSPECTION
- 7.1.2 HYPERSPECTRAL IMAGING & MULTI-SENSOR MATERIAL DETECTION
- 7.1.3 ROBOTIC WASTE SORTING ARMS WITH AI GUIDANCE
- 7.2 COMPLEMENTARY TECHNOLOGIES
- 7.2.1 X-RAY & XRF-BASED DENSITY INSPECTION SYSTEMS
- 7.2.2 DIGITAL TWIN & PREDICTIVE MAINTENANCE ANALYTICS
- 7.3 ADJACENT TECHNOLOGIES
- 7.3.1 AI-ENABLED ROBOTIC SYSTEMS FOR HEAVY WASTE HANDLING
- 7.3.2 IOT AND AI-POWERED DIGITAL MONITORING TECHNOLOGY
- 7.4 TECHNOLOGY/PRODUCT ROADMAP
- 7.4.1 SHORT-TERM (2025-2027) | FOUNDATION & EARLY COMMERCIALIZATION
- 7.4.2 MID-TERM (2027-2030) | EXPANSION & INTEGRATION
- 7.4.3 LONG-TERM (2030-2035+) | SMART & SUSTAINABLE INSPECTION SYSTEMS
- 7.5 PATENT ANALYSIS
- 7.5.1 LEGAL STATUS OF PATENTS
- 7.5.2 JURISDICTION ANALYSIS
- 7.6 FUTURE APPLICATIONS
- 7.6.1 AI-DRIVEN WASTE SORTING SYSTEMS
- 7.6.2 AUTOMATED OPTICAL & SENSOR-BASED INSPECTION
- 7.6.3 ROBOTIC RECYCLING & MATERIAL RECOVERY SYSTEMS
- 7.6.4 SMART WASTE MANAGEMENT INFRASTRUCTURE
- 7.6.5 ADVANCED MATERIAL RECOVERY TECHNOLOGIES
- 7.7 IMPACT OF AI/GEN AI ON RECYCLING INSPECTION MARKET
- 7.7.1 TOP USE CASES AND MARKET POTENTIAL
- 7.7.2 BEST PRACTICES IN RECYCLING INSPECTION PROCESSING
- 7.7.3 CASE STUDIES OF AI IMPLEMENTATION IN RECYCLING INSPECTION MARKET
- 7.7.4 INTERCONNECTED ADJACENT ECOSYSTEM AND IMPACT ON MARKET PLAYERS
- 7.7.5 CLIENTS' READINESS TO ADOPT GENERATIVE AI IN RECYCLING INSPECTION MARKET
8 SUSTAINABILITY AND REGULATORY LANDSCAPE
- 8.1 REGIONAL REGULATIONS & COMPLIANCE
- 8.1.1 REGULATORY BODIES, GOVERNMENT AGENCIES, AND OTHER ORGANIZATIONS
- 8.1.2 INDUSTRY STANDARDS
- 8.2 SUSTAINABILITY INITIATIVES
- 8.2.1 MATERIAL PERFORMANCE, ENVIRONMENT, AND SAFETY INITIATIVES
- 8.2.1.1 Carbon impact reduction and eco-material strategies
- 8.2.1.2 Eco applications
- 8.2.1 MATERIAL PERFORMANCE, ENVIRONMENT, AND SAFETY INITIATIVES
- 8.3 SUSTAINABILITY IMPACT & REGULATORY POLICY INITIATIVES
- 8.4 CERTIFICATIONS, LABELING, AND ECO-STANDARDS
9 RECYCLING INSPECTION MARKET, BY MATERIAL RECYCLED
- 9.1 INTRODUCTION
- 9.2 WASTE PLASTICS
- 9.2.1 HIGH COMPLEXITY OF MATERIAL COMPOSITION AND INCREASING DEMAND FOR HIGH-PURITY RECYCLATES DRIVING ADOPTION
- 9.3 PAPER
- 9.3.1 SORTING COMPLEXITY OF PAPER FUELING DEMAND FOR RECYCLING INSPECTION
- 9.4 METALS
- 9.4.1 DEMAND FOR ADVANCED INSPECTION AND SORTING TO DRIVE MARKET GROWTH
- 9.5 GLASS
- 9.5.1 NEED FOR HIGH PURITY RECYCLING TO SUPPORT MARKET GROWTH
- 9.6 OTHER MATERIALS RECYCLED
10 RECYCLING INSPECTION MARKET, BY INSPECTION TECHNOLOGY
- 10.1 INTRODUCTION
- 10.2 X-RAY INSPECTION SYSTEM
- 10.2.1 HIGH ACCURACY IN CONTAMINANT DETECTION, MATERIAL CHARACTERIZATION TO DRIVE DEMAND
- 10.3 METAL DETECTION SYSTEM
- 10.3.1 OFFER HIGH ACCURACY, FAST RESPONSE TIMES, AND EFFECTIVE EQUIPMENT PROTECTION CAPABILITIES
- 10.4 VISION INSPECTION SYSTEM
- 10.4.1 UTILIZATION OF AI TECHNOLOGY FOR ACCURATE AND EFFICIENT CLASSIFICATION OF MATERIALS TO INCREASE ADOPTION
- 10.5 NEAR-INFRARED SORTING
- 10.5.1 NEED FOR HIGH-PRECISION MATERIAL IDENTIFICATION, AUTOMATED SORTING, AND ADVANCED SPECTROSCOPIC ANALYSIS CAPABILITIES TO DRIVE MARKET
- 10.6 OTHER INSPECTION TECHNOLOGIES
11 RECYCLING INSPECTION MARKET, BY END-USE FACILITY
- 11.1 INTRODUCTION
- 11.2 PLASTIC RECYCLING PLANTS
- 11.2.1 NEED FOR ADVANCED POLYMER SEPARATION, FLAKE QUALITY CONTROL, AND CONTAMINANT DETECTION TO DRIVE GROWTH
- 11.3 PAPER RECYCLING PLANTS
- 11.3.1 DEMAND FOR EFFICIENCY IN FIBER PURITY OPTIMIZATION, CONTAMINANT DETECTION, AND MATERIAL QUALITY CONTROL TO DRIVE MARKET
- 11.4 MATERIAL RECOVERY FACILITIES
- 11.4.1 EMPHASIS ON REDUCING LANDFILL WASTE AND INCREASING RECYCLING RATES TO DRIVE ADOPTION
- 11.5 INTEGRATED RECYCLING PLANTS
- 11.5.1 NEED TO ALIGN WITH CIRCULAR ECONOMY INITIATIVES TO SUPPORT MARKET GROWTH
12 RECYCLING INSPECTION MARKET, BY REGION
- 12.1 INTRODUCTION
- 12.2 NORTH AMERICA
- 12.2.1 US
- 12.2.1.1 Stringent recycling regulations and increasing automation to drive market
- 12.2.2 CANADA
- 12.2.2.1 Strong government initiatives and circular economy focus to support market growth
- 12.2.3 MEXICO
- 12.2.3.1 Growing waste generation and improving recycling infrastructure to fuel growth
- 12.2.1 US
- 12.3 EUROPE
- 12.3.1 GERMANY
- 12.3.1.1 Strong regulatory framework and advanced recycling infrastructure to drive market
- 12.3.2 UK
- 12.3.2.1 Stringent recycling targets and increasing focus on waste efficiency to drive market
- 12.3.3 FRANCE
- 12.3.3.1 Strong circular economy policies and government-led recycling initiatives to support market growth
- 12.3.4 ITALY
- 12.3.4.1 Growing focus on waste segregation and EU compliance targets to fuel demand
- 12.3.5 SPAIN
- 12.3.5.1 Increasing recycling targets and infrastructure modernization to drive market
- 12.3.6 REST OF EUROPE
- 12.3.1 GERMANY
- 12.4 ASIA PACIFIC
- 12.4.1 CHINA
- 12.4.1.1 Strong government regulations and rapid expansion of recycling infrastructure to drive market
- 12.4.2 JAPAN
- 12.4.2.1 Advanced waste management systems and high automation adoption to fuel growth
- 12.4.3 INDIA
- 12.4.3.1 Rapid urbanization and government-led waste management initiatives to drive market
- 12.4.4 SOUTH KOREA
- 12.4.4.1 Strong recycling policies and advanced waste management infrastructure to drive market
- 12.4.5 REST OF ASIA PACIFIC
- 12.4.1 CHINA
- 12.5 MIDDLE EAST & AFRICA
- 12.5.1 GCC COUNTRIES
- 12.5.1.1 Saudi Arabia
- 12.5.1.1.1 Vision 2030 and increasing focus on waste management infrastructure to drive demand
- 12.5.1.2 UAE
- 12.5.1.2.1 Sustainability initiatives and smart waste management investments to support market growth
- 12.5.1.3 Rest of GCC countries
- 12.5.1.1 Saudi Arabia
- 12.5.2 SOUTH AFRICA
- 12.5.2.1 Growing waste management challenges and increasing focus on recycling efficiency to drive market
- 12.5.3 REST OF MIDDLE EAST & AFRICA
- 12.5.1 GCC COUNTRIES
- 12.6 SOUTH AMERICA
- 12.6.1 BRAZIL
- 12.6.1.1 Increasing waste volumes and gradual modernization of recycling infrastructure to drive market
- 12.6.2 ARGENTINA
- 12.6.2.1 Improving regulatory focus and development of recycling infrastructure to support market growth
- 12.6.3 REST OF SOUTH AMERICA
- 12.6.1 BRAZIL
13 COMPETITIVE LANDSCAPE
- 13.1 INTRODUCTION
- 13.2 KEY PLAYERS' STRATEGIES/RIGHT TO WIN
- 13.3 REVENUE ANALYSIS
- 13.4 MARKET SHARE ANALYSIS
- 13.5 PRODUCT/BRAND COMPARISON
- 13.6 COMPANY EVALUATION MATRIX: KEY PLAYERS, 2024
- 13.6.1 STARS
- 13.6.2 EMERGING LEADERS
- 13.6.3 PERVASIVE PLAYERS
- 13.6.4 PARTICIPANTS
- 13.6.5 COMPANY FOOTPRINT: KEY PLAYERS, 2025
- 13.6.5.1 Company footprint
- 13.6.5.2 Region footprint
- 13.6.5.3 Inspection technology footprint
- 13.6.5.4 Material recycled footprint
- 13.6.5.5 End-use facility footprint
- 13.7 COMPANY EVALUATION MATRIX: STARTUPS/SMES, 2025
- 13.7.1 PROGRESSIVE COMPANIES
- 13.7.2 RESPONSIVE COMPANIES
- 13.7.3 DYNAMIC COMPANIES
- 13.7.4 STARTING BLOCKS
- 13.7.5 COMPETITIVE BENCHMARKING: STARTUPS/SMES, 2025
- 13.7.5.1 Detailed list of key startups/SMEs
- 13.7.5.2 Competitive benchmarking of key startups/SMEs
- 13.8 COMPANY VALUATION & FINANCIAL METRICS
- 13.8.1 FINANCIAL METRICS
- 13.8.2 COMPANY VALUATION
- 13.8.3 ENTERPRISE VALUATION
- 13.9 COMPETITIVE SCENARIO
- 13.9.1 PRODUCT LAUNCHES
- 13.9.2 DEALS
- 13.9.3 EXPANSIONS
14 COMPANY PROFILES
- 14.1 KEY PLAYERS
- 14.1.1 TOMRA SYSTEMS ASA
- 14.1.1.1 Business overview
- 14.1.1.2 Products/Solutions/Services offered
- 14.1.1.3 Recent developments
- 14.1.1.3.1 Product launches
- 14.1.1.3.2 Deals
- 14.1.1.3.3 Expansions
- 14.1.1.4 MnM view
- 14.1.1.4.1 Right to win
- 14.1.1.4.2 Strategic choices
- 14.1.1.4.3 Weaknesses & competitive threats
- 14.1.2 STEINERT GMBH
- 14.1.2.1 Business overview
- 14.1.2.2 Products/Solutions/Services offered
- 14.1.2.3 Recent developments
- 14.1.2.3.1 Deals
- 14.1.2.3.2 Expansions
- 14.1.2.4 MnM view
- 14.1.2.4.1 Right to win
- 14.1.2.4.2 Strategic choices
- 14.1.2.4.3 Weaknesses & competitive threats
- 14.1.3 PELLENC ST
- 14.1.3.1 Business overview
- 14.1.3.2 Products/Solutions/Products offered
- 14.1.3.3 Recent developments
- 14.1.3.3.1 Product launches
- 14.1.3.3.2 Expansions
- 14.1.3.3.3 Deals
- 14.1.3.4 MnM view
- 14.1.3.4.1 Right to win
- 14.1.3.4.2 Strategic choices
- 14.1.3.4.3 Weaknesses & competitive threats
- 14.1.4 BUHLER GROUP
- 14.1.4.1 Business overview
- 14.1.4.2 Products/Solutions/Services offered
- 14.1.4.3 Recent developments
- 14.1.4.3.1 Deals
- 14.1.4.3.2 Expansions
- 14.1.4.4 MnM view
- 14.1.4.4.1 Right to win
- 14.1.4.4.2 Strategic choices
- 14.1.4.4.3 Weaknesses & competitive threats
- 14.1.5 HEFEI MEYER OPTOELECTRONIC TECHNOLOGY INC.
- 14.1.5.1 Business overview
- 14.1.5.2 Products/Solutions/Services offered
- 14.1.5.3 Recent developments
- 14.1.5.3.1 Product launches
- 14.1.5.3.2 Deals
- 14.1.5.4 MnM view
- 14.1.5.4.1 Right to win
- 14.1.5.4.2 Strategic choices
- 14.1.5.4.3 Weaknesses & competitive threats
- 14.1.6 MSS, LLC
- 14.1.6.1 Business overview
- 14.1.6.2 Products/Solutions/Services offered
- 14.1.6.3 Recent developments
- 14.1.6.3.1 Deals
- 14.1.6.3.2 Expansions
- 14.1.6.4 MnM view
- 14.1.7 BUNTING
- 14.1.7.1 Business overview
- 14.1.7.2 Products/Solutions/Services offered
- 14.1.7.3 Recent developments
- 14.1.7.3.1 Product launches
- 14.1.7.3.2 Deals
- 14.1.7.4 MnM view
- 14.1.8 CASSEL MESSTECHNIK GMBH
- 14.1.8.1 Business overview
- 14.1.8.2 Products/Solutions/Services offered
- 14.1.8.3 Recent developments
- 14.1.8.3.1 Product launches
- 14.1.8.4 MnM view
- 14.1.9 TEREX CORPORATION (ZENROBOTICS)
- 14.1.9.1 Business overview
- 14.1.9.2 Products/Solutions/Services offered
- 14.1.9.3 Recent developments
- 14.1.9.3.1 Product launches
- 14.1.9.3.2 Deals
- 14.1.9.3.3 Expansions
- 14.1.9.4 MnM view
- 14.1.10 SESOTEC GROUP
- 14.1.10.1 Business overview
- 14.1.10.2 Products/Solutions/Services offered
- 14.1.10.3 Recent developments
- 14.1.10.3.1 Deals
- 14.1.10.4 MnM view
- 14.1.1 TOMRA SYSTEMS ASA
- 14.2 OTHER PLAYERS
- 14.2.1 AMP
- 14.2.2 CP MANUFACTURING, LLC
- 14.2.3 BULK HANDLING SYSTEMS
- 14.2.4 MACHINEX INDUSTRIES INC.
- 14.2.5 REDWAVE
- 14.2.6 CWM INTERNATIONAL
- 14.2.7 BALTIC CONTROL
- 14.2.8 VIDA INSPECTION GMBH
- 14.2.9 GLOBAL MARINE INSPECTION
- 14.2.10 GQS GLOBAL
- 14.2.11 MONOW INTERNATIONAL LIMITED
- 14.2.12 VECOPLAN LLC
- 14.2.13 HUMBER INSPECTION INTERNATIONAL
- 14.2.14 TCRC
- 14.2.15 NMCI GROUP
15 RESEARCH METHODOLOGY
- 15.1 RESEARCH DATA
- 15.1.1 SECONDARY DATA
- 15.1.1.1 Key data from secondary sources
- 15.1.2 PRIMARY DATA
- 15.1.2.1 Key data from primary sources
- 15.1.2.2 Key industry insights
- 15.1.2.3 Breakdown of primary interviews
- 15.1.1 SECONDARY DATA
- 15.2 MARKET SIZE ESTIMATION
- 15.2.1 BOTTOM-UP APPROACH
- 15.2.2 TOP-DOWN APPROACH
- 15.3 DATA TRIANGULATION
- 15.4 STUDY ASSUMPTIONS
- 15.5 RESEARCH LIMITATIONS
16 APPENDIX
- 16.1 DISCUSSION GUIDE
- 16.2 KNOWLEDGESTORE: MARKETSANDMARKETS' SUBSCRIPTION PORTAL
- 16.3 CUSTOMIZATION OPTIONS
- 16.4 RELATED REPORTS
- 16.5 AUTHOR DETAILS
