|
시장보고서
상품코드
2033997
지식 그래프 시장 : 솔루션별(기업용 지식 그래프 플랫폼, 그래프 데이터베이스 엔진, 지식 관리 툴셋), 모델 유형별(RDF, 트리플 스토어, 레이블 프로퍼티 그래프) - 세계 예측(-2032년)Knowledge Graph Market by Solution (Enterprise Knowledge Graph Platform, Graph Database Engine, Knowledge Management Toolset), Model Type (Resource Description Framework (RDF) Triple Stores, Labeled Property Graph) - Global Forecast to 2032 |
||||||

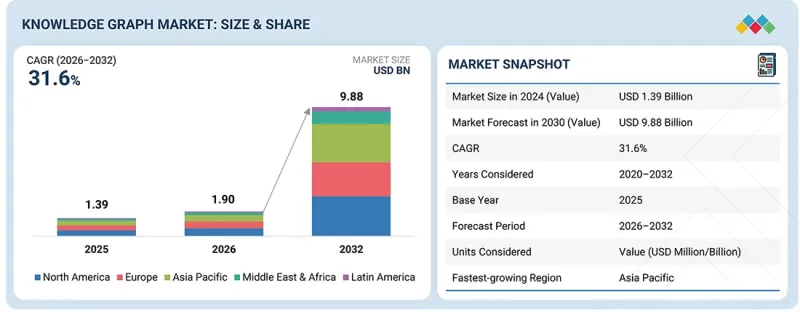
지식 그래프 시장 규모는 2026년에 19억 달러, 2032년에 98억 8,000만 달러에 달할 것으로 추정되어 있으며, 31.6%의 CAGR로 성장할 것으로 전망됩니다.
| 조사 범위 | |
|---|---|
| 조사 대상 기간 | 2020-2032년 |
| 기준 연도 | 2025년 |
| 예측 기간 | 2026-2032년 |
| 대상 단위 | 금액(달러) |
| 부문 | 제공, 모델 유형, 용도, 업계별 |
| 대상 지역 | 북미, 유럽, 아시아태평양, 중동 및 아프리카, 라틴아메리카 |
이 시장의 성장은 주로 조직에서 대량의 상호 연관된 데이터를 관리하고, 이를 통해 의미 있는 인사이트를 추출해야 할 필요성이 증가함에 따라 성장하고 있습니다. 기업이 구조화된 데이터와 비정형 데이터를 모두 처리해야 하는 상황에서 지식 그래프는 정보의 통합된 컨텍스트 뷰를 제공하기 위해 채택되고 있습니다.
AI의 활용으로 지식그래프의 개발 및 도입은 더욱 가속화되고 있습니다. 자연어 처리(NLP), 머신러닝 등의 기술을 활용하여 데이터 내 엔티티, 관계, 패턴을 자동으로 식별하는 데 활용되고 있습니다. 이를 통해 수작업을 통한 개입의 필요성을 줄이고, 지식그래프 작성의 효율성과 정확성을 향상시킬 수 있습니다. 동시에 지식 그래프는 생성형 AI 모델과 함께 사용되어 구조화된 컨텍스트와 보다 확실한 데이터 기반을 제공함으로써 생성된 결과의 관련성과 신뢰성을 높입니다.
조직에서는 시맨틱 검색, 추천 시스템, 부정행위 탐지, 고객 데이터 통합 등의 용도로 지식 그래프를 활용하는 사례가 증가하고 있습니다. 데이터 기반 의사결정에 대한 관심이 높아지면서 지식 그래프는 현대 데이터 아키텍처에서 중요한 요소로 자리 잡고 있습니다.
"솔루션별로는 예측 기간 동안 그래프 데이터베이스 엔진 부문이 가장 큰 시장 규모를 차지할 것으로 예상됩니다."
그래프 데이터베이스 엔진은 연결된 데이터를 저장하고 관리하기 위한 핵심 기술이기 때문에 시장에서 가장 큰 점유율을 차지할 것으로 예상됩니다. 데이터를 테이블 형태로 정리하는 기존 데이터베이스와 달리 그래프 데이터베이스는 데이터를 노드와 관계로 표현하기 때문에 데이터 포인트 간의 연결이 중요한 용도에 적합합니다. 이러한 데이터베이스는 복잡한 데이터세트에 대한 빠른 쿼리 실행과 탐색을 가능하게 하여 조직이 보다 효율적으로 관계를 분석할 수 있도록 돕습니다. 소셜 네트워크, 추천 엔진, 부정행위 탐지, 네트워크 분석 등의 용도로 널리 활용되고 있습니다. 그래프 데이터베이스는 관계형 쿼리를 처리하기 위해 특별히 설계된 Cypher, SPARQL과 같은 쿼리 언어를 지원합니다.
최근 그래프 데이터베이스 엔진은 AI 및 고급 분석과의 통합을 지원하도록 진화하고 있습니다. 실시간 처리, 그래프 알고리즘, 머신러닝 모델과의 통합 등의 기능으로 인해 산업을 불문하고 도입이 더욱 확대되고 있습니다.
"예측 기간 동안 서비스 부문이 가장 높은 성장률을 기록할 것으로 예상"
예측 기간 동안 서비스 부문은 가장 높은 성장률을 보일 것으로 예상됩니다. 이는 조직이 지식그래프 솔루션을 효과적으로 도입하고 관리하기 위해 외부의 전문 지식이 필요하기 때문입니다. 지식그래프 도입에는 복잡한 데이터 통합, 모델링, 시스템 설계가 수반되는 경우가 많기 때문에 전문 서비스에 대한 수요가 증가하고 있습니다. 전문 서비스에는 컨설팅, 설계, 구축 지원이 포함되며, 조직이 사용 사례를 정의하고, 데이터 모델을 구축하며, 지식 그래프를 기존 시스템과 통합할 수 있도록 지원합니다. 이러한 서비스는 솔루션이 비즈니스 요구사항에 부합하고 기대하는 성과를 달성할 수 있도록 보장하는 데 중요합니다. 반면, 매니지드 서비스는 지식그래프 플랫폼의 지속적인 유지보수 및 최적화에 중점을 두고 있습니다. 여기에는 시스템 성능 모니터링, 데이터 품질 보장, 업데이트 및 확장성 관리 등이 포함됩니다. 조직이 내부 업무 부담을 줄이고 핵심 비즈니스 활동에 집중하고자 하는 가운데, 매니지드 서비스에 대한 수요는 꾸준히 증가할 것으로 예상됩니다.
"예측 기간 동안 아시아태평양이 가장 높은 시장 성장률을 기록할 것으로 예상"
아시아태평양은 예측 기간 동안 가장 높은 성장률을 보일 것으로 예상됩니다. 이러한 성장은 디지털 전환에 대한 투자 확대, AI 기술 도입 확대, 지역 전반의 데이터 기반 이니셔티브 확대에 힘입어 성장세를 보이고 있습니다. 중국, 인도, 일본, 싱가포르 등의 국가들은 의사결정과 업무 효율성 향상을 위해 첨단 데이터 기술을 적극적으로 도입하고 있습니다. 지식 그래프는 복잡한 데이터를 관리하고 더 나은 인사이트를 얻기 위해 은행, 의료, 통신, E-Commerce 등의 산업에서 활용되고 있습니다. 또한, 클라우드 인프라의 가용성과 이 지역의 기술 제공업체 생태계가 확대되면서 지식그래프 솔루션의 도입이 증가하고 있습니다. 조직은 점점 더 통합된 데이터 환경 구축에 집중하고 있으며, 지식 그래프는 서로 다른 시스템 간의 데이터를 연결하여 보다 현명한 의사결정을 내릴 수 있도록 하는 데 중요한 역할을 하고 있습니다.
세계의 지식그래프 시장을 조사했으며, 시장 개요, 시장 성장에 영향을 미치는 각종 영향요인 분석, 기술·특허 동향, 법·규제 환경, 사례 분석, 시장 규모 추정 및 예측, 각종 부문별·지역별·주요 국가별 상세 분석, 경쟁 구도, 주요 기업 개요 등의 정보를 정리하여 전해드립니다.
자주 묻는 질문
목차
제1장 소개
제2장 주요 요약
제3장 주요 인사이트
제4장 시장 개요
제5장 업계 동향
제6장 기술의 진보, AI에 의한 영향, 특허, 혁신, 향후 응용
제7장 규제 상황과 지속가능성에 대한 대처
제8장 고객 상황과 구매 행동
제9장 지식 그래프 시장 : 제공별
제10장 지식 그래프 시장 : 모델 유형별
제11장 지식 그래프 시장 : 용도별
제12장 지식 그래프 시장 : 산업별
제13장 지식 그래프 시장 : 지역별
제14장 경쟁 구도
제15장 기업 개요
제16장 조사 방법
제17장 부록
KSM 26.05.27The knowledge graph market is estimated at USD 1.90 billion in 2026 and USD 9.88 billion by 2032, growing at a compound annual growth rate (CAGR) of 31.6%.
| Scope of the Report | |
|---|---|
| Years Considered for the Study | 2020-2032 |
| Base Year | 2025 |
| Forecast Period | 2026-2032 |
| Units Considered | Value (USD Million/Billion) |
| Segments | By Offering, By Model Type, By Application, By Vertical |
| Regions covered | North America, Europe, Asia Pacific, Middle East & Africa, Latin America |
The growth of the market is largely driven by the increasing need among organizations to manage large volumes of interconnected data and extract meaningful insights from it. As enterprises continue to deal with both structured and unstructured data, knowledge graphs are being adopted to provide a unified and contextual view of information.
The use of artificial intelligence has further accelerated the development and adoption of knowledge graphs. Technologies such as natural language processing (NLP) and machine learning are being used to automatically identify entities, relationships, and patterns within data. This reduces the need for manual intervention and improves the efficiency and accuracy of knowledge graph creation. At the same time, knowledge graphs are being used alongside generative AI models to improve the relevance and reliability of outputs by providing structured context and better data grounding.
Organizations are increasingly using knowledge graphs for applications such as semantic search, recommendation systems, fraud detection, and customer data integration. With the growing focus on data-driven decision-making, knowledge graphs are gradually becoming an important part of modern data architectures.
"By solution, the graph database engine segment is estimated to hold the largest market size during the forecast period."
Graph database engines are expected to account for the largest share of the knowledge graph market, as they form the core technology for storing and managing connected data. Unlike traditional databases that organize data in tables, graph databases represent data as nodes and relationships, making them well-suited for applications where connections between data points are critical. These databases allow faster querying and traversal of complex datasets, enabling organizations to analyze relationships more efficiently. They are widely used in applications such as social networks, recommendation engines, fraud detection, and network analysis. Graph databases support query languages such as Cypher and SPARQL, which are specifically designed to handle relationship-based queries.
In recent years, graph database engines have also evolved to support integration with AI and advanced analytics. Capabilities such as real-time processing, graph algorithms, and integration with machine learning models are further increasing their adoption across industries.
"The services segment to register the fastest growth rate during the forecast period."
The services segment is projected to grow at the highest rate during the forecast period, as organizations require external expertise to implement and manage knowledge graph solutions effectively. Knowledge graph deployments often involve complex data integration, modeling, and system design, which increases the demand for professional services. Professional services include consulting, design, and implementation support, helping organizations define use cases, build data models, and integrate knowledge graphs with existing systems. These services are important for ensuring that the solutions are aligned with business requirements and deliver expected outcomes. Managed services, on the other hand, focus on the ongoing maintenance and optimization of knowledge graph platforms. This includes monitoring system performance, ensuring data quality, and managing updates and scalability. As organizations look to reduce internal workload and focus on core business activities, the demand for managed services is expected to increase steadily.
"Asia Pacific to witness the highest market growth rate during the forecast period."
Asia Pacific is expected to witness the highest growth rate in the knowledge graph market during the forecast period. This growth is driven by increasing investments in digital transformation, growing adoption of AI technologies, and the expansion of data-driven initiatives across the region. Countries such as China, India, Japan, and Singapore are actively adopting advanced data technologies to improve decision-making and operational efficiency. Knowledge graphs are being used across industries such as banking, healthcare, telecommunications, and e-commerce to manage complex data and gain better insights. In addition, the availability of cloud infrastructure and the growing ecosystem of technology providers in the region are supporting the adoption of knowledge graph solutions. Organizations are increasingly focusing on building integrated data environments, where knowledge graphs play a key role in connecting data across different systems and enabling more informed decision-making.
In-depth interviews have been conducted with chief executive officers (CEOs), Directors, and other executives from various key organizations operating in the Knowledge Graph market.
- By Company Type: Tier 1 - 40%, Tier 2 - 35%, and Tier 3 - 25%
- By Designation: C-level - 40%, D-level - 35%, and Others - 25%
- By Region: North America - 35%, Europe - 40%, Asia Pacific - 20, RoW - 5%
The major players in the knowledge graph market include IBM Corporation (US), Oracle (US), Microsoft Corporation (US), AWS (US), Neo4j (US), Progress Software (US), TigerGraph (US), Stardog (US), Franz Inc (US), Openlink Software (US), Graphwise (US), Altair (US), ArangoDB (US), Fluree (US), Memgraph (UK), Datavid (UK), SAP (Germany), GraphBase (Australia), Metaphacts (Germany), Relational AI (US), Wisecube (US), Smabbler (Poland), Onlim (Austria), Graphaware (UK), Diffbot (US), Eccenca (Germany), and ESRI (US). These players have adopted various growth strategies, such as partnerships, agreements and collaborations, new product launches, enhancements, and acquisitions to expand their knowledge graph market footprint.
Research Coverage
The market study covers the knowledge graph market size across different segments. It aims at estimating the market size and the growth potential across various segments, including by offering (solutions (enterprise knowledge graph platform, graph database engine, knowledge management toolset)), services (professional services, managed services), by model type (resource description framework [RDF] triple stores, labeled property graph [LPG], other model type), by applications (data governance and master data management, data analytics and business intelligence, knowledge and content management , virtual assistants, self-service data and digital asset discovery, product and configuration management, infrastructure and asset management, process optimization and resource management, risk management, compliance, regulatory reporting, market and customer intelligence, sales optimization, other applications), by vertical (banking, financial services, and insurance [BFSI]; retail and eCommerce; healthcare, life sciences, and pharmaceuticals; telecom and technology; government; manufacturing and automotive; media & entertainment, energy, utilities, and infrastructure; travel and hospitality, transportation and logistics; other verticals), and region (North America, Europe, Asia Pacific, the Middle East & Africa, and Latin America). The study includes an in-depth competitive analysis of the leading market players, their company profiles, key observations related to product and business offerings, recent developments, and market strategies.
Key Benefits of Buying the Report
The report will help the market leaders/new entrants with information on the closest approximations of the global knowledge graph market's revenue numbers and subsegments. This report will help stakeholders understand the competitive landscape and gain more insights to position their businesses better and plan suitable go-to-market strategies. Moreover, the report will provide insights for stakeholders to understand the market's pulse and provide them with information on key market drivers, restraints, challenges, and opportunities.
The report provides insights into the following pointers:
Analysis of key drivers (rising demand for AI/generative AI solutions, rapid growth in data volume and complexity, growing demand for semantic search), restraints (data quality and Integration challenges, scalability Issues) opportunities (data unification and rapid proliferation of knowledge graphs, increasing adoption in healthcare and life sciences), and challenges (lack of expertise and awareness, standardization and interoperability) influencing the growth of the knowledge graph market.
Product Development/Innovation: Detailed insights on upcoming technologies, research & development activities, and new product & service launches in the knowledge graph market.
Market Development: The report provides comprehensive information about lucrative markets and analyses the knowledge graph market across various regions.
Market Diversification: Exhaustive information about new products & services, untapped geographies, recent developments, and investments in the knowledge graph market.
Competitive Assessment: In-depth assessment of market shares, growth strategies and service offerings of leading include IBM Corporation (US), Oracle (US), Microsoft Corporation (US), AWS (US), Neo4j (US), Progress Software (US), TigerGraph (US), Stardog (US), Franz Inc (US), Openlink Software (US), Graphwise (US), Altair (US), ArangoDB (US), Fluree (US), Memgraph (UK), Datavid (UK), SAP (Germany), GraphBase (Australia), Metaphacts (Germany), Relational AI (US), Wisecube (US), Smabbler (Poland), Onlim (Austria), Graphaware (UK), Diffbot (US), Eccenca (Germany), and ESRI (US).
TABLE OF CONTENTS
1 INTRODUCTION
- 1.1 STUDY OBJECTIVES
- 1.2 MARKET DEFINITION
- 1.3 STUDY SCOPE
- 1.3.1 MARKET SEGMENTATION
- 1.3.2 INCLUSIONS AND EXCLUSIONS
- 1.3.3 YEARS CONSIDERED
- 1.4 CURRENCY CONSIDERED
- 1.5 STAKEHOLDERS
- 1.6 SUMMARY OF CHANGES
2 EXECUTIVE SUMMARY
- 2.1 MARKET HIGHLIGHTS AND KEY INSIGHTS
- 2.2 KEY MARKET PARTICIPANTS: MAPPING OF STRATEGIC DEVELOPMENTS
- 2.3 DISRUPTIVE TRENDS IN KNOWLEDGE GRAPH MARKET
- 2.4 REGIONAL SNAPSHOT: MARKET SIZE, GROWTH RATE, AND FORECAST
3 PREMIUM INSIGHTS
- 3.1 ATTRACTIVE OPPORTUNITIES FOR PLAYERS IN KNOWLEDGE GRAPH MARKET
- 3.2 KNOWLEDGE GRAPH MARKET, BY OFFERING
- 3.3 KNOWLEDGE GRAPH MARKET, BY SERVICE
- 3.4 KNOWLEDGE GRAPH MARKET, BY SOLUTION
- 3.5 KNOWLEDGE GRAPH MARKET, BY APPLICATION
- 3.6 KNOWLEDGE GRAPH MARKET, BY VERTICAL
- 3.7 NORTH AMERICA: KNOWLEDGE GRAPH MARKET, BY OFFERING AND MODEL TYPE
4 MARKET OVERVIEW
- 4.1 INTRODUCTION
- 4.2 MARKET DYNAMICS
- 4.2.1 DRIVERS
- 4.2.1.1 Increase in adoption of knowledge graphs as grounding layer for generative AI and LLMs
- 4.2.1.2 Rapid growth in data volume and complexity
- 4.2.1.3 Growth in demand for semantic search and contextual information retrieval
- 4.2.1.4 Rise in demand for agentic AI and dynamic knowledge systems
- 4.2.1.5 Increase in regulatory focus on explainable and auditable AI systems
- 4.2.2 RESTRAINTS
- 4.2.2.1 Data quality and integration complexity across heterogeneous data sources
- 4.2.2.2 High implementation complexity and challenges in scaling from pilot to enterprise deployment
- 4.2.2.3 Scalability limitations and infrastructure requirements
- 4.2.2.4 Lack of standardization and interoperability across platforms
- 4.2.3 OPPORTUNITIES
- 4.2.3.1 Knowledge graphs emerging as core infrastructure for enterprise AI ecosystems
- 4.2.3.2 Increase in demand for data unification and semantic interoperability
- 4.2.3.3 Expansion of adoption in healthcare and life sciences
- 4.2.3.4 AI governance and compliance-driven adoption
- 4.2.4 CHALLENGES
- 4.2.4.1 Lack of expertise and awareness
- 4.2.4.2 Standardization and interoperability challenges
- 4.2.4.3 Difficulty in demonstrating ROI across multiple use cases
- 4.2.4.4 Limitations in automated knowledge graph construction from unstructured data
- 4.2.4.5 Talent scarcity and need for cross-domain expertise
- 4.2.1 DRIVERS
- 4.3 INTERCONNECTED MARKETS AND CROSS-SECTOR OPPORTUNITIES
- 4.3.1 INTERCONNECTED MARKETS
- 4.3.2 CROSS-SECTOR OPPORTUNITIES
- 4.4 STRATEGIC MOVES BY TIER-1/2/3 PLAYERS
5 INDUSTRY TRENDS
- 5.1 PORTER'S FIVE FORCES ANALYSIS
- 5.1.1 THREAT OF NEW ENTRANTS
- 5.1.2 THREAT OF SUBSTITUTES
- 5.1.3 BARGAINING POWER OF SUPPLIERS
- 5.1.4 BARGAINING POWER OF BUYERS
- 5.1.5 INTENSITY OF COMPETITIVE RIVALRY
- 5.2 MACROECONOMIC OUTLOOK
- 5.2.1 INTRODUCTION
- 5.2.2 GDP TRENDS AND FORECAST
- 5.2.3 TRENDS IN KNOWLEDGE GRAPH MARKET
- 5.3 SUPPLY CHAIN ANALYSIS
- 5.3.1 DATA COLLECTION & SOURCES
- 5.3.2 TECHNOLOGY DEVELOPMENT & INFRASTRUCTURE
- 5.3.3 DATA PREPARATION & INTEGRATION
- 5.3.4 ANALYTICS & AI DEVELOPMENT
- 5.3.5 SYSTEM INTEGRATION
- 5.3.6 SOLUTION DISTRIBUTION
- 5.3.7 INDUSTRY VERTICALS
- 5.4 ECOSYSTEM ANALYSIS
- 5.5 PRICING ANALYSIS
- 5.5.1 PRICE TREND OF KEY PLAYERS, BY SOLUTION
- 5.5.2 INDICATIVE PRICING ANALYSIS OF KEY PLAYERS
- 5.6 KEY CONFERENCES AND EVENTS
- 5.7 TRENDS/DISRUPTIONS IMPACTING CUSTOMER BUSINESS
- 5.8 INVESTMENT AND FUNDING SCENARIO
- 5.9 CASE STUDY ANALYSIS
- 5.9.1 TRANSMISSION SYSTEM OPERATOR LEVERAGED ONTOTEXT'S SOLUTIONS TO MODERNIZE ASSET MANAGEMENT
- 5.9.2 BOSTON SCIENTIFIC STREAMLINED MEDICAL SUPPLY CHAIN USING NEO4J'S GRAPH DATA SCIENCE SOLUTION
- 5.9.3 NATIONAL RETAIL CHAIN FROM UK ENHANCED OPERATIONAL EFFICIENCY USING TIGERGRAPHS' SOLUTION
- 5.9.4 SCHNEIDER ELECTRIC USED STARDOG TO LEAD SMART BUILDING TRANSFORMATION
- 5.9.5 MEDIA ORGANIZATION USED PROGRESS SEMAPHORE TO CLASSIFY CONTENT FOR BETTER AUDIENCE ENGAGEMENT
- 5.9.6 YAHOO7 REPRESENTED CONTENT WITHIN KNOWLEDGE GRAPH WITH ASSISTANCE OF BLAZEGRAPH
- 5.9.7 DATABASE GROUP HELPED SPRINGERMATERIALS ACCELERATE RESEARCH WITH SEMANTIC SEARCH
- 5.9.8 RFS OPTIMIZED ITS GLOBAL PRODUCT AND INVENTORY MANAGEMENT BY USING ECCENCA'S SOLUTION
- 5.10 IMPACT OF 2025 US TARIFF - KNOWLEDGE GRAPH MARKET
- 5.10.1 INTRODUCTION
- 5.10.2 KEY TARIFF RATES
- 5.10.3 PRICE IMPACT ANALYSIS
- 5.10.3.1 Strategic shifts and emerging trends
- 5.10.4 IMPACT ON COUNTRIES/REGIONS
- 5.10.4.1 US
- 5.10.4.2 China
- 5.10.4.3 Europe
- 5.10.4.4 Asia Pacific (excluding China)
- 5.10.5 IMPACT ON END-USER INDUSTRIES
- 5.10.5.1 Banking, Financial Services, and Insurance (BFSI)
- 5.10.5.2 Healthcare and Life Sciences
- 5.10.5.3 Retail and E-commerce
- 5.10.5.4 Telecom and Technology
- 5.10.5.5 Government and Public Sector
- 5.10.5.6 Manufacturing and Supply Chain
6 TECHNOLOGICAL ADVANCEMENTS, AI-DRIVEN IMPACT, PATENTS, INNOVATIONS, AND FUTURE APPLICATIONS
- 6.1 KEY TECHNOLOGIES
- 6.1.1 GRAPH DATABASES (GDB)
- 6.1.2 SEMANTIC WEB TECHNOLOGIES
- 6.1.3 GENERATIVE AI AND NATURAL LANGUAGE PROCESSING (NLP)
- 6.1.4 GRAPHRAG
- 6.2 COMPLEMENTARY TECHNOLOGIES
- 6.2.1 ARTIFICIAL INTELLIGENCE (AI) AND MACHINE LEARNING (ML)
- 6.2.2 BIG DATA
- 6.2.3 GRAPH NEURAL NETWORKS (GNNS)
- 6.2.4 CLOUD COMPUTING
- 6.2.5 VECTOR DATABASES AND FULL-TEXT SEARCH ENGINES (FTS)
- 6.2.6 MULTI-MODEL DATABASES
- 6.3 TECHNOLOGY ROADMAP
- 6.3.1 SHORT-TERM (2026-2027)
- 6.3.2 MID-TERM (2027-2028)
- 6.3.3 LONG-TERM (2029-2030+)
- 6.4 PATENT ANALYSIS
- 6.5 IMPACT OF AI/GEN AI ON KNOWLEDGE GRAPH MARKET
- 6.5.1 TOP USE CASES AND MARKET POTENTIAL
- 6.5.2 CASE STUDIES OF AI IMPLEMENTATION IN KNOWLEDGE GRAPH MARKET
- 6.5.3 INTERCONNECTED ADJACENT ECOSYSTEM AND IMPACT ON MARKET PLAYERS
- 6.5.4 CLIENTS' READINESS TO ADOPT GENERATIVE AI IN KNOWLEDGE GRAPH MARKET
7 REGULATORY LANDSCAPE AND SUSTAINABILITY INITIATIVES
- 7.1 REGIONAL REGULATIONS AND COMPLIANCE
- 7.1.1 REGULATORY BODIES, GOVERNMENT AGENCIES, AND OTHER ORGANIZATIONS
- 7.1.2 KEY REGULATIONS
- 7.1.2.1 North America
- 7.1.2.1.1 SCR 17: Artificial Intelligence Bill (California)
- 7.1.2.1.2 S1103: Artificial Intelligence Automated Decision Bill (Connecticut)
- 7.1.2.1.3 National Artificial Intelligence Initiative Act (NAIIA)
- 7.1.2.1.4 The Artificial Intelligence and Data Act (AIDA) - Canada
- 7.1.2.2 Europe
- 7.1.2.2.1 The European Union (EU) - Artificial Intelligence Act (AIA)
- 7.1.2.2.2 EU Data Governance Act
- 7.1.2.2.3 General Data Protection Regulation (Europe)
- 7.1.2.3 Asia Pacific
- 7.1.2.3.1 Interim Administrative Measures for Generative Artificial Intelligence Services (China)
- 7.1.2.3.2 National AI Strategy (Singapore)
- 7.1.2.3.3 Hiroshima AI Process Comprehensive Policy Framework (Japan)
- 7.1.2.4 Middle East & Africa
- 7.1.2.4.1 National Strategy for Artificial Intelligence (UAE)
- 7.1.2.4.2 National Artificial Intelligence Strategy (Qatar)
- 7.1.2.4.3 The AI Ethics Principles and Guidelines (Dubai)
- 7.1.2.5 Latin America
- 7.1.2.5.1 Santiago Declaration (Chile)
- 7.1.2.5.2 Brazilian Artificial Intelligence Strategy (EBIA)
- 7.1.2.1 North America
- 7.1.3 INDUSTRY STANDARDS
- 7.2 SUSTAINABILITY INITIATIVES
- 7.2.1 CARBON AND RESOURCE OPTIMIZATION ENABLED BY KNOWLEDGE GRAPHS
- 7.2.2 ECO-APPLICATIONS AND SUSTAINABILITY USE CASES
- 7.3 CERTIFICATIONS, LABELING, ECO-STANDARDS
8 CUSTOMER LANDSCAPE AND BUYER BEHAVIOR
- 8.1 DECISION-MAKING PROCESS
- 8.2 KEY STAKEHOLDERS INVOLVED IN BUYING PROCESS AND THEIR EVALUATION CRITERIA
- 8.2.1 KEY STAKEHOLDERS IN BUYING PROCESS
- 8.2.2 BUYING CRITERIA
- 8.3 ADOPTION BARRIERS AND INTERNAL CHALLENGES
- 8.4 UNMET NEEDS OF VARIOUS END-USE INDUSTRIES
9 KNOWLEDGE GRAPH MARKET, BY OFFERING
- 9.1 INTRODUCTION
- 9.2 SOLUTIONS
- 9.2.1 RISE OF AI-DRIVEN DATA ECOSYSTEMS AND SEMANTIC INTELLIGENCE ACCELERATING KNOWLEDGE GRAPH ADOPTION
- 9.2.2 ENTERPRISE KNOWLEDGE GRAPH PLATFORMS
- 9.2.2.1 Growing demand for semantic data layers and GenAI-ready knowledge platforms to enhance real-time decision intelligence
- 9.2.3 GRAPH DATABASE ENGINES
- 9.2.3.1 Advancements in real-time graph processing, vector search, and AI-native query capabilities to drive graph database evolution
- 9.2.4 KNOWLEDGE MANAGEMENT TOOLSET
- 9.2.4.1 Knowledge management toolsets to enhance operational efficiency by enabling seamless access to organizational knowledge
- 9.3 SERVICES
- 9.3.1 PROFESSIONAL SERVICES
- 9.3.2 MANAGED SERVICES
10 KNOWLEDGE GRAPH MARKET, BY MODEL TYPE
- 10.1 INTRODUCTION
- 10.2 RESOURCE DESCRIPTION FRAMEWORK (RDF) TRIPLE STORES
- 10.2.1 RDF-BASED KNOWLEDGE GRAPHS ENABLING SEMANTIC INTEROPERABILITY, DATA INTEGRATION, AND AI-READY KNOWLEDGE LAYERS
- 10.3 LABELED PROPERTY GRAPH (LPG)
- 10.3.1 HIGH-PERFORMANCE GRAPH PROCESSING, REAL-TIME ANALYTICS, AND GENAI INTEGRATION DRIVING LPG ADOPTION
- 10.4 OTHER MODEL TYPE
11 KNOWLEDGE GRAPH MARKET, BY APPLICATION
- 11.1 INTRODUCTION
- 11.2 DATA GOVERNANCE AND MASTER DATA MANAGEMENT
- 11.2.1 AI-DRIVEN DATA GOVERNANCE, SEMANTIC INTEGRATION, AND REAL-TIME DATA DISCOVERY TO ACCELERATE MARKET GROWTH
- 11.3 DATA ANALYTICS & BUSINESS INTELLIGENCE
- 11.3.1 INTEGRATION OF KNOWLEDGE FROM SEVERAL DISCIPLINES AND OFFERING PERSONALIZED RECOMMENDATIONS TO BOOST MARKET GROWTH
- 11.4 KNOWLEDGE & CONTENT MANAGEMENT
- 11.4.1 WIDESPREAD KNOWLEDGE OF INTRICATE IDEAS THROUGH CROSS-DOMAIN INFORMATION INTEGRATION TO BOOST MARKET
- 11.5 VIRTUAL ASSISTANTS, SELF-SERVICE DATA, AND DIGITAL ASSET DISCOVERY
- 11.5.1 GENAI-POWERED ASSISTANTS AND SEMANTIC DATA DISCOVERY DRIVING NEXT-GENERATION USER EXPERIENCES
- 11.6 PRODUCT & CONFIGURATION MANAGEMENT
- 11.6.1 DYNAMIC PRODUCT KNOWLEDGE GRAPHS ENABLING REAL-TIME CONFIGURATION AND AI-DRIVEN PERSONALIZATION
- 11.7 INFRASTRUCTURE & ASSET MANAGEMENT
- 11.7.1 DIGITAL TWINS AND PREDICTIVE INTELLIGENCE POWERED BY KNOWLEDGE GRAPHS ENHANCING ASSET PERFORMANCE
- 11.8 PROCESS OPTIMIZATION & RESOURCE MANAGEMENT
- 11.8.1 REAL-TIME RESOURCE UTILIZATION MONITORING ACROSS DIFFERENT PROJECTS OR DEPARTMENTS
- 11.9 RISK MANAGEMENT, COMPLIANCE, AND REGULATORY REPORTING
- 11.9.1 HELPS MAP DATA FLOWS, RELATIONSHIPS, AND CONTROLS TO IDENTIFY VULNERABILITIES AND ENSURE COMPLIANCE
- 11.10 MARKET & CUSTOMER INTELLIGENCE AND SALES OPTIMIZATION
- 11.10.1 HELPS IDENTIFY TRENDS INFORMING TARGETED MARKETING STRATEGIES, SALES OPTIMIZATIONS TAILORED EXPLICITLY FOR INDIVIDUAL CUSTOMERS OR SEGMENTS
- 11.11 OTHER APPLICATIONS
12 KNOWLEDGE GRAPH MARKET, BY VERTICAL
- 12.1 INTRODUCTION
- 12.2 BFSI
- 12.2.1 INCREASE IN NEED TO MANAGE COMPLEX DATA TO SUPPORT MARKET GROWTH
- 12.2.2 CASE STUDIES
- 12.2.2.1 Anti-money laundering (AML)
- 12.2.2.1.1 Major US Financial Institutions enhanced anti-money laundering capabilities with TigerGraph
- 12.2.2.2 Fraud detection & risk management
- 12.2.2.2.1 BNP Paribas Personal Finance achieved 20% fraud reduction with Neo4j Graph Database
- 12.2.2.3 Identity & access management
- 12.2.2.3.1 Intuit safeguarded data of 100 million customers with Neo4j
- 12.2.2.4 Risk management
- 12.2.2.4.1 Global bank enhanced trade surveillance for risk management in BFSI
- 12.2.2.5 Data integration & governance
- 12.2.2.5.1 Optimizing data integration and governance for real-time risk management and compliance
- 12.2.2.6 Operational resilience for bank IT systems
- 12.2.2.6.1 Basel Institute on Governance enhanced asset recovery and financial intelligence with knowledge graphs for global institutions with Ontotext
- 12.2.2.7 Regulatory compliance
- 12.2.2.7.1 Multinational auditing company enhanced regulatory compliance and operational efficiency with knowledge graphs with Ontotext
- 12.2.2.8 Customer 360° view
- 12.2.2.8.1 Intuit enhanced security and data protection using Neo4j knowledge graph for customer data
- 12.2.2.9 Know Your Customer (KYC) processes
- 12.2.2.9.1 AI-powered knowledge graphs streamline KYC compliance and adverse media analysis in financial services
- 12.2.2.10 Market analysis and trend detection
- 12.2.2.10.1 Leading investment bank enhanced investment insights through comprehensive company knowledge graph
- 12.2.2.11 Policy impact analysis
- 12.2.2.11.1 Delinian enhanced content production and analysis with a semantic publishing platform
- 12.2.2.12 Customer support
- 12.2.2.12.1 Banks and insurance companies improved AI-powered knowledge graphs to revolutionize customer support in BFSI
- 12.2.2.13 Self-service data & digital asset discovery and data integration & governance
- 12.2.2.13.1 HSBC revolutionized data governance with knowledge graphs in BFSI
- 12.2.2.1 Anti-money laundering (AML)
- 12.3 RETAIL & ECOMMERCE
- 12.3.1 OPTIMIZED INVENTORY MANAGEMENT FACILITATED BY KNOWLEDGE GRAPHS TO DRIVE MARKET
- 12.3.2 CASE STUDIES
- 12.3.2.1 Fraud detection in eCommerce
- 12.3.2.1.1 PayPal enhanced fraud detection with knowledge graphs
- 12.3.2.2 Dynamic pricing optimization
- 12.3.2.2.1 Belgian company revolutionized new product development with food pairing knowledge graph
- 12.3.2.3 Personalized recommendations
- 12.3.2.3.1 Xandr created industry-leading identity graph for personalized advertising with TigerGraph
- 12.3.2.4 Market basket analysis
- 12.3.2.4.1 eCommerce giants boosted retail sales with knowledge graph-powered market basket analysis
- 12.3.2.5 Customer experience enhancement
- 12.3.2.5.1 Retailers improved store operations and increased customer satisfaction using TigerGraph
- 12.3.2.5.2 Edamam enhanced food knowledge and user experience with knowledge graphs
- 12.3.2.6 Social media influence on buying behavior
- 12.3.2.6.1 Leveraging knowledge graphs to track social media influence on buying behavior at Coca-Cola
- 12.3.2.7 Churn prediction & prevention
- 12.3.2.7.1 Reducing customer churn with knowledge graphs
- 12.3.2.8 Product configuration & recommendation
- 12.3.2.8.1 Leading automotive manufacturer personalized customer experience with knowledge graphs for product configuration
- 12.3.2.9 Customer segmentation & targeting
- 12.3.2.9.1 Xbox enhanced user experience with TigerGraph for better customer insights and loyalty
- 12.3.2.10 Customer 360° view
- 12.3.2.10.1 Technology giant enhanced customer engagement with TigerGraph for personalized experiences
- 12.3.2.11 Review & reputation management
- 12.3.2.11.1 Neo4j managed brand reputation with knowledge graphs at TripAdvisor
- 12.3.2.12 Customer support
- 12.3.2.12.1 Retailer enhanced operations and customer satisfaction with TigerGraph for root cause analysis
- 12.3.2.1 Fraud detection in eCommerce
- 12.4 HEALTHCARE, LIFE SCIENCES, AND PHARMACEUTICALS
- 12.4.1 NEED TO REVOLUTIONIZE HEALTHCARE PRACTICES TO PROPEL ADOPTION OF KNOWLEDGE GRAPHS
- 12.4.2 CASE STUDIES
- 12.4.2.1 Drug discovery & development
- 12.4.2.1.1 Early Drug R&D center accelerated cancer research with Ontotext's target discovery
- 12.4.2.1.2 Ontotext's Target Discovery accelerated Alzheimer's breakthroughs with knowledge graphs
- 12.4.2.2 Clinical trial management
- 12.4.2.2.1 NuMedii streamlined clinical trial management with AI-powered knowledge graphs with Ontotext
- 12.4.2.3 Medical claim processing
- 12.4.2.3.1 UnitedHealth Group revolutionized medical claim processing with TigerGraph
- 12.4.2.4 Clinical intelligence
- 12.4.2.4.1 Leading US Children's Hospital gained deeper insights into impact of its faculty research
- 12.4.2.5 Healthcare provider network analysis
- 12.4.2.5.1 Amgen improved quality of healthcare by identifying influencers and referral networks using TigerGraph
- 12.4.2.6 Customer support
- 12.4.2.6.1 Exact Sciences Corporation revolutionized customer support in healthcare with a knowledge graph-powered 360° View
- 12.4.2.7 Patient journey & care pathway analysis
- 12.4.2.7.1 Care-for-Rare Foundation at Dr. von Hauner Children's Hospital transformed pediatric care pathways with Neo4j's clinical knowledge graph
- 12.4.2.8 Self-service data & digital asset discovery
- 12.4.2.8.1 Boehringer Ingelheim accelerating pharmaceutical innovation with Stardog Knowledge Graph
- 12.4.2.1 Drug discovery & development
- 12.5 TELECOM & TECHNOLOGY
- 12.5.1 NEED TO OPTIMIZE INTRICATE NETWORK INFRASTRUCTURE AND CUSTOMIZED SERVICE OFFERINGS TO FUEL MARKET GROWTH
- 12.5.2 CASE STUDIES
- 12.5.2.1 Network optimization & management
- 12.5.2.1.1 Cyber resilience leader scaled next-generation cybersecurity with TigerGraph to combat evolving threats
- 12.5.2.2 Network security analysis
- 12.5.2.2.1 Multinational cybersecurity and defense company accelerated risk identification in cybersecurity with knowledge graphs with Ontotext
- 12.5.2.3 Identity & access management
- 12.5.2.3.1 Technology giant improved customer experiences with TigerGraph
- 12.5.2.4 IT asset management
- 12.5.2.4.1 Orange used Thing'in to build digital twin platform
- 12.5.2.5 IoT device management & connectivity
- 12.5.2.5.1 AWS enhanced IoT device management with Amazon Neptune's scalable graph database solutions
- 12.5.2.6 Metadata enrichment
- 12.5.2.6.1 Cisco utilized Neo4j to enhance and assign metadata to its vast document collection
- 12.5.2.7 Data integration & governance
- 12.5.2.7.1 Dun & Bradstreet enhanced compliance with Neo4j's graph technology
- 12.5.2.8 Self-service data & digital asset discovery
- 12.5.2.8.1 Telecom provider optimized telecom operations with Neo4j's self-service data and digital asset discovery
- 12.5.2.9 Service incident management
- 12.5.2.9.1 BT Group revolutionizing telecom inventory management with Neo4j knowledge graph
- 12.5.2.1 Network optimization & management
- 12.6 GOVERNMENT
- 12.6.1 SPEEDY DATA INTEGRATION AND INTEROPERABILITY TO BOOST MARKET GROWTH
- 12.6.2 CASE STUDY
- 12.6.2.1 Government service optimization
- 12.6.2.1.1 LODAC Museum project, initiated by Japan's National Institute of Informatics (NII), enhanced academic access to cultural heritage data through Linked Open Data
- 12.6.2.2 Legislative & regulatory analysis
- 12.6.2.2.1 Inter-American Development Bank (IDB) leveraged the knowledge graph to enhance its FindIt platform
- 12.6.2.3 Crisis management & disaster response planning
- 12.6.2.3.1 Knowledge graphs enhanced crisis response for real-time decision-making
- 12.6.2.4 Environmental impact analysis and ESG
- 12.6.2.4.1 Vienna University of Technology transformed architectural design with ECOLOPES knowledge graph
- 12.6.2.5 Social network analysis for security & law enforcement
- 12.6.2.5.1 Social Network Analysis strengthened security via knowledge graphs
- 12.6.2.6 Policy impact analysis
- 12.6.2.6.1 Governments leveraged knowledge graphs for effective policy impact analysis
- 12.6.2.7 Knowledge management
- 12.6.2.7.1 Ellas leveraged GraphDB's knowledge graphs to bridge gender gaps in STEM leadership
- 12.6.2.8 Data integration & governance
- 12.6.2.8.1 Government agency took digital and print library services to next level, partnering with metaphacts and Ontotext
- 12.6.2.1 Government service optimization
- 12.7 MANUFACTURING & AUTOMOTIVE
- 12.7.1 EASY PREDICTIVE MAINTENANCE AND DECREASE IN DOWNTIME TO SUPPORT MARKET GROWTH
- 12.7.2 CASE STUDIES
- 12.7.2.1 Equipment maintenance and predictive maintenance
- 12.7.2.1.1 Ford Motor Company enhanced production efficiency with TigerGraph for predictive maintenance
- 12.7.2.2 Product lifecycle management
- 12.7.2.2.1 Enhancing product discoverability through semantic knowledge graphs
- 12.7.2.3 Manufacturing process optimization
- 12.7.2.3.1 Production streamlined efficiency with knowledge graphs
- 12.7.2.4 Enhance vehicle safety & reliability
- 12.7.2.4.1 Knowledge graphs improved vehicle safety with predictive maintenance
- 12.7.2.5 Optimization of industrial processes
- 12.7.2.5.1 Leading manufacturer of Building Automation Systems (BAS) graphs improved vehicle safety with Ontotext's GraphDB
- 12.7.2.6 Root cause analysis
- 12.7.2.6.1 Root Cause Analysis uncovered process failures in using knowledge graphs
- 12.7.2.7 Inventory management & demand forecasting
- 12.7.2.7.1 Knowledge graphs optimized inventory and demand forecasting with knowledge graphs
- 12.7.2.8 Service incident management
- 12.7.2.8.1 Knowledge graphs accelerated service incident resolution with knowledge graphs
- 12.7.2.9 Staff & resource allocation
- 12.7.2.9.1 Knowledge graphs optimized staff and resource allocation with knowledge graphs
- 12.7.2.10 Product configuration & recommendation
- 12.7.2.10.1 Leading Building Automation Systems (BAS) manufacturers used Brick schema to represent BAS components and their complex interactions
- 12.7.2.1 Equipment maintenance and predictive maintenance
- 12.8 MEDIA & ENTERTAINMENT
- 12.8.1 IMPROVED CONTENT MANAGEMENT PROCEDURES AND BETTER DATA-DRIVEN DECISIONS TO FOSTER MARKET GROWTH
- 12.8.2 CASE STUDY
- 12.8.2.1 Content recommendation & personalization
- 12.8.2.1.1 Leading television broadcaster streamlined data management and improved search efficiency with knowledge graphs
- 12.8.2.2 Audience segmentation & targeting
- 12.8.2.2.1 KT Corporation enhanced IPTV Content Discovery with semantic search for better audience targeting
- 12.8.2.3 Social media influence analysis
- 12.8.2.3.1 Myntelligence used TigerGraph's advanced graph analytics to analyze relationships and interactions
- 12.8.2.4 Copyright & licensing management
- 12.8.2.4.1 British Museum and Europeana leveraged knowledge graphs for efficient content management and licensing in cultural heritage
- 12.8.2.5 Self-service data & digital asset discovery
- 12.8.2.5.1 BBC transformed content management with semantic publishing for enhanced user experience
- 12.8.2.6 Content recommendation systems
- 12.8.2.6.1 STM publisher leveraged knowledge platform for enhanced content recommendation
- 12.8.2.7 User engagement analysis
- 12.8.2.7.1 Bulgarian media company leveraged Ontotext's knowledge graphs for enhanced user engagement and ad targeting
- 12.8.2.8 Knowledge management
- 12.8.2.8.1 Rappler empowered transparent elections with first Philippine Politics Knowledge Graph
- 12.8.2.1 Content recommendation & personalization
- 12.9 ENERGY, UTILITIES, AND INFRASTRUCTURE
- 12.9.1 DEVELOPMENT OF INNOVATIVE TECHNOLOGIES TO DRIVE DEMAND FOR KNOWLEDGE GRAPH SOLUTIONS
- 12.9.2 CASE STUDIES
- 12.9.2.1 Grid management
- 12.9.2.1.1 Transmission Systems Operator (TSO) modernized asset management with knowledge graphs for enhanced grid reliability
- 12.9.2.2 Energy trading optimization
- 12.9.2.2.1 Global energy and commodities markets information provider gained enhanced operational efficiencies with semantic information extraction
- 12.9.2.3 Renewable energy integration & optimization
- 12.9.2.3.1 State Grid Corporation of China created speedy energy management system with assistance of TigerGraph
- 12.9.2.4 Public infrastructure management
- 12.9.2.4.1 Knowledge graphs enhancing infrastructure management for better decision making
- 12.9.2.5 Customer engagement & billing
- 12.9.2.5.1 Knowledge graphs streamlined customer engagement and billing
- 12.9.2.6 Environmental impact analysis & ESG
- 12.9.2.6.1 Improved environmental impact analysis with knowledge graphs for ESG reporting
- 12.9.2.7 Service incident management
- 12.9.2.7.1 Enxchange transformed service incident management in energy with graph-based digital twins
- 12.9.2.8 Staff & resource allocation
- 12.9.2.8.1 Knowledge graphs optimized staff and resource allocation for efficient operations
- 12.9.2.9 Railway asset management
- 12.9.2.9.1 Railway asset management with graph databases enhanced connectivity and efficiency
- 12.9.2.1 Grid management
- 12.10 TRAVEL & HOSPITALITY
- 12.10.1 KNOWLEDGE GRAPHS TO HELP DEVELOP INNOVATIVE TECHNOLOGIES
- 12.10.2 CASE STUDIES
- 12.10.2.1 Personalized travel recommendations
- 12.10.2.1.1 Travel Personalization with Knowledge Graphs for Tailored Recommendations
- 12.10.2.2 Dynamic pricing optimization
- 12.10.2.2.1 Marriott International implemented knowledge graph technology for dynamic pricing and revenue optimization
- 12.10.2.3 Customer journey mapping
- 12.10.2.3.1 Mapping customer journey with knowledge graphs for enhanced travel experiences
- 12.10.2.4 Booking & reservation optimization
- 12.10.2.4.1 WestJet Airlines transformed flight scheduling into seamless, customer-friendly experience with Neo4j
- 12.10.2.5 Customer experience enhancement
- 12.10.2.5.1 Airbnb transformed customer experience with unified data and actionable insights with Neo4j graph database
- 12.10.2.6 Product configuration and recommendation
- 12.10.2.6.1 Knowledge graphs streamlined product configuration and recommendations
- 12.10.2.1 Personalized travel recommendations
- 12.11 TRANSPORTATION & LOGISTICS
- 12.11.1 NEED FOR DEVELOPMENT OF INNOVATIVE TECHNOLOGIES TO BOLSTER MARKET GROWTH
- 12.11.2 CASE STUDIES
- 12.11.2.1 Route optimization & fleet management
- 12.11.2.1.1 Transport for London (TfL) optimized route management and incident response with digital twin
- 12.11.2.2 Supply chain visibility
- 12.11.2.2.1 Knowledge graphs enhanced supply chain visibility with real-time insights
- 12.11.2.3 Equipment maintenance & predictive maintenance
- 12.11.2.3.1 Knowledge graphs optimized equipment maintenance with predictive insights via knowledge graphs
- 12.11.2.4 Supply chain management
- 12.11.2.4.1 Knowledge graphs streamlined supply chain management for better coordination
- 12.11.2.5 Vendor & supplier analysis
- 12.11.2.5.1 Vendor and supplier analysis with knowledge graphs for smarter sourcing
- 12.11.2.6 Operational efficiency & decision making
- 12.11.2.6.1 Careem improved operational efficiency through fraud detection
- 12.11.2.1 Route optimization & fleet management
- 12.12 OTHER VERTICALS
13 KNOWLEDGE GRAPH MARKET, BY REGION
- 13.1 INTRODUCTION
- 13.2 NORTH AMERICA
- 13.2.1 US
- 13.2.1.1 Increase in need for structured data analytics and interoperability to drive market
- 13.2.2 CANADA
- 13.2.2.1 Increase in complexity of data and demand for efficient data to propel market
- 13.2.1 US
- 13.3 EUROPE
- 13.3.1 UK
- 13.3.1.1 Increase in complexity of data and demand for advanced data integration solutions to fuel market growth
- 13.3.2 GERMANY
- 13.3.2.1 Germany's knowledge graph market thrives amid high demand for industry AI
- 13.3.3 FRANCE
- 13.3.3.1 Focus on technological innovation, robust digital infrastructure, and supportive regulatory environment to foster market growth
- 13.3.4 ITALY
- 13.3.4.1 Advancing knowledge graph applications in cultural heritage and research ecosystems
- 13.3.5 SPAIN
- 13.3.5.1 Strategic initiatives in AI development sector and implementation of Spain's 2024 Artificial Intelligence Strategy to accelerate market
- 13.3.6 REST OF EUROPE
- 13.3.1 UK
- 13.4 ASIA PACIFIC
- 13.4.1 CHINA
- 13.4.1.1 Rapid technological advancements, government initiatives, and strategic focus on integrating AI to boost market
- 13.4.2 JAPAN
- 13.4.2.1 Enterprise AI and research-driven knowledge graph integration to enhance explainability and decision-making
- 13.4.3 INDIA
- 13.4.3.1 Accelerating knowledge graph adoption through enterprise AI, strategic investments, and domain-specific platforms
- 13.4.4 SOUTH KOREA
- 13.4.4.1 Enterprise and consumer AI integration driving knowledge graph adoption
- 13.4.5 AUSTRALIA & NEW ZEALAND
- 13.4.5.1 Enterprise and infrastructure-led adoption of knowledge graphs for data integration
- 13.4.6 REST OF ASIA PACIFIC
- 13.4.1 CHINA
- 13.5 MIDDLE EAST & AFRICA
- 13.5.1 UAE
- 13.5.1.1 Increase in government support for AI and digital transformation initiatives to foster market growth
- 13.5.2 KSA
- 13.5.2.1 Government initiatives and investments in digital infrastructure to propel market
- 13.5.3 SOUTH AFRICA
- 13.5.3.1 Growing focus on digital transformation and innovation to accelerate market growth
- 13.5.4 REST OF MIDDLE EAST & AFRICA
- 13.5.1 UAE
- 13.6 LATIN AMERICA
- 13.6.1 BRAZIL
- 13.6.1.1 Expanding knowledge graph applications in law enforcement, NLP research, and enterprise analytics
- 13.6.2 MEXICO
- 13.6.2.1 Growing use of knowledge graphs in digital infrastructure, healthcare, and enterprise AI applications
- 13.6.3 ARGENTINA
- 13.6.3.1 Emerging knowledge graph adoption in financial analytics, agriculture, and AI-driven data platform
- 13.6.4 REST OF LATIN AMERICA
- 13.6.1 BRAZIL
14 COMPETITIVE LANDSCAPE
- 14.1 INTRODUCTION
- 14.2 KEY PLAYER COMPETITIVE STRATEGIES/RIGHT TO WIN, 2024-2025
- 14.3 REVENUE ANALYSIS, 2021-2025
- 14.4 MARKET SHARE ANALYSIS, 2025
- 14.5 BRAND/PRODUCT COMPARISON
- 14.6 COMPANY EVALUATION MATRIX: KEY PLAYERS, 2025
- 14.6.1 STARS
- 14.6.2 EMERGING LEADERS
- 14.6.3 PERVASIVE PLAYERS
- 14.6.4 PARTICIPANTS
- 14.6.5 COMPANY FOOTPRINT: KEY PLAYERS, 2025
- 14.6.5.1 Company footprint
- 14.6.5.2 Regional footprint
- 14.6.5.3 Vertical footprint
- 14.6.5.4 Offering footprint
- 14.7 COMPANY EVALUATION MATRIX: STARTUPS/SMES, 2025
- 14.7.1 PROGRESSIVE COMPANIES
- 14.7.2 RESPONSIVE COMPANIES
- 14.7.3 DYNAMIC COMPANIES
- 14.7.4 STARTING BLOCKS
- 14.7.5 COMPETITIVE BENCHMARKING: STARTUPS/SMES, 2025
- 14.7.5.1 Key Startups/SMEs
- 14.7.5.2 Competitive Benchmarking of Key Startups/SMEs
- 14.8 COMPANY VALUATION AND FINANCIAL METRICS OF KEY KNOWLEDGE GRAPH MARKET PROVIDERS
- 14.9 COMPETITIVE SCENARIOS
- 14.9.1 PRODUCT LAUNCHES & ENHANCEMENTS
- 14.9.2 DEALS
15 COMPANY PROFILES
- 15.1 KEY PLAYERS
- 15.1.1 NEO4J
- 15.1.1.1 Business overview
- 15.1.1.2 Products/Solutions/Services offered
- 15.1.1.3 Recent developments
- 15.1.1.3.1 Product launches and enhancements
- 15.1.1.3.2 Deals
- 15.1.1.4 MnM view
- 15.1.1.4.1 Right to win
- 15.1.1.4.2 Strategic choices
- 15.1.1.4.3 Weaknesses and competitive threats
- 15.1.2 AMAZON WEB SERVICES, INC
- 15.1.2.1 Business overview
- 15.1.2.2 Products/Solutions/Services offered
- 15.1.2.3 Recent developments
- 15.1.2.3.1 Product enhancements
- 15.1.2.3.2 Deals
- 15.1.2.4 MnM view
- 15.1.2.4.1 Right to win
- 15.1.2.4.2 Strategic choices
- 15.1.2.4.3 Weaknesses and competitive threats
- 15.1.3 TIGERGRAPH
- 15.1.3.1 Business overview
- 15.1.3.2 Products/Solutions/Services offered
- 15.1.3.3 Recent developments
- 15.1.3.3.1 Product enhancements
- 15.1.3.3.2 Deals
- 15.1.3.4 MnM view
- 15.1.3.4.1 Right to win
- 15.1.3.4.2 Strategic choices
- 15.1.3.4.3 Weaknesses and competitive threats
- 15.1.4 GRAPHWISE
- 15.1.4.1 Business overview
- 15.1.4.2 Products/Solutions/Services offered
- 15.1.4.3 Recent developments
- 15.1.4.3.1 Product launch/enhancements
- 15.1.4.4 MnM view
- 15.1.4.4.1 Right to win
- 15.1.4.4.2 Strategic choices
- 15.1.4.4.3 Weaknesses and competitive threats
- 15.1.5 RELATIONALAI
- 15.1.5.1 Business overview
- 15.1.5.2 Products/Solutions/Services offered
- 15.1.5.3 Recent developments
- 15.1.5.3.1 Product launches
- 15.1.5.4 MnM view
- 15.1.5.4.1 Right to win
- 15.1.5.4.2 Strategic choices
- 15.1.5.4.3 Weaknesses and competitive threats
- 15.1.6 IBM
- 15.1.6.1 Business overview
- 15.1.6.2 Products/Solutions/Services offered
- 15.1.6.3 Recent developments
- 15.1.6.3.1 Product enhancements
- 15.1.6.3.2 Deals
- 15.1.7 MICROSOFT
- 15.1.7.1 Business overview
- 15.1.7.2 Products/Solutions/Services offered
- 15.1.7.3 Recent developments
- 15.1.7.3.1 Product enhancements
- 15.1.7.3.2 Deals
- 15.1.8 SAP
- 15.1.8.1 Business overview
- 15.1.8.2 Products/Solutions/Services offered
- 15.1.8.3 Recent developments
- 15.1.8.3.1 Product enhancements
- 15.1.9 ORACLE
- 15.1.9.1 Business overview
- 15.1.9.2 Products/Solutions/Services offered
- 15.1.9.3 Recent developments
- 15.1.9.3.1 Product enhancements
- 15.1.10 STARDOG
- 15.1.10.1 Business overview
- 15.1.10.2 Products/Solutions/Services offered
- 15.1.10.3 Recent developments
- 15.1.10.3.1 Product enhancements
- 15.1.10.3.2 Deals
- 15.1.11 FRANZ INC.
- 15.1.11.1 Business overview
- 15.1.11.2 Products/Solutions/Services offered
- 15.1.11.3 Recent developments
- 15.1.11.3.1 Product enhancements
- 15.1.11.3.2 Deals
- 15.1.12 ALTAIR
- 15.1.12.1 Business overview
- 15.1.12.2 Products/Solutions/Services offered
- 15.1.12.3 Recent developments
- 15.1.12.3.1 Product enhancements
- 15.1.12.3.2 Deals
- 15.1.13 PROGRESS SOFTWARE CORPORATION
- 15.1.14 ESRI
- 15.1.15 OPENLINK SOFTWARE
- 15.1.1 NEO4J
- 15.2 SMES/STARTUPS
- 15.2.1 DATAVID
- 15.2.2 FACTNEXUS
- 15.2.3 ECCENCA
- 15.2.4 ARANGODB
- 15.2.5 FLUREE
- 15.2.6 DIFFBOT
- 15.2.7 MEMGRAPH
- 15.2.8 GRAPHAWARE
- 15.2.9 ONLIM
- 15.2.10 SMABBLER
- 15.2.11 METAPHACTS
16 RESEARCH METHODOLOGY
- 16.1 RESEARCH DATA
- 16.1.1 SECONDARY DATA
- 16.1.1.1 Key data from secondary sources
- 16.1.2 PRIMARY DATA
- 16.1.2.1 Breakup of primary profiles
- 16.1.2.2 Key insights from industry experts
- 16.1.2.3 Key data from primary sources
- 16.1.1 SECONDARY DATA
- 16.2 MARKET SIZE ESTIMATION
- 16.2.1 BOTTOM-UP APPROACH
- 16.2.2 TOP-DOWN APPROACH
- 16.3 MARKET BREAKUP AND DATA TRIANGULATION
- 16.4 MARKET FORECAST
- 16.5 RESEARCH ASSUMPTIONS
- 16.6 RESEARCH LIMITATIONS
17 APPENDIX
- 17.1 DISCUSSION GUIDE
- 17.2 KNOWLEDGE STORE: MARKETSANDMARKETS' SUBSCRIPTION PORTAL
- 17.3 CUSTOMIZATION OPTIONS
- 17.4 RELATED REPORTS
- 17.5 AUTHOR DETAILS