|
시장보고서
상품코드
2107173
데이터센터용 버스웨이 시장 예측(-2032년) : IT 부하별, 도체 유형별, 전원별, 데이터센터 유형별, 전류 용량별, 지역별Data Center Busways Market by IT Load Type (Al, Non Al), Data Center Type (Hyperscale, Colocation, Enterprise), Conductor Type (Copper, Aluminum & Hybrid), Power Source (AC, DC), Power Ampacity, and Region - Global Forecast to 2032 |
||||||

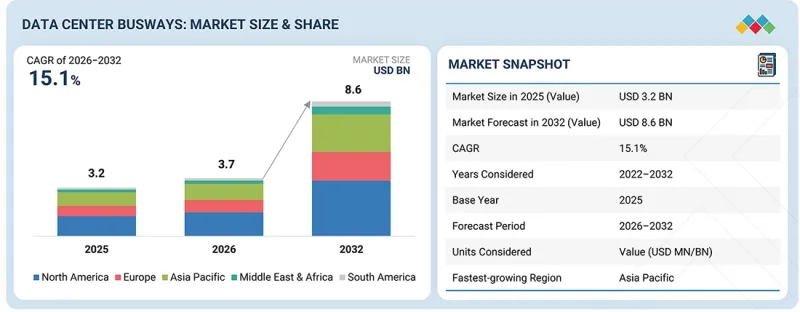
세계의 데이터센터용 버스웨이 시장 규모는 2026년 37억 달러에서 2032년까지 86억 달러로 확대하며, 예측 기간 중 CAGR은 15.1%에 달할 것으로 전망되고 있습니다.
해당 시장은 조사 기간 중 지속적인 성장을 보였으며, 예측 기간 중도 유사한 추세가 이어질 것으로 예상됩니다.
| 조사 범위 | |
|---|---|
| 조사 대상 기간 | 2022-2032년 |
| 기준연도 | 2025년 |
| 예측 기간 | 2026-2032년 |
| 산정 단위 | 금액(100만/10억 달러) |
| 부문 | IT 부하별, 도체 유형별, 전원별, 데이터센터 유형별, 전류 용량별, 지역별 |
| 대상 지역 | 아시아태평양, 유럽, 북미, 중동 및 아프리카, 남미 |
AI를 활용한 컴퓨팅 인프라 도입 확대, 하이퍼스케일 데이터센터 업계의 성장, 그리고 유연하고 확장성이 뛰어난 배전 아키텍처에 대한 수요 증가가 향후 수년간 이 시장의 성장을 촉진할 것으로 전망됩니다.
"데이터센터 유형별로는 하이퍼스케일 부문이 예측 기간 중 가장 빠른 성장세를 보일 것으로 추정됩니다."
하이퍼스케일 데이터센터는 예측 기간 중 데이터센터용 버스웨이 시장에서 가장 높은 성장률을 기록할 것으로 예상됩니다. 인공지능(AI) 인프라, 클라우드 플랫폼 및 고성능 컴퓨팅 시설에 대한 투자 증가가 더 대규모이며 전력 소비량이 많은 데이터센터 건설을 촉진하고 있습니다. 랙의 전력 밀도가 지속적으로 상승함에 따라 사업자들은 유연한 전력 분배를 지원하고, 향후 확장을 간소화하며, 도입 기간을 단축하기 위해 모듈식 버스웨이 시스템을 채택하고 있습니다. AI 전용 캠퍼스 및 차세대 하이퍼스케일 시설의 개발이 지속됨에 따라 대용량 버스웨이 솔루션에 대한 수요가 더욱 가속화되고 있습니다. 또한 버스웨이 시스템은 대규모 인프라 변경 없이도 진화하는 전력 요구 사항을 충족할 수 있으며, 급속히 확장되는 하이퍼스케일 환경에 최적입니다.
"정격 전류별로는 중용량 부문이 예측 기간 중 가장 큰 점유율을 차지할 것으로 추정됩니다."
중용량 부문은 하이퍼스케일 및 코로케이션 데이터센터에 널리 도입되어 있는 만큼, 예측 기간 중 전 세계 데이터센터용 버스웨이 시장을 주도할 것으로 예상됩니다. 800A-1,000A 용량 범위의 버스웨이는 높은 전력 밀도에 대응할 수 있는 충분한 전력 분배 능력을 갖추면서도 비용 효율성과 유연성을 겸비하고 있습니다. AI, 고성능 컴퓨팅(HPC), 클라우드 애플리케이션은 중용량 버스웨이의 채택 확대에 점점 더 기여하고 있습니다. 이러한 워크로드는 초고용량 도입에 수반되는 더 복잡한 인프라를 필요로 하지 않으면서도 더 큰 전력 분배 용량을 요구하기 때문입니다. 또한 하이퍼스케일 및 코로케이션 데이터센터의 보급으로 인해 800A에서 1,000A 정격의 버스웨이 채택이 촉진되고 있습니다. 이러한 시스템은 향후 전력 요구 사항 및 워크로드 확대에 대응하는 데 도움이 되기 때문입니다.
"예측 기간 중 북미가 가장 큰 시장 점유율을 차지할 것으로 추정되는 반면, 아시아태평양은 가장 빠른 성장이 예상됩니다."
북미는 다수의 하이퍼스케일 데이터센터가 존재하고, AI 인프라에 대한 막대한 투자, 그리고 주요 클라우드 서비스 제공업체들의 적극적인 사업 확장에 힘입어 데이터센터용 버스웨이 시장에서 가장 큰 점유율을 차지하고 있습니다. 이 지역에는 세계 최대 규모의 데이터센터 캠퍼스가 여러 곳 위치해 있으며, 확장성이 뛰어나고 고출력의 배전 시스템이 요구되고 있습니다. 아시아태평양은 디지털화의 진전, 클라우드 컴퓨팅 서비스의 확대, 인터넷 이용 증가, 그리고 중국, 인도, 일본, 인도네시아, 말레이시아 등 국가들의 새로운 데이터센터 용량 구축을 위한 막대한 투자로 인해 급속히 성장하는 지역 시장을 차지하고 있습니다.
Eaton Corporation plc(아일랜드), Schneider Electric SE(프랑스), Siemens AG(독일), ABB Ltd.(스위스), Legrand SA(프랑스), GE Vernova Inc.(미국), Vertiv Holdings Co.(미국), LS Electric(한국), Rittal GmbH & Co. KG(독일) 등이 데이터센터 버스웨이 시장에서 사업을 운영하는 주요 기업 중 일부입니다. 이들 기업은 시장내 입지를 강화하고 급성장하는 데이터센터 인프라 분야에서 존재감을 확대하기 위해 신제품 출시, 생산 능력 확대, 파트너십, 제휴, 계약 체결 등의 전략을 채택하고 있습니다.
조사 범위:
이 보고서에서는 데이터센터 유형, 전원, 도체 유형, 허용 전류, IT 부하 유형 및 지역을 기준으로 데이터센터 버스웨이 시장을 정의, 세분화 및 미래 전망을 제시하고 있습니다. 또한 시장 성장에 영향을 미치는 주요 요인(촉진요인, 억제요인, 기회, 과제 등)에 대한 상세한 정보를 제공합니다. 아울러 데이터센터용 버스웨이 제조업체의 전략적 프로필을 작성하여 각사의 시장 점유율과 핵심 경쟁력을 포괄적으로 분석하는 한편, 시장내 각사의 사업 확장, 제휴, 계약, 신제품 출시와 같은 경쟁 동향을 추적 및 분석하고 있습니다.
이 보고서를 구매해야 하는 이유:
이 보고서는 데이터센터용 버스웨이 시장 및 각 부문의 매출에 대해 가장 정확한 추정치를 제공함으로써, 시장을 선도하는 기업과 신규 진입 기업을 지원하는 데 기여할 것으로 기대됩니다. 또한 이 보고서는 이해관계자가 시장의 경쟁 구도를 더 깊이 이해하고, 자사의 사업 위치를 향상시키기 위한 인사이트를 얻어 적절한 시장 진입 전략을 수립하는 데 도움이 될 것으로 기대됩니다. 아울러, 이해관계자가 시장 동향을 파악할 수 있도록 지원하며, 주요 시장 촉진요인, 억제요인, 과제 및 기회에 관한 정보를 제공합니다.
이 보고서는 다음과 같은 사항에 대한 인사이트를 제공합니다. :
- 주요 촉진요인(AI 클러스터별 기존 배전 아키텍처의 변혁, 하이퍼스케일 데이터센터의 확대, 운영상의 유연성에 대한 수요), 제약 요인(높은 초기 설비 투자 비용, 조달 프로세스의 엄격화, 구형 시설의 개조 복잡성), 기회(완전히 새로운 버스웨이 설계를 필요로 하는 AI 인프라, 고출력 직류 배전의 부상, AI 업그레이드에 따른 개조 물결) 및 과제(열 관리가 설계상의 병목 현상으로 대두되고 있음, 구리 가격 변동이 수익성에 직접적인 영향을 미침, 고순도 구리의 확보 가능성, 규제 및 표준화 제약) 등, 데이터센터용 버스웨이 시장의 성장에 영향을 미치는 요인에 대한 인사이트를 제공합니다.
- 제품 개발/혁신: 데이터센터 버스웨이 시장의 향후 기술 동향 및 연구개발 활동에 대한 상세한 분석.
- 시장 개발: 수익성이 높은 시장에 대한 포괄적인 정보 - 이 보고서는 다양한 지역의 데이터센터용 버스웨이 시장을 분석합니다.
- 시장 다각화: 데이터센터 버스웨이 시장의 신제품, 다양한 유형, 미개발 지역, 최근 동향 및 투자에 관한 포괄적인 정보.
- 경쟁 분석: Eaton Corporation plc(아일랜드), Schneider Electric SE(프랑스), Siemens AG(독일), ABB Ltd.(스위스), Legrand SA(프랑스), GE Vernova Inc.(미국), Vertiv Holdings Co.(미국), LS Electric(한국), Rittal GmbH & Co. KG(독일), DBTS Industries Sdn. Bhd.(말레이시아) 등, 데이터센터 버스웨이 시장의 주요 기업의 시장 점유율, 성장 전략, 제품 라인업에 대한 상세한 평가입니다.
자주 묻는 질문
목차
제1장 서론
제2장 개요
제3장 주요 인사이트
제4장 시장 개요
제5장 업계 동향
제6장 기술 진보, AI에 의한 영향, 특허, 혁신, 향후 응용
제7장 규제 상황과 지속가능성 구상
제8장 고객 상황과 구매 행동
제9장 데이터센터용 버스웨이 시장(IT 부하별)
제10장 데이터센터용 버스웨이 시장(도체 유형별)
제11장 데이터센터용 버스웨이 시장(전원별)
제12장 데이터센터용 버스웨이 시장(데이터센터 유형별)
제13장 데이터센터용 버스웨이 시장(전류 용량별)
제14장 데이터센터용 버스웨이 시장(지역별)
제15장 경쟁 구도
제16장 기업 개요
제17장 조사 방법
제18장 부록
KSA 26.08.12The global data center busways market is projected to grow from USD 3.7 billion in 2026 to USD 8.6 billion by 2032, at a CAGR of 15.1% during the forecast period. The market exhibited continuous growth during the study period, and the same trend is expected during the forecast period as well.
| Scope of the Report | |
|---|---|
| Years Considered for the Study | 2022-2032 |
| Base Year | 2025 |
| Forecast Period | 2026-2032 |
| Units Considered | Value (USD Million/Billion) |
| Segments | By IT load type, power ampacity, power source, conductor type, data center type |
| Regions covered | Asia Pacific, Europe, North America, Middle East & Africa, and South America |
The growing adoption of AI-powered computing infrastructure, the expanding hyperscale data center industry, and the increasing demand for flexible and scalable power distribution architecture will drive the growth of this market during the next few years.
"The hyperscale segment, by data center type, is estimated to account for the fastest growth during the forecast period ".
Hyperscale data centers are expected to register the highest growth in the data center busways market during the forecast period. Rising investments in artificial intelligence infrastructure, cloud platforms, and high performance computing facilities are driving the construction of larger and more power-intensive data centers. As rack power densities continue to increase, operators are adopting modular busway systems to support flexible power distribution, simplify future expansions, and reduce deployment timelines. The ongoing development of AI-focused campuses and next-generation hyperscale facilities is further accelerating demand for high-capacity busway solutions. In addition, the ability of busway systems to accommodate evolving power requirements without major infrastructure modifications makes them well suited for rapidly expanding hyperscale environments.
" The medium ampacity segment, by power ampacity, is estimated to account for the largest share during the forecast period ".
The medium ampacity segment is expected to lead the global data center busways market during the forecast period owing to its widespread deployment across hyperscale and colocation data centers. Busways within the ampacity range of 800 A to 1,000 A offer ample power distribution capacity to support higher power densities while remaining cost-effective and flexible. AI, high-performance computing, and cloud applications are increasingly contributing to the rising adoption of medium-ampacity busways, as these workloads demand greater power distribution capacity without requiring the more complex infrastructure associated with very high-ampacity deployments. Moreover, the proliferation of hyperscale and colocation data centers has boosted the adoption of busways rated between 800 A and 1000 A, as these systems help accommodate future power requirements and workload expansion.
"North America is estimated to account for the largest market share during the forecast period, while Asia Pacific is projected to see the fastest growth."
North America accounts for the largest share of the data center busways market due to the presence of several hyperscale data centers, significant investment in AI infrastructure, and aggressive expansion of the leading cloud service providers. The region has the presence of some of the largest data center campuses globally and requires scalable and high-power distribution systems. Asia Pacific accounts for the rapidly growing regional market owing to increasing digitalization, cloud computing services, growing internet usage, and significant investment in building new data center capacity in countries like China, India, Japan, Indonesia, and Malaysia.
Profile break-up of primary participants for the report:
- By Company Type: Tier 1 - 65%, Tier 2 - 20%, and Tier 3 - 15%
- By Designation: C-level- 25%, Director Level- 30%, and Others - 45%
- By Region: North America - 30%, Europe - 20%, Asia Pacific - 40%, Middle East & Africa - 7%, and South America - 3%
Eaton Corporation plc (Ireland), Schneider Electric SE (France), Siemens AG (Germany), ABB Ltd. (Switzerland), Legrand SA (France), GE Vernova Inc. (US), Vertiv Holdings Co. (US), LS Electric Co., Ltd. (South Korea), and Rittal GmbH & Co. KG (Germany) are some of the major players operating in the data center busways market. These players have adopted strategies such as product launches, capacity expansions, partnerships, collaborations, and agreements to strengthen their market position and expand their presence in the rapidly growing data center infrastructure sector.
Research Coverage:
The report defines, segments, and projects the data center busways market based on data center type, power source, conductor type, power ampacity, IT load type, and region. It provides detailed information regarding the major factors influencing the growth of the market, such as drivers, restraints, opportunities, and challenges. It strategically profiles data center busway manufacturers and comprehensively analyzes their market shares and core competencies, as well as tracks and analyzes competitive developments, such as expansions, partnerships, agreements, and new product launches, undertaken by them in the market.
Reasons to Buy the Report:
The report is expected to help market leaders/new entrants in the market by providing them with the closest approximations of revenue numbers of the data center busways market and its segments. This report is also expected to help stakeholders obtain an improved understanding of the competitive landscape of the market, gain insights to improve the position of their businesses, and make suitable go-to-market strategies. It also enables stakeholders to understand the pulse of the market and provides them with information on key market drivers, restraints, challenges, and opportunities.
The report provides insights on the following pointers:
- Analysis of key drivers (AI clusters are breaking traditional power distribution architectures, Expansion of hyperscale data centers, Operational flexibility needs), restraints (Higher initial capital cost, Intense procurement scrutiny, Retrofit complexity in older facilities), opportunities (AI infrastructure requiring entirely new busway designs, Emergence of high-power DC distribution, Retrofit wave driven by AI upgrades), and challenges (Thermal management becoming a design bottleneck, Copper price volatility directly impacting profitability, High-purity copper availability, Regulatory and standardization constraints) influencing the growth of the data center busways market.
- Product Development/Innovation: Detailed insights on upcoming technologies and research & development activities in the data center busways market.
- Market Development: Comprehensive information about lucrative markets - the report analyzes the data center busways market across varied regions.
- Market Diversification: Exhaustive information about new products, various types, untapped geographies, recent developments, and investments in the data center busways market.
- Competitive Assessment: In-depth assessment of market shares, growth strategies, and product offerings of leading players such as Eaton Corporation plc (Ireland), Schneider Electric SE (France), Siemens AG (Germany), ABB Ltd. (Switzerland), Legrand SA (France), GE Vernova Inc. (US), Vertiv Holdings Co. (US), C&S Electric Limited (India), LS Electric Co., Ltd. (South Korea), Rittal GmbH & Co. KG (Germany), DBTS Industries Sdn. Bhd. (Malaysia), and others in the data center busways market.
TABLE OF CONTENTS
1 INTRODUCTION
- 1.1 STUDY OBJECTIVES
- 1.2 MARKET DEFINITION
- 1.3 STUDY SCOPE
- 1.3.1 MARKET SEGMENTATION AND REGIONAL SCOPE
- 1.3.2 INCLUSIONS AND EXCLUSIONS OF STUDY
- 1.3.3 YEARS CONSIDERED
- 1.4 CURRENCY CONSIDERED
- 1.5 UNITS CONSIDERED
- 1.6 STAKEHOLDERS
2 EXECUTIVE SUMMARY
- 2.1 MARKET HIGHLIGHTS AND KEY INSIGHTS
- 2.2 KEY MARKET PARTICIPANTS: SHARE INSIGHTS AND STRATEGIC DEVELOPMENTS
- 2.3 DISRUPTIVE TRENDS IN DATA CENTER BUSWAYS MARKET
- 2.4 HIGH-GROWTH SEGMENTS
- 2.5 REGIONAL SNAPSHOT: MARKET SIZE, GROWTH RATE, AND FORECAST
3 PREMIUM INSIGHTS
- 3.1 ATTRACTIVE OPPORTUNITIES FOR PLAYERS IN DATA CENTER BUSWAYS MARKET
- 3.2 DATA CENTER BUSWAYS MARKET, BY POWER AMPACITY
- 3.3 DATA CENTER BUSWAYS MARKET, BY COUNTRY
4 MARKET OVERVIEW
- 4.1 INTRODUCTION
- 4.2 MARKET DYNAMICS
- 4.2.1 DRIVERS
- 4.2.1.1 Rising number of data centers and increasing server density
- 4.2.1.2 Growing adoption of AI clusters driving need for advanced power distribution architecture
- 4.2.1.3 Expansion of hyperscale data centers
- 4.2.1.4 Increasing need for operational flexibility
- 4.2.2 RESTRAINTS
- 4.2.2.1 High capital expenditure and retrofitting complexity in older facilities
- 4.2.2.2 Intense procurement scrutiny
- 4.2.3 OPPORTUNITIES
- 4.2.3.1 Growing AI infrastructure driving demand for next-generation busway designs
- 4.2.3.2 Increasing retrofit demand driven by AI infrastructure upgrades
- 4.2.3.3 Emergence of high-power DC distribution
- 4.2.4 CHALLENGES
- 4.2.4.1 Thermal management challenges in busway design
- 4.2.4.2 Volatility in raw material prices
- 4.2.4.3 Limited availability of high-purity copper
- 4.2.4.4 Regulatory & standardization constraints
- 4.2.1 DRIVERS
- 4.3 UNMET NEEDS AND WHITE SPACES
- 4.3.1 UNMET NEEDS IN DATA CENTER BUSWAYS MARKET
- 4.3.2 WHITE SPACE OPPORTUNITIES
- 4.4 INTERCONNECTED MARKETS AND CROSS-SECTOR OPPORTUNITIES
- 4.4.1 INTERCONNECTED MARKETS
- 4.4.2 CROSS-SECTOR OPPORTUNITIES
- 4.5 EMERGING BUSINESS MODELS AND ECOSYSTEM SHIFTS
- 4.5.1 EMERGING BUSINESS MODELS
- 4.5.2 ECOSYSTEM SHIFTS
- 4.6 STRATEGIC MOVES BY TIER-1/2/3 PLAYERS
5 INDUSTRY TRENDS
- 5.1 PORTER'S FIVE FORCES ANALYSIS
- 5.1.1 BARGAINING POWER OF SUPPLIERS
- 5.1.2 BARGAINING POWER OF BUYERS
- 5.1.3 THREAT OF NEW ENTRANTS
- 5.1.4 THREAT OF SUBSTITUTES
- 5.1.5 INTENSITY OF COMPETITIVE RIVALRY
- 5.2 MACROECONOMIC OUTLOOK
- 5.2.1 GDP TRENDS AND FORECAST
- 5.2.2 TRENDS IN GLOBAL DATA CENTER BUSWAYS INDUSTRY
- 5.3 VALUE CHAIN ANALYSIS
- 5.3.1 RAW MATERIAL & COMPONENT SUPPLIERS
- 5.3.2 CONDUCTOR & BUSBAR MANUFACTURERS
- 5.3.3 BUSWAY/BUSDUCT MANUFACTURERS
- 5.3.4 SYSTEM INTEGRATORS & POWER DISTRIBUTION SPECIALISTS
- 5.3.5 DISTRIBUTION & CHANNEL PARTNERS
- 5.3.6 EPC/MEP CONTRACTORS
- 5.3.7 DATA CENTER OWNERS & OPERATORS
- 5.4 ECOSYSTEM ANALYSIS
- 5.5 PRICING ANALYSIS
- 5.5.1 AVERAGE SELLING PRICE TREND, BY REGION
- 5.5.2 AVERAGE SELLING PRICE OF DATA CENTER BUSWAYS, BY KEY PLAYER, 2025
- 5.6 TRADE DATA
- 5.6.1 IMPORT SCENARIO (HS CODE 853690)
- 5.6.2 EXPORT SCENARIO (HS CODE 853690)
- 5.7 KEY CONFERENCES AND EVENTS, 2026-2027
- 5.8 TRENDS/DISRUPTIONS INFLUENCING CUSTOMER BUSINESS
- 5.9 INVESTMENT AND FUNDING SCENARIO
- 5.10 CASE STUDY ANALYSIS
- 5.10.1 VERTIV SMARTRUN: AI-VALIDATED DIGITAL TWIN FOR AI FACTORY POWER DESIGN
- 5.10.2 EATON POWER XPERT QUALITY (PXQ): AI WORKLOAD POWER FLUCTUATION DETECTION
- 5.10.3 SCHNEIDER ELECTRIC ECOSTRUXURE POD + NVIDIA MGX: AI-READY MODULAR BUSWAY INFRASTRUCTURE
- 5.11 IMPACT OF 2025 US TARIFF - DATA CENTER BUSWAYS MARKET
- 5.11.1 KEY TARIFF RATES
- 5.11.2 PRICE IMPACT ANALYSIS
- 5.11.3 IMPACT ON COUNTRIES/REGIONS
- 5.11.3.1 US
- 5.11.3.2 Europe
- 5.11.3.3 Asia Pacific
- 5.11.4 IMPACT ON END-USE INDUSTRIES
6 TECHNOLOGICAL ADVANCEMENTS, AI-DRIVEN IMPACT, PATENTS, INNOVATIONS, AND FUTURE APPLICATIONS
- 6.1 KEY TECHNOLOGIES
- 6.1.1 INTELLIGENT IOT-EMBEDDED BUSWAY MONITORING SYSTEMS
- 6.1.2 HIGH-VOLTAGE DC (HVDC) AND 800V DC BUSWAY ARCHITECTURE
- 6.2 COMPLEMENTARY TECHNOLOGIES
- 6.2.1 DATA CENTER INFRASTRUCTURE MANAGEMENT (DCIM) PLATFORMS
- 6.3 TECHNOLOGY ROADMAP
- 6.3.1 SHORT-TERM (2025-2027): INTELLIGENT MONITORING AND MODULAR POWER DISTRIBUTION
- 6.3.2 MID-TERM (2027-2030): AI-READY POWER DISTRIBUTION AND DIGITAL INTEGRATION
- 6.3.3 LONG-TERM (2030-2035+): AUTONOMOUS POWER DISTRIBUTION AND NEXT-GENERATION BUSWAY ARCHITECTURES
- 6.4 PATENT ANALYSIS
- 6.5 FUTURE APPLICATIONS
- 6.5.1 AI-READY HIGH-DENSITY BUSWAYS SYSTEMS
- 6.5.2 800VDC/HVDC BUSWAY ARCHITECTURE
- 6.5.3 IOT-ENABLED BUSWAY MONITORING
- 6.5.4 SUSTAINABLE & MODULAR BUSWAY SYSTEMS
- 6.6 IMPACT OF GEN AI
- 6.6.1 INTRODUCTION
- 6.6.2 TOP USE CASES AND MARKET POTENTIAL
7 REGULATORY LANDSCAPE AND SUSTAINABILITY INITIATIVES
- 7.1 REGIONAL REGULATIONS AND COMPLIANCE
- 7.1.1 REGULATORY BODIES, GOVERNMENT AGENCIES, AND OTHER ORGANIZATIONS
- 7.1.2 INDUSTRY STANDARDS
- 7.2 SUSTAINABILITY INITIATIVES
- 7.2.1 CARBON IMPACT REDUCTION
- 7.2.2 ECO-APPLICATIONS
- 7.3 SUSTAINABILITY IMPACT AND REGULATORY POLICY INITIATIVES
- 7.4 CERTIFICATIONS, LABELING, AND ECO-STANDARDS
8 CUSTOMER LANDSCAPE AND BUYER BEHAVIOR
- 8.1 DECISION-MAKING PROCESS
- 8.2 KEY STAKEHOLDERS IN BUYING PROCESS AND THEIR EVALUATION CRITERIA
- 8.2.1 KEY STAKEHOLDERS IN BUYING PROCESS
- 8.2.2 BUYING CRITERIA
- 8.3 ADOPTION BARRIERS AND INTERNAL CHALLENGES
- 8.4 UNMET NEEDS FROM END-USE INDUSTRIES
- 8.5 MARKET PROFITABILITY
- 8.5.1 REVENUE POTENTIAL
- 8.5.2 COST DYNAMICS
- 8.5.3 MARGIN OPPORTUNITIES IN KEY APPLICATIONS
9 DATA CENTER BUSWAYS MARKET, BY IT LOAD
- 9.1 INTRODUCTION
- 9.2 AI
- 9.2.1 SURGE IN HIGH-DENSITY AI INFRASTRUCTURE TO PROPEL MARKET
- 9.3 NON-AI
- 9.3.1 GROWTH IN ENTERPRISE AND COLOCATION DATA CENTERS TO DRIVE MARKET
10 DATA CENTER BUSWAYS MARKET, BY CONDUCTOR TYPE
- 10.1 INTRODUCTION
- 10.2 COPPER
- 10.2.1 DEMAND FOR HIGH-CONDUCTIVITY POWER DISTRIBUTION TO BOOST MARKET
- 10.3 ALUMINUM & HYBRID
- 10.3.1 RAPID EVOLUTION OF AI INFRASTRUCTURE AND NEXT-GENERATION DC POWER ARCHITECTURE TO PROPEL MARKET
11 DATA CENTER BUSWAYS MARKET, BY POWER SOURCE
- 11.1 INTRODUCTION
- 11.2 AC
- 11.2.1 EXPANSION OF AC-BASED POWER INFRASTRUCTURE TO DRIVE MARKET
- 11.3 DC
- 11.3.1 GROWING ADOPTION OF ENERGY-EFFICIENT DC POWER ARCHITECTURE TO BOOST THE MARKET
12 DATA CENTER BUSWAYS MARKET, BY DATA CENTER TYPE
- 12.1 INTRODUCTION
- 12.2 HYPERSCALE
- 12.2.1 AI-DRIVEN HYPERSCALE EXPANSION AND HIGH-DENSITY DEPLOYMENTS TO ACCELERATE GROWTH
- 12.3 COLOCATION
- 12.3.1 RISING ENTERPRISE OUTSOURCING AND AI-READY COLOCATION FACILITIES FUEL DEMAND FOR MODULAR DATA CENTER BUSWAY SYSTEMS
- 12.4 ENTERPRISE
- 12.4.1 DIGITAL TRANSFORMATION AND INCREMENTAL INFRASTRUCTURE MODERNIZATION TO DRIVE DEMAND
13 DATA CENTER BUSWAYS MARKET, BY POWER AMPACITY
- 13.1 INTRODUCTION
- 13.2 LOW AMPACITY (UP TO 600A)
- 13.2.1 CONVENTIONAL ENTERPRISE WORKLOADS CONTINUE TO SUSTAIN DEMAND
- 13.3 MEDIUM AMPACITY (800A TO 1000A)
- 13.3.1 BALANCED POWER CAPACITY AND SCALABILITY TO DRIVE MARKET
- 13.4 HIGH AMPACITY (1250A TO 2000A)
- 13.4.1 AI CLUSTERS AND HIGH-DENSITY GPU DEPLOYMENTS ACCELERATE ADOPTION OF HIGH-AMPACITY
- 13.5 VERY HIGH AMPACITY (>2000A)
- 13.5.1 NEXT-GENERATION AI FACTORIES AND ULTRA-HIGH RACK DENSITIES TO PROPEL DEMAND
14 DATA CENTER BUSWAYS MARKET, BY REGION
- 14.1 INTRODUCTION
- 14.2 ASIA PACIFIC
- 14.2.1 CHINA
- 14.2.1.1 State-backed AI computing expansion and national computing hub development to boost market
- 14.2.2 AUSTRALIA
- 14.2.2.1 Rise in hyperscale cloud availability zones and renewable energy integration to boost market
- 14.2.3 JAPAN
- 14.2.3.1 Expansion of AI computing capacity and data centers to drive market
- 14.2.4 INDIA
- 14.2.4.1 Growth in AI infrastructure investments and data localization policies to propel market
- 14.2.5 REST OF ASIA PACIFIC
- 14.2.1 CHINA
- 14.3 EUROPE
- 14.3.1 GERMANY
- 14.3.1.1 Rise in AI factories and industrial digitalization to boost market growth
- 14.3.2 UK
- 14.3.2.1 Rise in AI cloud investments and hyperscale expansion to propel market
- 14.3.3 FRANCE
- 14.3.3.1 Rise in sovereign AI infrastructure and sustainable data centers to drive market
- 14.3.4 NETHERLANDS
- 14.3.4.1 Rise in hyperscale connectivity and digital infrastructure investments to drive market
- 14.3.5 REST OF EUROPE
- 14.3.1 GERMANY
- 14.4 NORTH AMERICA
- 14.4.1 US
- 14.4.1.1 Rise in hyperscale AI infrastructure investments to propel market
- 14.4.2 CANADA
- 14.4.2.1 Growth in AI investments and hydroelectric-powered data centers to propel market
- 14.4.3 MEXICO
- 14.4.3.1 Surge in data center investments to drive market
- 14.4.1 US
- 14.5 REST OF THE WORLD
- 14.5.1 MIDDLE EAST & AFRICA
- 14.5.1.1 Rise in AI infrastructure and sustainable digital transformation to boost market
- 14.5.2 SOUTH AMERICA
- 14.5.2.1 Growth in hyperscale digital infrastructure and renewable-powered data centers to drive market
- 14.5.1 MIDDLE EAST & AFRICA
15 COMPETITIVE LANDSCAPE
- 15.1 INTRODUCTION
- 15.2 KEY PLAYER STRATEGIES/RIGHT TO WIN
- 15.3 REVENUE ANALYSIS
- 15.3.1 TOP 5 PLAYERS' REVENUE ANALYSIS
- 15.4 MARKET SHARE ANALYSIS
- 15.4.1 RANKING OF KEY MARKET PLAYERS, 2025
- 15.4.2 MARKET SHARE OF KEY PLAYERS
- 15.4.2.1 Legrand (France)
- 15.4.2.2 Schneider Electric (France)
- 15.4.2.3 Vertiv Group Corp. (US)
- 15.4.2.4 Eaton (Ireland)
- 15.4.2.5 ABB (Switzerland)
- 15.5 PRODUCT COMPARISON
- 15.5.1 T3 TRACK BUSWAY (100-225 A)
- 15.5.2 CANALIS KSA
- 15.5.3 POWERBAR TRACK
- 15.5.4 POWERWAVE 2 BUSWAYS
- 15.5.5 SIVACON 8PS BD2
- 15.6 COMPANY EVALUATION MATRIX: KEY PLAYERS, 2025
- 15.6.1 STARS
- 15.6.2 EMERGING LEADERS
- 15.6.3 PERVASIVE PLAYERS
- 15.6.4 PARTICIPANTS
- 15.6.5 COMPANY FOOTPRINT: KEY PLAYERS, 2025
- 15.6.5.1 Company footprint
- 15.6.5.2 Region footprint
- 15.6.5.3 IT load footprint
- 15.6.5.4 Power ampacity footprint
- 15.6.5.5 Conductor type footprint
- 15.7 COMPANY EVALUATION MATRIX: STARTUPS/SMES, 2025
- 15.7.1 PROGRESSIVE COMPANIES
- 15.7.2 RESPONSIVE COMPANIES
- 15.7.3 DYNAMIC COMPANIES
- 15.7.4 STARTING BLOCKS
- 15.7.5 COMPETITIVE BENCHMARKING: STARTUPS/SMES, 2025
- 15.7.5.1 Detailed list of key startups/SMEs
- 15.7.5.2 Competitive benchmarking of key startups/SMEs
- 15.8 COMPANY VALUATION AND FINANCIAL METRICS
- 15.9 COMPETITIVE SCENARIO
- 15.9.1 PRODUCT LAUNCHES
- 15.9.2 DEALS
- 15.9.3 EXPANSIONS
16 COMPANY PROFILES
- 16.1 KEY PLAYERS
- 16.1.1 LEGRAND
- 16.1.1.1 Business overview
- 16.1.1.2 Products/Solutions/Services offered
- 16.1.1.3 Recent developments
- 16.1.1.3.1 Product launches
- 16.1.1.3.2 Deals
- 16.1.1.4 MnM view
- 16.1.1.4.1 Key strengths
- 16.1.1.4.2 Strategic choices
- 16.1.1.4.3 Weaknesses and competitive threats
- 16.1.2 SCHNEIDER ELECTRIC
- 16.1.2.1 Business overview
- 16.1.2.2 Products/Solutions/Services offered
- 16.1.2.3 Recent developments
- 16.1.2.3.1 Product launches
- 16.1.2.4 Deals
- 16.1.2.5 Expansions
- 16.1.2.6 MnM view
- 16.1.2.6.1 Key strengths
- 16.1.2.6.2 Strategic choices
- 16.1.2.6.3 Weaknesses and competitive threats
- 16.1.3 VERTIV GROUP CORP.
- 16.1.3.1 Business overview
- 16.1.3.2 Products/Solutions/Services offered
- 16.1.3.3 Recent developments
- 16.1.3.3.1 Product launches
- 16.1.3.3.2 Deals
- 16.1.3.3.3 Expansions
- 16.1.3.4 MnM view
- 16.1.3.4.1 Key strengths
- 16.1.3.4.2 Strategic choices
- 16.1.3.4.3 Weaknesses and competitive threats
- 16.1.4 EATON
- 16.1.4.1 Business overview
- 16.1.4.2 Products/Solutions/Services Offered
- 16.1.4.3 Recent developments
- 16.1.4.3.1 Product launches
- 16.1.4.3.2 Deals
- 16.1.4.3.3 Expansions
- 16.1.4.4 MnM view
- 16.1.4.4.1 Key strengths
- 16.1.4.4.2 Strategic choices
- 16.1.4.4.3 Weaknesses and competitive threats
- 16.1.5 ABB
- 16.1.5.1 Business overview
- 16.1.5.2 Products/Solutions/Services offered
- 16.1.5.3 Recent developments
- 16.1.5.3.1 Product launches
- 16.1.5.3.2 Deals
- 16.1.5.3.3 Expansions
- 16.1.5.4 MnM view
- 16.1.5.4.1 Key strengths
- 16.1.5.4.2 Strategic choices
- 16.1.5.4.3 Weaknesses and competitive threats
- 16.1.6 SIEMENS
- 16.1.6.1 Business overview
- 16.1.6.2 Products/Solutions/Services offered
- 16.1.6.3 Recent developments
- 16.1.6.3.1 Product launches
- 16.1.6.3.2 Deals
- 16.1.6.3.3 Expansions
- 16.1.7 DELTA POWER SOLUTIONS
- 16.1.7.1 Business overview
- 16.1.7.2 Products/Solutions/Services offered
- 16.1.7.3 Recent developments
- 16.1.7.3.1 Product launches
- 16.1.7.4 Deals
- 16.1.7.5 Expansions
- 16.1.8 LS CABLE & SYSTEM LTD.
- 16.1.8.1 Business overview
- 16.1.8.2 Products/Solutions/Services offered
- 16.1.8.3 Recent developments
- 16.1.8.3.1 Expansions
- 16.1.9 WETOWN
- 16.1.9.1 Business overview
- 16.1.9.2 Products/Solutions/Services offered
- 16.1.9.3 Recent developments
- 16.1.9.3.1 Deals
- 16.1.10 FLEX LTD.
- 16.1.10.1 Business overview
- 16.1.10.2 Products/Solutions/Services offered
- 16.1.10.3 Recent developments
- 16.1.10.3.1 Product launches
- 16.1.10.3.2 Deals
- 16.1.10.3.3 Expansions
- 16.1.11 EAE ELECTRIC
- 16.1.11.1 Business overview
- 16.1.11.2 Products/Solutions/Services offered
- 16.1.11.3 Recent developments
- 16.1.11.3.1 Expansions
- 16.1.12 GUANGDONG CISCO GENERAL ELECTRIC POWER TECHNOLOGY CO., LTD. (CESKO)
- 16.1.12.1 Business overview
- 16.1.12.2 Products/Solutions/Services Offered
- 16.1.12.3 Recent developments
- 16.1.13 KYODO KY-TEC CORP.
- 16.1.13.1 Business overview
- 16.1.13.2 Products/Solutions/Services offered
- 16.1.13.3 Recent developments
- 16.1.14 GARDERMOEN
- 16.1.14.1 Business overview
- 16.1.14.2 Products/Solutions/Services offered
- 16.1.14.3 Recent developments
- 16.1.15 HUAPENG GROUP CO., LTD.
- 16.1.15.1 Business overview
- 16.1.15.2 Products/Solutions/Services offered
- 16.1.15.3 Recent developments
- 16.1.1 LEGRAND
- 16.2 OTHER PLAYERS
- 16.2.1 USA TRACKBUSWAY LLC
- 16.2.2 NATUS ELECTRIC GROUP CO., LTD.
- 16.2.3 DBTS INDUSTRIES SDN. BHD.
- 16.2.4 ZHENJIANG ANYI ELECTRICAL CO., LTD.
- 16.2.5 GUANGDONG GULING ELECTRIC CO., LTD.
- 16.2.6 TECOBAR TECHNOLOGY (TET)
- 16.2.7 ENTRACO BKS BUS DUCTS PVT. LTD.
- 16.2.8 POWER PLUG BUSDUCT SDN. BHD.
- 16.2.9 CMER OF RENYUN (HUNAN) BUSBAR CO., LTD.
17 RESEARCH METHODOLOGY
- 17.1 RESEARCH DATA
- 17.1.1 SECONDARY DATA
- 17.1.1.1 List of key secondary sources
- 17.1.1.2 Key data from secondary sources
- 17.1.2 PRIMARY DATA
- 17.1.2.1 Key data from primary sources
- 17.1.2.2 List of primary interview participants (demand and supply sides)
- 17.1.2.3 Key industry insights
- 17.1.2.4 Breakdown of interviews with experts
- 17.1.1 SECONDARY DATA
- 17.2 DEMAND-SIDE ANALYSIS
- 17.3 MARKET SIZE ESTIMATION
- 17.3.1 BOTTOM-UP APPROACH
- 17.3.2 TOP-DOWN APPROACH
- 17.4 SUPPLY-SIDE ANALYSIS OF DATA CENTER BUSWAYS MARKET
- 17.4.1 CALCULATIONS FOR SUPPLY-SIDE ANALYSIS
- 17.5 GROWTH FORECAST
- 17.6 DATA TRIANGULATION
- 17.7 FACTOR ANALYSIS
- 17.8 RESEARCH ASSUMPTIONS
- 17.9 RESEARCH LIMITATIONS
- 17.10 RISK ASSESSMENT
18 APPENDIX
- 18.1 DISCUSSION GUIDE
- 18.2 KNOWLEDGESTORE: MARKETSANDMARKETS' SUBSCRIPTION PORTAL
- 18.3 CUSTOMIZATION OPTIONS
- 18.4 RELATED REPORTS
- 18.5 AUTHOR DETAILS