|
시장보고서
상품코드
2129357
방사선 선량 관리 시장 : 기능별(선량 모니터링, 벤치마크, 보고, 방사선 관리), 기술별(AI), 도입 형태별, 모달리티별(CT, PET, SPECT), 용도별(암), 최종사용자별(병원) - 세계 예측(-2031년)Radiation Dose Management Market by Function (Dose Monitoring, Benchmarking, Reporting, Radiation Management), Technology (AI ), Deployment, Modality (CT, PET, SPECT), Application (Onco), End User (Hospital) - Global Forecast to 2031 |
||||||

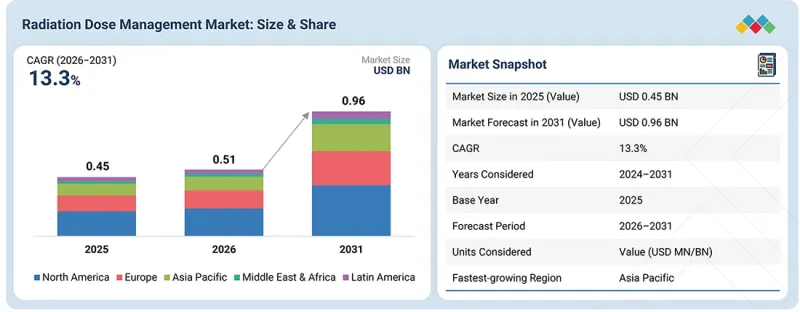
방사선 선량 관리 시장 규모는 2026년 5억 1,000만 달러에서 2031년에는 9억 6,000만 달러에 달할 것으로 예측되며, 2026년부터 2031년까지 CAGR은 13.3%가 될 전망입니다.
이 시장은 의료용 영상 진단의 활용 확대, 환자의 방사선 안전에 대한 관심 증가, 방사선량 모니터링 및 최적화를 중시하는 규제 강화, 자동 선량 관리 시스템 도입 확대를 배경으로 꾸준한 성장을 이루고 있습니다.
| 조사 범위 | |
|---|---|
| 조사 대상 기간 | 2026-2031년 |
| 기준 연도 | 2025년 |
| 예측 기간 | 2026-2031년 |
| 단위 | 금액(달러) |
| 부문 | 제공, 기능, 기술, 도입 형태, 수익 모델, 모달리티, 용도, 최종사용자, 지역 |
| 대상 지역 | 북미, 유럽, 아시아태평양, 라틴아메리카, 중동 및 아프리카 |
영상 진단 검사 건수와 복잡성이 증가함에 따라 병원, 의료 시스템, 진단·영상 진단 센터 및 기타 영상 진단 시설에서 RDM(방사선 선량 관리) 시스템의 도입이 가속화되고 있습니다. 이러한 시스템을 통해 의료 기관은 환자의 방사선량 데이터를 수집, 모니터링, 저장, 분석 및 공유할 수 있게 되어, 선량 편차를 파악하고, 시설 및 검사 시술별 방사선 피폭량을 비교하며, 진단 참조 수준(DRL)을 지원하고, 영상 진단 관행을 최적화할 수 있습니다.
“제공 분야별로는 솔루션이 2025년에 가장 큰 시장 점유율을 차지”
이는 의료 영상 환경 전반에 걸쳐 방사선량 데이터의 수집, 모니터링, 분석, 보고, 벤치마킹, 최적화를 자동화하는 소프트웨어 플랫폼의 도입이 확대된 데 기인합니다. RDM 솔루션을 통해 의료 기관은 여러 영상 진단 모달리티에서 피폭량 정보를 수집·분석하고, 피폭량 편차나 이상치를 파악하며, 진단 참조 수준(DRL)과 비교하여 영상 진단 프로토콜의 최적화를 지원할 수 있습니다. 또한, 독립형 선량 추적 도구에서 영상 진단 장치를 PACS, RIS, 병원 정보 시스템 및 기타 의료 IT 인프라와 연동하는 통합형이자 상호 운용 가능한 선량 관리 플랫폼으로의 전환도 솔루션 분야의 성장을 뒷받침하고 있습니다. 자동 알림, 선량 분석, 환자 선량 추적, 고급 최적화 기능의 지속적인 도입으로 인해 예측 기간 동안 RDM 솔루션에 대한 수요가 유지될 것으로 전망됩니다.
“도입 형태별로는 클라우드 기반이 예측 기간 동안 높은 성장세를 보일 전망”
클라우드형/웹 기반 부문은 병원, 진단·영상 센터, 여러 거점으로 구성된 의료 네트워크 전반에서 일원화되고 원격으로 접근 가능한 선량 관리 시스템에 대한 수요가 높아지고 있는 것을 배경으로, 예측 기간 동안 높은 연평균 성장률(CAGR)을 기록할 것으로 전망됩니다. 클라우드형 및 웹형 RDM 플랫폼을 통해 의료 기관은 시설 간에 선량 정보에 접근할 수 있으며, 일원화된 모니터링 및 벤치마킹을 지원하고, 대규모 온사이트 인프라의 필요성을 줄일 수 있습니다. 또한, 선량 데이터를 PACS, RIS 및 기타 의료 정보 시스템과 통합해야 할 필요성이 커지고 있는 점도 이러한 도입 형태의 확산을 뒷받침하고 있습니다.
“2025년, 북미가 최대 시장 점유율을 차지”
이는 확립된 의료 인프라, 첨단 의료 영상 기술의 높은 보급률, 방대한 영상 검사 건수, 방사선 안전 및 선량 최적화에 대한 관심 증가에 힘입은 결과입니다. 미국과 캐나다는 CT, 투시 검사, 중재적 영상, X선 촬영, 유방촬영술, 핵의학이 널리 활용되는 성숙한 의료 시스템을 갖추고 있어, 방사선 피폭을 모니터링하고 관리하는 기술에 대한 강력한 수요를 창출하고 있습니다. 이 지역의 의료 기관에서는 선량 모니터링의 자동화, 선량 변동 파악, 방사선 피폭 벤치마킹, 영상 진단 프로토콜 최적화를 지원하기 위해 RDM 솔루션 도입이 점점 더 확대되고 있습니다. 또한, 확고한 입지를 갖춘 RDM 공급업체의 존재와 성숙한 의료 IT 생태계 역시 병원, 의료 시스템, 진단 영상 시설에서의 선량 관리 기술 도입을 더욱 촉진하고 있습니다. 첨단 영상 진단 기술의 지속적인 확대와 환자 안전 및 효율적인 선량 관리에 대한 관심 증가로 인해, 예측 기간 동안 북미는 RDM 시장에서 주도적인 위치를 유지할 것으로 예상됩니다.
본 보고서는 전 세계 방사선 선량 관리 시장을 조사하여 시장 개요, 시장 성장에 영향을 미치는 다양한 요인에 대한 분석, 기술 및 특허 동향, 법규 환경, 사례 연구, 시장 규모 추정 및 전망, 각종 분류·지역/주요 국가별 상세 분석, 경쟁 구도, 주요 기업 개요 등을 종합적으로 다루고 있습니다.
자주 묻는 질문
목차
제1장 소개
제2장 주요 요약
제3장 주요 인사이트
제4장 시장 개요
제5장 업계 동향
제6장 기술, 특허, 디지털 기술, AI의 도입에 의한 전략적 디스럽션
제7장 규제 상황
제8장 고객 상황과 구매 행동
제9장 방사선량 관리 시장 : 제공별
제10장 방사선량 관리 시장 : 기능별
제11장 방사선량 관리 시장 : 기술별
제12장 방사선량 관리 시장 : 도입 형태별
제13장 방사선량 관리 시장 : 수익 모델별
제14장 방사선량 관리 시장 : 모달리티별
제15장 방사선량 관리 시장 : 용도별
제16장 방사선량 관리 시장 : 최종사용자별
제17장 방사선량 관리 시장 : 지역별
제18장 경쟁 구도
제19장 기업 개요
제20장 조사 방법
제21장 부록
KSM 26.09.17The radiation dose management market is projected to reach USD 0.96 billion by 2031 from USD 0.51 billion in 2026, at a CAGR of 13.3% from 2026 to 2031. The market is experiencing steady growth owing to the increasing utilization of medical imaging procedures, rising focus on patient radiation safety, regulatory emphasis on radiation dose monitoring and optimization, and growing adoption of automated dose management systems.
| Scope of the Report | |
|---|---|
| Years Considered for the Study | 2026-2031 |
| Base Year | 2025 |
| Forecast Period | 2026-2031 |
| Units Considered | Value (USD billion) |
| Segments | Offering, Function, Technology Deployment Model, Revenue Model, Modality, Application, End User, and Region |
| Regions covered | North America, Europe, Asia Pacific, Latin America, and Middle East & Africa |
The increasing volume and complexity of imaging procedures are accelerating the use of RDM systems across hospitals, healthcare systems, diagnostic and imaging centers, and other imaging facilities. These systems enable healthcare organizations to collect, monitor, archive, analyze, and share patient radiation dose data; identify dose variations; compare radiation exposure across facilities and procedures; support diagnostic reference levels (DRLs); and optimize imaging practices.
"By offering, solutions accounted for the dominant share of the radiation dose management market in 2025."
Based on offering, the radiation dose management market is segmented into solutions and services. The solutions segment accounted for the dominant share of the market in 2025, driven by the increasing adoption of software platforms that automate radiation-dose data collection, monitoring, analysis, reporting, benchmarking, and optimization across medical imaging environments. RDM solutions enable healthcare organizations to collect and analyze dose information from multiple imaging modalities, identify dose variations and outliers, compare radiation exposure against diagnostic reference levels (DRLs), and support imaging-protocol optimization. The solutions segment is also benefiting from the shift from standalone dose-tracking tools toward integrated and interoperable dose-management platforms that connect imaging modalities with PACS, RIS, hospital information systems, and other healthcare IT infrastructure. The continued adoption of automated alerts, dose analytics, patient dose tracking, and advanced optimization capabilities is expected to support demand for RDM solutions throughout the forecast period.
"By deployment model, the cloud-based deployment is expected to witness high growth during the forecast period."
Based on deployment model, the radiation dose management market is segmented into on-premises and cloud-based/web-based deployment. The cloud-based/web-based deployment segment is expected to register higher CAGR during the forecast period, supported by the increasing need for centralized and remotely accessible dose-management systems across hospitals, diagnostic and imaging centers, and multi-site healthcare networks. Cloud-based and web-based RDM platforms allow healthcare organizations to access dose information across facilities, support centralized monitoring and benchmarking, and reduce the need for extensive on-site infrastructure. The adoption of these deployment models is further supported by the growing need to integrate dose data with PACS, RIS, and other healthcare information systems.
"North America accounted for the largest share of the radiation dose management market in 2025."
The radiation dose management market is segmented into North America, Europe, Asia Pacific, Latin America, and the Middle East & Africa. North America accounted for the largest share of the market in 2025, supported by well-established healthcare infrastructure, high adoption of advanced medical imaging technologies, large imaging volumes, and increasing emphasis on radiation safety and dose optimization. The US and Canada have mature healthcare systems with widespread use of CT, fluoroscopy, and interventional imaging, radiography, mammography, and nuclear medicine, creating strong demand for technologies that monitor and manage radiation exposure. Healthcare organizations across the region are increasingly adopting RDM solutions to automate dose monitoring, identify dose variations, benchmark radiation exposure, and support imaging protocol optimization. The presence of established RDM providers and a mature healthcare IT ecosystem further supports adoption of dose management technologies across hospitals, healthcare systems, and diagnostic imaging facilities. The continued expansion of advanced imaging and growing focus on patient safety and efficient dose management are expected to sustain North America's leading position in the RDM market during the forecast period.
The breakdown of primary interview participants is as mentioned below:
- By Company Type: Tier 1 - 45%, Tier 2 - 35%, and Tier 3 - 20%
- By Designation: C-level Executives - 26%, Directors - 17%, and Others - 57%
- By Region: North America - 40%, Europe - 20%, Asia Pacific - 30%, Latin America- 6%, and Middle East - 4%
Bayer AG (Germany) and GE HealthCare (US) are among the key players in the radiation dose management market.
- The study includes an in-depth competitive analysis of these key players in the radiation dose management market, with their company profiles, recent developments, and key market strategies.
Research Coverage
The report analyzes the radiation dose management market. It aims to estimate the market size and future growth potential of various market segments based on offering, function, technology, deployment model, revenue model, modality, application, end user, and region. The report also provides a competitive analysis of the key players in this market, along with their company profiles, product offerings, recent developments, and key market strategies.
Reasons to buy this report
The report will help the market leaders/new entrants in this market with information on the closest approximations of the revenue numbers for the radiation dose management market and the subsegments. This report will help stakeholders understand the competitive landscape and gain more insights to position their businesses better and to plan suitable go-to-market strategies. The report also helps stakeholders understand the pulse of the market and provides them with information on key market drivers, restraints, challenges, and opportunities.
The report provides insights into the following pointers:
- Analysis of key drivers (increasing utilization and complexity of imaging procedures, increasing regulatory emphasis on dose monitoring, optimization, and reference levels, growing concerns regarding radiation exposure and dose optimization), restraints (high implementation, integration, and maintenance costs, shortage of skilled professionals for radiation dose management and optimization), opportunities (increasing adoption of AI-enabled radiation dose optimization, growing adoption of vendor-neutral and cloud-based dose management platforms, increasing focus on age-specific radiation dose optimization), and challenges (lack of standardized and interoperable dose data across modalities and systems, variability in dose benchmarks and imaging protocols across institutions) influencing the growth of the radiation dose management market
- Product Development/Innovation: Detailed insights into upcoming technologies, research & development activities, and new product & service launches in the radiation dose management market
- Market Development: Comprehensive information about lucrative markets (the report analyzes the radiation dose management market across varied regions)
- Market Diversification: Exhaustive information about new products & services, untapped geographies, recent developments, and investments in the radiation dose management market
- Competitive Assessment: In-depth assessment of market shares, growth strategies, and service offerings of leading players such as Bayer AG (Germany), GE HealthCare (US), Koninklijke Philips N.V. (Netherlands), Siemens Healthineers AG (Germany), Sectra AB (Sweden), and FUJIFILM Holdings Corporation (Japan)
TABLE OF CONTENTS
1 INTRODUCTION
- 1.1 STUDY OBJECTIVES
- 1.2 MARKET DEFINITION
- 1.3 MARKET SCOPE
- 1.3.1 MARKETS COVERED
- 1.3.2 INCLUSIONS AND EXCLUSIONS
- 1.3.3 YEARS CONSIDERED
- 1.4 CURRENCY CONSIDERED
- 1.5 STAKEHOLDERS
- 1.6 SUMMARY OF CHANGES
2 EXECUTIVE SUMMARY
- 2.1 KEY INSIGHTS AND MARKET HIGHLIGHTS
- 2.2 KEY MARKET PARTICIPANTS: SHARE INSIGHTS AND STRATEGIC DEVELOPMENTS
- 2.3 DISRUPTIVE TRENDS SHAPING MARKET
- 2.4 HIGH-GROWTH SEGMENTS & EMERGING FRONTIERS
- 2.5 SNAPSHOT: GLOBAL MARKET SIZE, GROWTH RATE, AND FORECAST
3 PREMIUM INSIGHTS
- 3.1 RADIATION DOSE MANAGEMENT MARKET OVERVIEW
- 3.2 NORTH AMERICA: RADIATION DOSE MANAGEMENT MARKET, BY OFFERING AND COUNTRY
- 3.3 RADIATION DOSE MANAGEMENT MARKET: REGIONAL GROWTH OPPORTUNITIES
4 MARKET OVERVIEW
- 4.1 INTRODUCTION
- 4.2 MARKET DYNAMICS
- 4.2.1 DRIVERS
- 4.2.1.1 Increasing utilization and complexity of imaging procedures
- 4.2.1.2 Increasing regulatory emphasis on dose monitoring, optimization, and reference levels
- 4.2.1.3 Growing concerns regarding radiation exposure and dose optimization
- 4.2.2 RESTRAINTS
- 4.2.2.1 High implementation and integration costs
- 4.2.2.2 Shortage of skilled professionals for radiation dose management and optimization
- 4.2.3 OPPORTUNITIES
- 4.2.3.1 Increasing adoption of AI-enabled radiation dose optimization
- 4.2.3.2 Growing adoption of vendor-neutral and cloud-based dose management platforms
- 4.2.3.3 Increasing focus on age-specific radiation dose optimization
- 4.2.4 CHALLENGES
- 4.2.4.1 Lack of standardized and interoperable dose data across modalities and systems
- 4.2.4.2 Variability in dose benchmarks and imaging protocols across institutions
- 4.2.1 DRIVERS
- 4.3 UNMET NEEDS AND WHITE SPACES
- 4.4 INTERCONNECTED MARKETS AND CROSS-SECTOR OPPORTUNITIES
- 4.5 STRATEGIC MOVES BY TIER-1/2/3 PLAYERS
5 INDUSTRY TRENDS
- 5.1 PORTER'S FIVE FORCES ANALYSIS
- 5.1.1 THREAT OF NEW ENTRANTS
- 5.1.2 THREAT OF SUBSTITUTES
- 5.1.3 BARGAINING POWER OF SUPPLIERS
- 5.1.4 BARGAINING POWER OF BUYERS
- 5.1.5 INTENSITY OF COMPETITIVE RIVALRY
- 5.2 MACROECONOMIC INDICATORS
- 5.2.1 INTRODUCTION
- 5.2.2 GDP TRENDS AND FORECAST
- 5.2.3 TRENDS IN GLOBAL HEALTHCARE IT INDUSTRY
- 5.3 VALUE CHAIN ANALYSIS
- 5.3.1 RESEARCH & PRODUCT DEVELOPMENT
- 5.3.2 DATA & KNOWLEDGE ASSETS
- 5.3.3 SOFTWARE & PLATFORM INFRASTRUCTURE
- 5.3.4 CLOUD SERVICE PROVIDERS
- 5.3.5 MARKETING & SALES
- 5.3.6 POST-SALES SERVICES
- 5.4 ECOSYSTEM ANALYSIS
- 5.5 PRICING ANALYSIS
- 5.5.1 INDICATIVE PRICE FOR RADIATION DOSE MANAGEMENT MARKET, BY PRODUCT (2025)
- 5.5.2 INDICATIVE PRICE FOR RADIATION DOSE MANAGEMENT MARKET, BY REGION (2025)
- 5.6 KEY CONFERENCES AND EVENTS
- 5.7 TRENDS/DISRUPTIONS IMPACTING CUSTOMERS' BUSINESSES
- 5.8 INVESTMENT AND FUNDING SCENARIO
- 5.9 CASE STUDY ANALYSIS
- 5.9.1 REDUCING CT DOSE THROUGH REAL-TIME DOSE MONITORING AND ALERTING
- 5.9.2 ESTABLISHING ENTERPRISE-WIDE, MULTI-MODALITY DOSE MANAGEMENT
- 5.9.3 REDUCED RADIATION DOSE IN SPECIALIST CANCER CARE
- 5.9.4 IMPROVED CARE COORDINATION
- 5.10 IMPACT OF US TARIFF OVERVIEW
- 5.10.1 INTRODUCTION
- 5.10.2 KEY TARIFF RATES
- 5.11 PRICE IMPACT ANALYSIS
- 5.12 IMPACT ON COUNTRY/REGION
- 5.12.1 US
- 5.12.2 EUROPE
- 5.12.3 ASIA PACIFIC
- 5.13 IMPACT ON END USERS
- 5.13.1 HOSPITALS AND HEALTHCARE SYSTEMS
- 5.13.2 DIAGNOSTIC AND IMAGING CENTERS
- 5.13.3 AMBULATORY SURGERY CENTERS
- 5.13.4 OTHER END USERS
6 STRATEGIC DISRUPTION THROUGH TECHNOLOGY, PATENTS, DIGITAL, AND AI ADOPTION
- 6.1 KEY EMERGING TECHNOLOGIES
- 6.1.1 AI-ENABLED RADIATION DOSE PREDICTION, MONITORING, AND OPTIMIZATION
- 6.1.2 PATIENT-SPECIFIC AND PERSONALIZED DOSIMETRY TECHNOLOGIES
- 6.1.3 ADVANCED IMAGING TECHNOLOGIES FOR RADIATION DOSE OPTIMIZATION
- 6.2 COMPLEMENTARY TECHNOLOGIES
- 6.2.1 DICOM, RADIATION DOSE STRUCTURED REPORTS (RDSR), AND INTEROPERABILITY TECHNOLOGIES
- 6.2.2 CLOUD-BASED, VENDOR-NEUTRAL, AND ENTERPRISE DOSE MANAGEMENT ARCHITECTURES
- 6.2.3 DOSE REGISTRIES, BENCHMARKING, AND POPULATION-LEVEL DOSE ANALYTICS
- 6.3 ADJACENT TECHNOLOGIES
- 6.3.1 COMPUTATIONAL DOSIMETRY AND PATIENT-SPECIFIC DOSE MODELING
- 6.4 TECHNOLOGY/PRODUCT ROADMAP
- 6.5 PATENT ANALYSIS
- 6.5.1 PATENT PUBLICATION TRENDS FOR RADIATION DOSE MANAGEMENT
- 6.5.2 INSIGHTS: JURISDICTION AND TOP APPLICANT ANALYSIS
- 6.6 FUTURE APPLICATIONS
- 6.6.1 AI-ASSISTED PERSONALIZED RADIATION DOSE MANAGEMENT
- 6.6.2 REAL-TIME DOSE OPTIMIZATION AND INTELLIGENT IMAGING WORKFLOW AUTOMATION
- 6.6.3 LONGITUDINAL RADIATION-EXPOSURE MANAGEMENT AND PREDICTIVE DOSE ANALYTICS
- 6.7 IMPACT OF AI/GEN AI ON RADIATION DOSE MANAGEMENT MARKET
- 6.7.1 INTRODUCTION
- 6.7.2 POTENTIAL OF AI/GEN AI IN RADIATION DOSE MANAGEMENT MARKET
- 6.7.3 CASE STUDIES RELATED TO AI/GEN AI IMPLEMENTATION
- 6.7.4 IMPACT OF AI/GEN AI ON INTERCONNECTED AND ADJACENT ECOSYSTEMS
- 6.7.5 MEDICAL IMAGING EQUIPMENT & IMAGING INFORMATICS
- 6.7.6 DOSE REGISTRIES, BENCHMARKING & QUALITY MANAGEMENT
- 6.7.7 AI-ENABLED IMAGING & CLINICAL WORKFLOW
- 6.7.8 USER READINESS AND IMPACT ASSESSMENT
- 6.7.8.1 User readiness
- 6.7.8.1.1 User A: Hospitals & integrated health systems
- 6.7.8.1.2 User B: Practices outpatient diagnostic imaging centers & radiology practices
- 6.7.8.1.3 User C: Interventional radiology & cardiology centers
- 6.7.8.2 Impact assessment
- 6.7.8.2.1 User A: Hospitals & integrated health systems
- 6.7.8.2.1.1 Implementation
- 6.7.8.2.1.2 Impact
- 6.7.8.2.2 User B: Outpatient diagnostic imaging centers & radiology practices
- 6.7.8.2.2.1 Implementation
- 6.7.8.2.2.2 Impact
- 6.7.8.2.3 User C: Interventional radiology & cardiology centers
- 6.7.8.2.3.1 Implementation
- 6.7.8.2.3.2 Impact
- 6.7.8.2.1 User A: Hospitals & integrated health systems
- 6.7.8.1 User readiness
7 REGULATORY LANDSCAPE
- 7.1 REGIONAL REGULATIONS AND COMPLIANCE
- 7.1.1 REGULATORY BODIES, GOVERNMENT AGENCIES, AND OTHER ORGANIZATIONS
- 7.1.2 REGULATORY FRAMEWORK
- 7.1.2.1 North America
- 7.1.2.2 Europe
- 7.1.2.3 Asia Pacific
- 7.1.2.4 Latin America
- 7.1.2.5 Middle East & Africa
- 7.1.3 INDUSTRY STANDARDS
8 CUSTOMER LANDSCAPE & BUYER BEHAVIOR
- 8.1 INTRODUCTION
- 8.2 DECISION-MAKING PROCESS
- 8.3 BUYER STAKEHOLDERS AND BUYING EVALUATION CRITERIA
- 8.4 KEY STAKEHOLDERS IN BUYING PROCESS
- 8.4.1 KEY STAKEHOLDERS IN BUYING PROCESS
- 8.4.2 BUYING CRITERIA
- 8.5 ADOPTION BARRIERS & INTERNAL CHALLENGES
- 8.6 UNMET NEEDS FROM VARIOUS END USERS
- 8.6.1 UNMET NEEDS
- 8.6.2 END USER EXPECTATIONS
- 8.7 MARKET PROFITABILITY
9 RADIATION DOSE MANAGEMENT MARKET, BY OFFERING
- 9.1 INTRODUCTION
- 9.2 SOLUTIONS
- 9.2.1 GROWING ADOPTION OF INTEGRATED AND AUTOMATED RADIATION DOSE MANAGEMENT SOLUTIONS TO DRIVE MARKET
- 9.2.2 STANDALONE SOLUTIONS
- 9.2.2.1 Growing demand for flexible and cost-effective dose monitoring solutions to boost market
- 9.2.3 INTEGRATED SOLUTIONS
- 9.2.3.1 Growing need for enterprise-wide, multi-vendor dose management to propel market
- 9.3 SERVICES
- 9.3.1 GROWING NEED FOR SPECIALIZED IMPLEMENTATION, CONSULTING, AND TRAINING EXPERTISE TO BOOST MARKET
- 9.3.2 SUPPORT & MAINTENANCE SERVICES
- 9.3.2.1 Growing need for continuous system availability and software updates to boost market
- 9.3.3 IMPLEMENTATION & INTEGRATION SERVICES
- 9.3.3.1 Growing hospital networks to drive demand for implementation and integration services
- 9.3.4 CONSULTING SERVICES
- 9.3.4.1 Growing need to interpret dose trends and identify outliers to drive segment
- 9.3.5 EDUCATION & TRAINING SERVICES
- 9.3.5.1 Increasing need for skilled personnel to support radiation dose optimization to boost segment
10 RADIATION DOSE MANAGEMENT MARKET, BY FUNCTION
- 10.1 INTRODUCTION
- 10.2 DOSE TRACKING & MONITORING
- 10.2.1 INCREASING ADOPTION OF AUTOMATED AND CONTINUOUS DOSE MONITORING
- 10.3 DOSE ANALYTICS & BENCHMARKING
- 10.3.1 GROWING NEED TO IDENTIFY DOSE OUTLIERS AND BENCHMARK IMAGING PERFORMANCE BOOSTS SEGMENT
- 10.4 DOSE REPORTING & REGULATORY COMPLIANCE
- 10.4.1 INCREASING REGULATORY EMPHASIS ON RADIATION DOSE DOCUMENTATION TO PROPEL SEGMENT
- 10.5 PROTOCOL & DOSE OPTIMIZATION
- 10.5.1 SEGMENT DRIVEN BY INCREASING FOCUS ON DOSE REDUCTION WHILE MAINTAINING DIAGNOSTIC IMAGE QUALITY
- 10.6 PATIENT RADIATION EXPOSURE MANAGEMENT
- 10.6.1 GROWING FOCUS ON PATIENT-SPECIFIC AND CUMULATIVE RADIATION EXPOSURE - KEY DRIVER
- 10.7 OTHER FUNCTIONS
- 10.7.1 INCREASING NEED FOR INTEROPERABILITY ACROSS HETEROGENEOUS IMAGING ENVIRONMENTS TO DRIVE SEGMENT
11 RADIATION DOSE MANAGEMENT MARKET, BY TECHNOLOGY
- 11.1 INTRODUCTION
- 11.2 AI-ENABLED TECHNOLOGY
- 11.2.1 GROWING ADOPTION OF AI DRIVES SEGMENT GROWTH
- 11.2.2 MACHINE LEARNING
- 11.2.2.1 Growing adoption of predictive and patient-specific dose optimization to boost segment
- 11.2.3 DEEP LEARNING
- 11.2.3.1 Increasing use of deep learning for automated imaging and dose optimization
- 11.2.4 COMPUTER VISION
- 11.2.4.1 Increasing automation of image analysis and anatomical assessment to drive segment
- 11.2.5 NATURAL LANGUAGE PROCESSING (NLP)
- 11.2.5.1 Increasing availability of unstructured clinical data - key driver
- 11.3 NON-AI/CONVENTIONAL TECHNOLOGY
- 11.3.1 ESTABLISHED CLINICAL ADOPTION AND REGULATORY RELIABILITY
12 RADIATION DOSE MANAGEMENT MARKET, BY DEPLOYMENT MODEL
- 12.1 INTRODUCTION
- 12.2 ON-PREMISE DEPLOYMENT
- 12.2.1 STRINGENT DATA-SECURITY POLICIES DRIVES SEGMENT GROWTH
- 12.3 CLOUD-BASED/WEB-BASED DEPLOYMENT
- 12.3.1 INCREASING NEED FOR SCALABLE, MULTI-SITE DOSE MONITORING AND REMOTE ACCESS TO IMAGING ANALYTICS BOOSTS DEMAND
13 RADIATION DOSE MANAGEMENT MARKET, BY REVENUE MODEL
- 13.1 INTRODUCTION
- 13.2 CAPITAL/ANNUAL PURCHASE MODEL
- 13.2.1 ESTABLISHED PROCUREMENT PRACTICES DRIVE DEMAND
- 13.3 PAY-PER-PROCEDURE MODEL
- 13.3.1 AFFORDABILITY DRIVES SEGMENT GROWTH
14 RADIATION DOSE MANAGEMENT MARKET, BY MODALITY
- 14.1 INTRODUCTION
- 14.2 COMPUTED TOMOGRAPHY (CT)
- 14.2.1 RAPID ADOPTION OF PHOTON-COUNTING CT AND AI-BASED RECONSTRUCTION TO DRIVE SEGMENT
- 14.3 FLUOROSCOPY & INTERVENTIONAL IMAGING
- 14.3.1 RISING PROCEDURAL COMPLEXITY INCREASES DEMAND FOR REAL-TIME RADIATION DOSE REDUCTION
- 14.4 RADIOGRAPHY
- 14.4.1 DIGITAL RADIOGRAPHY AND AI-BASED IMAGE ENHANCEMENT ENABLE LOWER EXPOSURE
- 14.5 MAMMOGRAPHY
- 14.5.1 EXPANSION OF 3D BREAST IMAGING DRIVES DEMAND
- 14.6 NUCLEAR MEDICINE
- 14.6.1 INCREASING USE OF HIGH-SENSITIVITY PET/SPECT AND AI-ENABLED RECONSTRUCTION TO DRIVE SEGMENT
- 14.6.2 PET
- 14.6.2.1 Higher PET sensitivity and AI reconstruction to boost demand
- 14.6.3 SPECT
- 14.6.3.1 Low-dose SPECT/CT technologies strengthen radiation optimization
- 14.6.4 HYBRID
- 14.6.4.1 Growing reliance on PET/CT and SPECT/CT drives market
15 RADIATION DOSE MANAGEMENT MARKET, BY APPLICATION
- 15.1 INTRODUCTION
- 15.2 ONCOLOGY
- 15.2.1 INCREASING FOCUS ON ONCOLOGY DRIVES DEMAND
- 15.3 CARDIOLOGY
- 15.3.1 INCREASING USE IN CARDIOLOGY BOOSTS DEMAND
- 15.4 ORTHOPEDIC
- 15.4.1 HIGH COMPLEXITY OF PROCEDURES DRIVES DEMAND
- 15.5 DENTAL
- 15.5.1 GROWING USE OF CBCT PROPELS DEMAND
- 15.6 OTHER APPLICATIONS
- 15.6.1 NEED TO MANAGE REPEATED EXAMINATIONS DRIVES DEMAND
16 RADIATION DOSE MANAGEMENT MARKET, BY END USER
- 16.1 INTRODUCTION
- 16.2 HOSPITALS & HEALTHCARE SYSTEMS
- 16.2.1 DIVERSE IMAGING FLEETS DRIVE CENTRALIZED RDM AND PROTOCOL OPTIMIZATION ACROSS HOSPITAL NETWORKS
- 16.3 DIAGNOSTIC & IMAGING CENTERS
- 16.3.1 HIGH EXAMINATION VOLUMES AND MULTI-SITE IMAGING OPERATIONS ACCELERATE DEMAND
- 16.4 AMBULATORY CARE SETTINGS
- 16.4.1 EXPANSION OF OUTPATIENT AND AMBULATORY IMAGING INCREASES DEMAND
- 16.5 ACADEMIC & RESEARCH INSTITUTES
- 16.5.1 SEGMENT DRIVEN BY AI-DRIVEN LOW-DOSE IMAGING AND NEXT-GENERATION DOSE OPTIMIZATION TECHNOLOGIES
- 16.6 OTHER END USERS
- 16.6.1 REGULATORY OVERSIGHT, POPULATION-LEVEL RADIATION MONITORING, AND CLINICAL-TRIAL - KEY DRIVERS
17 RADIATION DOSE MANAGEMENT MARKET, BY REGION
- 17.1 INTRODUCTION
- 17.2 NORTH AMERICA
- 17.2.1 MACROECONOMIC OUTLOOK FOR NORTH AMERICA
- 17.2.2 US
- 17.2.2.1 Regulatory focus on radiation safety drives market
- 17.2.3 CANADA
- 17.2.3.1 Increasing number of diagnostic imaging procedures to boost market
- 17.3 EUROPE
- 17.3.1 MACROECONOMIC OUTLOOK FOR EUROPE
- 17.3.2 GERMANY
- 17.3.2.1 Rising diagnostic imaging demand and aging population to drive market
- 17.3.3 FRANCE
- 17.3.3.1 Healthcare modernization to accelerate radiation dose management adoption
- 17.3.4 UK
- 17.3.4.1 Rising imaging volumes and NHS digitalization to support market growth
- 17.3.5 ITALY
- 17.3.5.1 Regulatory emphasis on dose optimization and monitoring to propel market
- 17.3.6 SPAIN
- 17.3.6.1 Growing focus on patient dosimetry and radiation dose optimization to drive market
- 17.3.7 REST OF EUROPE
- 17.4 ASIA PACIFIC
- 17.4.1 MACROECONOMIC OUTLOOK FOR ASIA PACIFIC
- 17.4.2 CHINA
- 17.4.2.1 Largest patient pool and increased healthcare spending to aid market growth
- 17.4.3 JAPAN
- 17.4.3.1 Large and technologically advanced hospital infrastructure
- 17.4.4 INDIA
- 17.4.4.1 Favorable government policies and improved healthcare infrastructure to support market growth
- 17.4.5 AUSTRALIA
- 17.4.5.1 Advancement of national diagnostic reference levels to accelerate radiation dose optimization
- 17.4.6 SOUTH KOREA
- 17.4.6.1 Increasing medical imaging volumes and patient radiation exposure to boost market
- 17.4.7 REST OF ASIA PACIFIC
- 17.5 LATIN AMERICA
- 17.5.1 MACROECONOMIC OUTLOOK FOR LATIN AMERICA
- 17.5.2 BRAZIL
- 17.5.2.1 Increasing regulatory focus and adoption of advanced imaging technologies to drive market
- 17.5.3 MEXICO
- 17.5.3.1 Rising demand for diagnostic imaging and adoption of lower-dose technologies to support market growth
- 17.5.4 REST OF LATIN AMERICA
- 17.6 MIDDLE EAST & AFRICA
- 17.6.1 MACROECONOMIC OUTLOOK FOR MIDDLE EAST & AFRICA
- 17.6.2 GCC COUNTRIES
- 17.6.2.1 Saudi Arabia
- 17.6.2.1.1 Growing healthcare expenditure to boost market growth
- 17.6.2.2 UAE
- 17.6.2.2.1 Increasing healthcare infrastructure investments to drive market growth
- 17.6.2.3 Rest of GCC
- 17.6.2.1 Saudi Arabia
- 17.6.3 SOUTH AFRICA
- 17.6.3.1 Increasing focus on radiation dose optimization to propel market growth
- 17.6.4 REST OF MIDDLE EAST & AFRICA
18 COMPETITIVE LANDSCAPE
- 18.1 OVERVIEW
- 18.2 KEY PLAYER STRATEGIES/RIGHT TO WIN, 2023-2026
- 18.3 REVENUE ANALYSIS, 2021-2025
- 18.4 MARKET SHARE ANALYSIS, 2021-2025
- 18.5 BRAND COMPARISON
- 18.6 COMPANY VALUATION AND FINANCIAL METRICS
- 18.7 COMPANY EVALUATION MATRIX: KEY PLAYERS, 2025
- 18.7.1 STARS
- 18.7.2 EMERGING LEADERS
- 18.7.3 PERVASIVE PLAYERS
- 18.7.4 PARTICIPANTS
- 18.7.5 COMPANY FOOTPRINT: KEY PLAYERS, 2025
- 18.7.5.1 Company footprint
- 18.7.5.2 Region footprint
- 18.7.5.3 Offering footprint
- 18.7.5.4 Deployment model footprint
- 18.7.5.5 Technology footprint
- 18.8 COMPANY EVALUATION MATRIX: STARTUPS/SMES, 2025
- 18.8.1 PROGRESSIVE COMPANIES
- 18.8.2 RESPONSIVE COMPANIES
- 18.8.3 DYNAMIC COMPANIES
- 18.8.4 STARTING BLOCKS
- 18.8.5 COMPETITIVE BENCHMARKING STARTUPS/SMES, 2025
- 18.9 COMPETITIVE SCENARIO
- 18.9.1 DEALS
- 18.9.2 OTHER DEVELOPMENTS
19 COMPANY PROFILES
- 19.1 KEY PLAYERS
- 19.1.1 BAYER AG
- 19.1.1.1 Products/solutions/services offered
- 19.1.1.2 Recent developments
- 19.1.1.2.1 Product launches & upgrades
- 19.1.1.2.2 Deals
- 19.1.1.2.3 Other developments
- 19.1.1.3 MnM view
- 19.1.1.3.1 Key strengths
- 19.1.1.3.2 Strategic choices
- 19.1.1.3.3 Weaknesses and competitive threats
- 19.1.2 SIEMENS HEALTHINEERS AG
- 19.1.2.1 Business overview
- 19.1.2.2 Products/solutions/services offered
- 19.1.2.3 Recent developments
- 19.1.2.3.1 Product launches & upgrades
- 19.1.2.3.2 Deals
- 19.1.2.3.3 Expansions
- 19.1.2.4 MnM view
- 19.1.2.4.1 Key strengths
- 19.1.2.4.2 Strategic choices
- 19.1.2.4.3 Weaknesses and competitive threats
- 19.1.3 KONINKLIJKE PHILIPS N.V.
- 19.1.3.1 Business overview
- 19.1.3.2 Products/solutions/services offered
- 19.1.3.3 Recent developments
- 19.1.3.3.1 Product launches & upgrades
- 19.1.3.3.2 Deals
- 19.1.3.4 MnM view
- 19.1.3.4.1 Key strengths
- 19.1.3.4.2 Strategic choices
- 19.1.3.4.3 Weaknesses and competitive threats
- 19.1.4 GE HEALTHCARE
- 19.1.4.1 Business overview
- 19.1.4.2 Products/solutions/services offered
- 19.1.4.3 Recent developments
- 19.1.4.3.1 Product launches & upgrades
- 19.1.4.3.2 Deals
- 19.1.4.3.3 Other developments
- 19.1.4.4 MnM view
- 19.1.4.4.1 Key strengths
- 19.1.4.4.2 Strategic choices
- 19.1.4.4.3 Weaknesses and competitive threats
- 19.1.5 FUJIFILM HOLDINGS CORPORATION
- 19.1.5.1 Business overview
- 19.1.5.2 Products/solutions/services offered
- 19.1.5.3 Recent developments
- 19.1.5.3.1 Product launches & upgrades
- 19.1.5.3.2 Deals
- 19.1.5.3.3 Other developments
- 19.1.5.4 MnM view
- 19.1.5.4.1 Key strengths
- 19.1.5.4.2 Strategic choices
- 19.1.5.4.3 Weaknesses and competitive threats
- 19.1.6 SECTRA AB
- 19.1.6.1 Business overview
- 19.1.6.2 Products/solutions/services offered
- 19.1.6.3 Recent developments
- 19.1.6.3.1 Product launches & upgrades
- 19.1.6.3.2 Deals
- 19.1.6.3.3 Other developments
- 19.1.7 CANON INC.
- 19.1.7.1 Business overview
- 19.1.7.2 Products/solutions/services offered
- 19.1.7.3 Recent developments
- 19.1.7.3.1 Product launches & upgrades
- 19.1.7.3.2 Deals
- 19.1.7.3.3 Other developments
- 19.1.8 AGFA-GEVAERT N.V.
- 19.1.8.1 Business overview
- 19.1.8.2 Products/solutions/services offered
- 19.1.8.3 Recent developments
- 19.1.8.3.1 Product launches & upgrades
- 19.1.8.3.2 Deals
- 19.1.9 PACSHEALTH, LLC
- 19.1.9.1 Business overview
- 19.1.9.2 Products/solutions/services offered
- 19.1.9.3 Recent developments
- 19.1.9.3.1 Deals
- 19.1.10 QAELUM
- 19.1.10.1 Business overview
- 19.1.10.2 Products/solutions/services offered
- 19.1.10.3 Recent developments
- 19.1.10.3.1 Deals
- 19.1.11 MEDSQUARE
- 19.1.11.1 Business overview
- 19.1.11.2 Products/solutions/services offered
- 19.1.11.3 Recent developments
- 19.1.11.3.1 Product launches & upgrades
- 19.1.11.3.2 Deals
- 19.1.12 NOVARAD
- 19.1.12.1 Business overview
- 19.1.12.2 Products/solutions/services offered
- 19.1.13 INFINITT HEALTHCARE CO., LTD.
- 19.1.13.1 Business overview
- 19.1.13.2 Products/solutions/services offered
- 19.1.14 CARESTREAM HEALTH
- 19.1.14.1 Business overview
- 19.1.14.2 Products/solutions/services offered
- 19.1.14.3 Recent developments
- 19.1.14.3.1 Product Launches & upgrades
- 19.1.14.3.2 Deals
- 19.1.15 SHIMADZU CORPORATION
- 19.1.15.1 Business overview
- 19.1.15.2 Products/solutions/services offered
- 19.1.15.3 Recent developments
- 19.1.15.3.1 Products launches & upgrades
- 19.1.15.3.2 Deals
- 19.1.16 NANJING PERLOVE MEDICAL EQUIPMENT CO., LTD.
- 19.1.16.1 Business overview
- 19.1.16.2 Products/solutions/services offered
- 19.1.16.3 Recent developments
- 19.1.16.3.1 Product Launches & upgrades
- 19.1.16.3.2 Deals
- 19.1.17 NEUSOFT MEDICAL SYSTEMS CO., LTD.
- 19.1.17.1 Business overview
- 19.1.17.2 Products/solutions/services offered
- 19.1.17.3 Recent developments
- 19.1.17.3.1 Product launches & upgrades
- 19.1.17.3.2 Deals
- 19.1.18 KONICA MINOLTA, INC
- 19.1.18.1 Business overview
- 19.1.18.2 Products/solutions/services offered
- 19.1.18.3 Recent developments
- 19.1.18.3.1 Product Launches & upgrades
- 19.1.18.3.2 Deals
- 19.1.19 IBA
- 19.1.19.1 Business overview
- 19.1.19.2 Products/solutions/services offered
- 19.1.19.3 Recent developments
- 19.1.19.3.1 Product launches & upgrades
- 19.1.19.3.2 Deals
- 19.1.20 LUNIT INC.
- 19.1.20.1 Business overview
- 19.1.20.2 Products/solutions/services offered
- 19.1.20.3 Recent developments
- 19.1.20.3.1 Deals
- 19.1.1 BAYER AG
- 19.2 OTHER PLAYERS
- 19.2.1 QIT SYSTEME GMBH
- 19.2.2 IMALOGIX
- 19.2.3 IDOSE
- 19.2.4 MYXRAYDOSE LTD.
- 19.2.5 VIRTUAL PHANTOMS INC.
20 RESEARCH METHODOLOGY
- 20.1 RESEARCH APPROACH
- 20.1.1 SECONDARY RESEARCH
- 20.1.1.1 Key data from secondary sources
- 20.1.2 PRIMARY RESEARCH
- 20.1.2.1 Key data from primary sources
- 20.1.2.2 Insights from primary experts
- 20.1.1 SECONDARY RESEARCH
- 20.2 RESEARCH METHODOLOGY
- 20.3 MARKET SIZE ESTIMATION
- 20.4 MARKET BREAKDOWN DATA TRIANGULATION
- 20.5 MARKET SHARE ESTIMATION
- 20.6 STUDY ASSUMPTIONS
- 20.7 LIMITATIONS
- 20.7.1 SCOPE-RELATED LIMITATIONS
- 20.7.2 METHODOLOGY-RELATED LIMITATIONS
- 20.8 RISK ASSESSMENT
21 APPENDIX
- 21.1 DISCUSSION GUIDE
- 21.2 KNOWLEDGESTORE: MARKETSANDMARKETS' SUBSCRIPTION PORTAL
- 21.3 CUSTOMIZATION OPTIONS
- 21.4 RELATED REPORTS
- 21.5 AUTHOR DETAILS