|
시장보고서
상품코드
1430952
상용차 윤활유 시장 : 시장 점유율 분석, 산업 동향 및 통계, 성장 예측(2021-2026년)Global Commercial Vehicles Lubricants - Market Share Analysis, Industry Trends & Statistics, Growth Forecasts (2021 - 2026) |
||||||
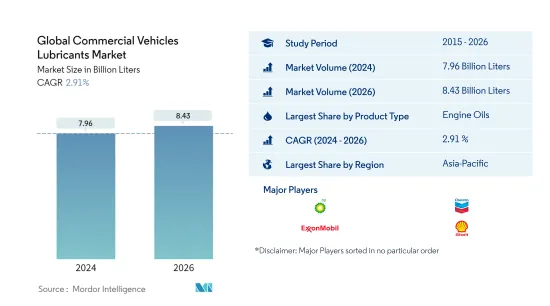
상용차 윤활유 세계 시장 규모는 2024년 79억 6,000만 리터로 추정되며, 2026년에는 84억 3,000만 리터에 달할 것으로 예상되며, 예측 기간(2024-2026년) 동안 2.91%의 연평균 복합 성장률(CAGR)을 나타낼 것으로 예측됩니다.
주요 하이라이트
- 제품 유형별 최대 부문 - 엔진오일: 엔진오일은 고온, 고압에서 사용되기 때문에 CV 분야에서 가장 인기 있는 제품 유형으로, 많은 양이 필요하고 배유 간격이 짧습니다.
- 제품 유형별 가장 빠른 부문 - 변속기 및 기어 오일: 변속기 오일의 소비량은 전 세계 CV 부문의 모든 제품 카테고리 중 가장 높을 것으로 예상되며, LCV와 트럭의 사용이 증가할 것으로 예상됩니다.
- 가장 규모가 큰 지역 시장 - 아시아태평양: 아시아태평양에는 중국, 인도, 일본 등 대규모 자동차 보유국이 있습니다. 그 결과, 이 분야의 윤활유 소비량은 아시아태평양에서 가장 큰 비중을 차지합니다.
- 급성장하는 지역 시장 - 아시아태평양: 합성 윤활유 보급률이 낮고 인도와 같은 국가에서 트럭 차량의 높은 성장률이 예상됨에 따라 아시아태평양의 윤활유 소비를 촉진할 것으로 보입니다.
상용차 윤활유 시장 동향
상용차 윤활유 시장 동향제품 유형별 최대 부문: 엔진오일
- 2015년부터 2019년까지 세계 상용차 부문의 윤활유 소비량은 연평균 2%의 성장률을 기록했습니다. 이 분야의 윤활유 제품 유형은 엔진 오일이 압도적으로 많았으며 2020년에는 73%의 점유율을 차지했고, 변속기 오일이 11.5%의 점유율을 차지했습니다.
- 2020년 코로나19가 발생했을 때, 전염병에 대응하기 위한 봉쇄로 인해 화물 운송이 크게 감소했습니다. 따라서이 부문의 윤활유 소비량은 2019 년에 비해 7.8% 감소했습니다.
- 예상되는 물류 요구 사항의 호황과 신형 상용차 판매의 회복은이 부문의 윤활유 소비를 촉진할 것으로 보입니다. 따라서 상용차의 윤활유 소비는 2021년부터 2026년까지 연평균 3.2%의 성장률을 보일 것으로 예상됩니다.
최대 지역: 아시아태평양
- 지역별로는 아시아태평양의 상용차(CV) 윤활유 소비량이 전 세계 CV 윤활유 소비량의 약 41.5%를 차지하며, 유럽이 17.7%, 북미가 12.6%의 점유율을 차지합니다.
- COVID-19 발생 후 사업 및 운송 활동에 대한 제한이 부과되면서 2020년 전체 지역 CV 윤활유 소비에 부정적인 영향을 미쳤습니다. 북미가 가장 큰 영향을 받아 2019-2020년 소비량이 12.1% 감소했고, 유럽이 11.8% 감소했습니다.
- 2021-2026년 동안 소비량은 CAGR 4.38%로 증가할 것으로 예상되므로 아시아태평양이 가장 빠르게 성장하는 CV 윤활유 시장이 될 가능성이 높으며, 아프리카가 CAGR 3.09%, 남미가 CAGR 3.0%로 그 뒤를 이을 것으로 예상됩니다.
상용차 윤활유 산업 개요
상용차 윤활유 세계 시장은 세분화되어 있으며, 상위 5개 기업이 39.20%를 차지하고 있습니다. 이 시장의 주요 기업은 BP PLC(Castrol), Chevron Corporation, Chevron Corporation, ExxonMobil Corporation, Royal Dutch Shell PLC, TotalEnergies(알파벳순)입니다.
기타 혜택 :
기타 혜택- 엑셀 형식 시장 예측(ME) 시트
- 3개월간의 애널리스트 지원
목차
제1장 주요 요약과 주요 조사 결과
제2장 서론
- 조사의 전제조건과 시장 정의
- 조사 범위
- 조사 방법
제3장 주요 산업 동향
- 자동차 업계 동향
- 규제 프레임워크
- 밸류체인과 유통 채널 분석
제4장 시장 세분화
- 제품 유형별
- 엔진오일
- 그리스
- 유압작동유
- 변속기&기어 오일
- 지역별
- 아프리카
- 이집트
- 모로코
- 나이지리아
- 남아프리카공화국
- 기타 아프리카
- 아시아태평양
- 중국
- 인도
- 인도네시아
- 일본
- 말레이시아
- 필리핀
- 싱가포르
- 한국
- 태국
- 베트남
- 기타 아시아태평양
- 유럽
- 불가리아
- 프랑스
- 독일
- 이탈리아
- 노르웨이
- 폴란드
- 러시아
- 스페인
- 영국
- 기타 유럽
- 중동
- 이란
- 카타르
- 사우디아라비아
- 터키
- 아랍에미리트
- 기타 중동
- 북미
- 캐나다
- 멕시코
- 미국
- 기타 북미
- 남미
- 아르헨티나
- 브라질
- 콜롬비아
- 기타 남미
- 아프리카
제5장 경쟁 구도
- 주요 전략적 동향
- 시장 점유율 분석
- 기업 개요
- BP PLC(Castrol)
- Chevron Corporation
- China National Petroleum Corporation
- China Petroleum & Chemical Corporation
- ENEOS Corporation
- ExxonMobil Corporation
- Idemitsu Kosan Co. Ltd
- Royal Dutch Shell PLC
- TotalEnergies
- Valvoline Inc.
제6장 부록
- 부록 1 참고 문헌
- 부록 2 도표
제7장 CEO에 대한 주요 전략적 질문
LSH 24.02.29The Global Commercial Vehicles Lubricants Market size is estimated at 7.96 Billion Liters in 2024, and is expected to reach 8.43 Billion Liters by 2026, growing at a CAGR of 2.91% during the forecast period (2024-2026).

Key Highlights
- Largest Segment by Product Type - Engine Oils : Since it has high-temperature and high-pressure uses, engine oil is the most popular product type in the CV sector, with large volume needs and shorter drain intervals.
- Fastest Segment by Product Type - Transmission & Gear Oils : Transmission oil consumption is predicted to be the highest among all product categories in the global CV sector, with the use of LCVs and trucks expected to rise.
- Largest Regional Market - Asia-Pacific : Asia-Pacific is home to countries with large vehicle fleets like China, India, and Japan. As a result, the lubricant consumption by this sector was highest in Asia-Pacific.
- Fastest Growing Regional Market - Asia-Pacific : The low penetration of synthetic lubricants and expected high growth rates of the truck fleet in countries like India are likely to drive lubricant consumption in APAC.
Commercial Vehicles Lubricants Market Trends
Largest Segment By Product Type : Engine Oils
- During 2015-2019, lubricant consumption in the global commercial vehicle sector increased at a CAGR of 2%. Engine oil was the dominating lubricant product type in this sector, accounting for a share of 73% in 2020, followed by transmission oils, which accounted for a share of 11.5%.
- During the COVID-19 outbreak in 2020, freight transportation significantly dropped due to the lockdowns in response to the pandemic. Hence, lubricant consumption in this sector declined by 7.8% compared to 2019.
- The projected boom in logistic requirements and recovery in sales of new commercial vehicles are likely to drive lubricant consumption in this sector. Hence, commercial vehicle lubricant consumption is expected to increase at a CAGR of 3.2% during 2021-2026.
Largest Region : Asia-Pacific
- By geography, lubricant consumption of commercial vehicles (CV) was the highest in Asia-Pacific, at around 41.5% of the total CV lubricant consumption globally, followed by Europe and North America, which accounted for a share of 17.7% and 12.6%, respectively.
- The restrictions imposed on business and transportation activities after the COVID-19 outbreak negatively affected CV lubricant consumption across the region in 2020. North America was the most affected, as it recorded a 12.1% drop in consumption during 2019-2020, followed by Europe, which recorded an 11.8% drop.
- During 2021-2026, Asia-Pacific is likely to be the fastest-growing CV lubricant market as the consumption is likely to increase at a CAGR of 4.38%, followed by Africa and South America, with an expected CAGR of 3.09% and 3.0%, respectively.
Commercial Vehicles Lubricants Industry Overview
The Global Commercial Vehicles Lubricants Market is fragmented, with the top five companies occupying 39.20%. The major players in this market are BP PLC (Castrol), Chevron Corporation, ExxonMobil Corporation, Royal Dutch Shell PLC and TotalEnergies (sorted alphabetically).
Additional Benefits:
- The market estimate (ME) sheet in Excel format
- 3 months of analyst support
TABLE OF CONTENTS
1 Executive Summary & Key Findings
2 Introduction
- 2.1 Study Assumptions & Market Definition
- 2.2 Scope of the Study
- 2.3 Research Methodology
3 Key Industry Trends
- 3.1 Automotive Industry Trends
- 3.2 Regulatory Framework
- 3.3 Value Chain & Distribution Channel Analysis
4 Market Segmentation
- 4.1 By Product Type
- 4.1.1 Engine Oils
- 4.1.2 Greases
- 4.1.3 Hydraulic Fluids
- 4.1.4 Transmission & Gear Oils
- 4.2 By Region
- 4.2.1 Africa
- 4.2.1.1 Egypt
- 4.2.1.2 Morocco
- 4.2.1.3 Nigeria
- 4.2.1.4 South Africa
- 4.2.1.5 Rest of Africa
- 4.2.2 Asia-Pacific
- 4.2.2.1 China
- 4.2.2.2 India
- 4.2.2.3 Indonesia
- 4.2.2.4 Japan
- 4.2.2.5 Malaysia
- 4.2.2.6 Philippines
- 4.2.2.7 Singapore
- 4.2.2.8 South Korea
- 4.2.2.9 Thailand
- 4.2.2.10 Vietnam
- 4.2.2.11 Rest of Asia-Pacific
- 4.2.3 Europe
- 4.2.3.1 Bulgaria
- 4.2.3.2 France
- 4.2.3.3 Germany
- 4.2.3.4 Italy
- 4.2.3.5 Norway
- 4.2.3.6 Poland
- 4.2.3.7 Russia
- 4.2.3.8 Spain
- 4.2.3.9 United Kingdom
- 4.2.3.10 Rest of Europe
- 4.2.4 Middle East
- 4.2.4.1 Iran
- 4.2.4.2 Qatar
- 4.2.4.3 Saudi Arabia
- 4.2.4.4 Turkey
- 4.2.4.5 UAE
- 4.2.4.6 Rest of Middle East
- 4.2.5 North America
- 4.2.5.1 Canada
- 4.2.5.2 Mexico
- 4.2.5.3 United States
- 4.2.5.4 Rest of North America
- 4.2.6 South America
- 4.2.6.1 Argentina
- 4.2.6.2 Brazil
- 4.2.6.3 Colombia
- 4.2.6.4 Rest of South America
- 4.2.1 Africa
5 Competitive Landscape
- 5.1 Key Strategic Moves
- 5.2 Market Share Analysis
- 5.3 Company Profiles
- 5.3.1 BP PLC (Castrol)
- 5.3.2 Chevron Corporation
- 5.3.3 China National Petroleum Corporation
- 5.3.4 China Petroleum & Chemical Corporation
- 5.3.5 ENEOS Corporation
- 5.3.6 ExxonMobil Corporation
- 5.3.7 Idemitsu Kosan Co. Ltd
- 5.3.8 Royal Dutch Shell PLC
- 5.3.9 TotalEnergies
- 5.3.10 Valvoline Inc.
6 Appendix
- 6.1 Appendix-1 References
- 6.2 Appendix-2 List of Tables & Figures