|
시장보고서
상품코드
1438366
실리카 샌드 시장 : 점유율 분석, 산업 동향 및 통계, 성장 예측(2024-2029)Silica Sand - Market Share Analysis, Industry Trends & Statistics, Growth Forecasts (2024 - 2029) |
||||||
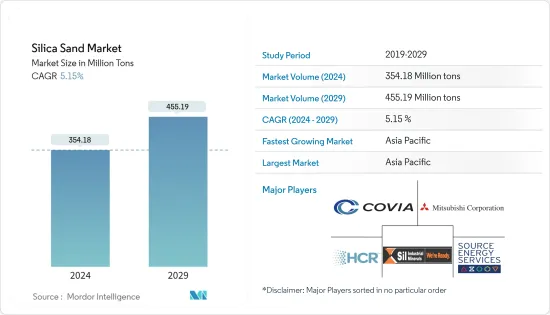
실리카 샌드(Silica Sand) 시장 규모는 2024년 3억 5,418만 톤으로 추정되며, 2029년까지 4억 5,519만 톤에 이를 것으로 예측되며, 예측 기간(2024년-2029년) 동안 5.15%의 CAGR로 추이하며 성장할 전망입니다.
COVID-19로 시장은 악영향을 받았습니다. 전염병 때문에 세계 여러 나라가 바이러스의 확산을 억제하기 위해 락 다운에 들어갔습니다. 많은 기업과 공장의 폐쇄로 인해 세계 공급 네트워크가 혼란스러워졌으며, 세계 생산, 배송 일정, 제품 판매에 부정적인 영향을 미쳤습니다. 현재 시장은 COVID-19 팬데믹으로부터 회복되었으며 크게 증가하고 있습니다.
주요 하이라이트
- 중기적으로 시장의 성장을 견인하는 주요 요인은 주조 산업에서 수요가 증가하고 유리 산업에서 수요가 증가하는 것입니다.
- 반대로 대체품의 가용성과 실리카 샌드 채굴이 환경에 미치는 영향에 대한 우려로 인해 시장 성장이 억제될 수 있습니다.
- 성장하는 수처리 산업은 향후 몇 년동안 시장 기회가 될 수 있습니다.
- 아시아 태평양이 가장 높은 시장 점유율을 차지하며, 이 지역은 예측 기간 동안 시장을 독점할 수 있습니다.
실리카 샌드 시장 동향
시장을 독점하는 석유 및 가스 산업
- 석유 산업에서 실리카 샌드는 프랙샌드라고합니다. 여기서 중요한 것은 실리카의 경도입니다. 화학적으로 순도가 높기 때문에 부식성 환경을 공격할 수 있습니다. 그 과립의 증착은 지층의 긁힘을 극대화하고 깊은 우물로 펌핑하여 석유 유량을 향상시키는 데 도움이 됩니다.
- '플럭스 샌드' 라고도 알려진 실리카 샌드는 석유 및 가스 회사가 비재래형의 저침투성 저류층으로부터 천연 가스, 액체 천연 가스, 석유를 생산하는데 사용하는 완성 방법인 수압 파쇄('플래킹')에서 사용에서 유래합니다.
- 실리카 샌드는 혈암을 파괴하고 암석의 기공에서 천연 가스, 석유 및 천연 가스 액체를 방출하는 과정에 필수적입니다. 고압 수류로 작은 구멍이 큰 균열로 강제되면, 수압 파쇄 모래는 이러한 균열을 열린 상태로 유지하고 화석 연료를 계속 방출합니다. 이러한 균열을 넓히기 위해 백사(또는 다른 유형의 천연 또는 합성 물질)를 사용하는 경우 프로판트라고합니다.
- 워터 펌프가 정지되면 천연 가스와 석유가 추출되는 기공이 수축되지 않도록 균열을 열어 두어야합니다. 따라서 프로판트는 가능한 한 내구성이 있고 내충격성이 있어야 합니다. 프로판트는 균열로 인한 거대한 압력을 오래 견딜 수 있습니다. 더 많은 석유를 추출할 수 있어 우물의 효율성을 극대화합니다.
- 국제에너지기구에 따르면 세계 석유 소비량은 2026년까지 일량 1억 410만 배럴에 달할 것으로 예상됩니다. 이것은 현재 레벨보다 일량 440만 배럴 증가하게 됩니다. 또한 국제에너지기구는 세계 석유 수요가 2023년 일량 190만 배럴 증가하여 기록적인 일량 10170만 배럴이 될 것으로 예측하고 있으며 이는 COVID-19의 제한이 해제됨 중국 증가분의 거의 절반에 해당합니다.
- 세계 석유 수요는 일량 570만 배럴(일량 100만 배럴) 증가할 것으로 예상되고 있으며, 2025년까지 중국과 인도가 증가분의 약 절반을 차지하게 됩니다. 동시에 세계 석유 생산 능력은 5.9 배럴 증가할 것으로 예상됩니다. MB/일. OPEC(석유수출국기구)가 1.4 mb/일의 원유 및 천연가스의 액체생산능력을 추가로 구축함에 따라 비OPEC(석유수출국기구)공급은 4.5 mb/d 증가할 수 있으며 조사 대상 석유 및 가스 산업 시장에 대한 수요 증가를 보여줍니다.
- 2022년 북미 원유와 액체연료의 총 생산량은 일량 2,781만 배럴이었지만, 2021년은 일량 2,644만 배럴이었습니다. 미국 에너지 정보국(EIA)에 따르면 미국의 원유 생산량은 2022년 12월 연간 1,211만 5,000배럴에 대해, 2023년 1월에는 1,246만 2,000배럴에 달했습니다. 미국은 석유 탐사에서 세계를 선도하는 국가 중 하나입니다. 비재래형 원유 매장량은 조사 대상이 되는 국내 시장에 큰 기회임을 보여줍니다.
- 그러므로 위와 같은 점은 석유 및 가스산업이 시장을 독점할 가능성이 높아 그 결과 예측기간 동안 실리카 샌드 수요가 높아질 것으로 예상됩니다.
아시아 태평양이 시장을 독점
- 아시아 태평양은 조사 대상 시장을 독점할 것으로 예상되고 있으며, 중국과 인도 등 주요 경제국이 지역 전체의 성장을 견인하고 있습니다.
- 석유 및 가스 부문은 중국에서 실리카 샌드의 가장 큰 응용 산업 중 하나입니다. 중국은 지난 20년 동안 성장하는 경제에 맞추어 정제 능력을 확대하기 위한 투자를 해왔습니다. 또한, 중국은 장기간에 걸쳐 모든 유형의 원유의 정제 능력을 계속 확대하고 있습니다. 에너지 조사에 따르면 중국은 2025년 말에 2천만 배럴의 정화 능력을 등록할 가능성이 높아 향후 수년간 실리카 샌드 수요를 야기할 것입니다.
- 또한 중국의 원유 생산량은 2022년 첫 2개월 만에 3,347만 톤을 기록했으며, 전년 동기 대비 4.6% 증가했습니다. 중국 국가 통계국에 따르면 하루 당 원유 생산량은 약 57만 6,000톤입니다.
- 유리 제조 산업은 건설 산업과 자동차 산업을 포함한 여러 산업에서 유리 채택 증가에 따라 중국에서 가장 빠르게 성장하고 있습니다. 중국 국가 통계국에 따르면 중국은 2023년 4월에 약 4,307만 평방미터의 강화 유리를 생산했습니다. 게다가 2022년 강화 유리의 총 생산량은 약 5억 8,000만 평방미터였습니다.
- 2022년 7월 현재 유엔은 인도의 현재 인구를 14억 명 이상으로 추정하고 있습니다. 급속한 도시화와 인구 증가로 향후 수년간 석유 수요가 증가할 것으로 예상됩니다. 인도 브랜드 에퀴티 재단(IBEF)에 따르면 인도는 2045년까지 일량 1,100만 배럴을 기록할 가능성이 높다고 합니다. 디젤 수요는 2029-30년까지 2배의 163톤으로 증가할 것으로 예측되고 있습니다. 이 나라는 세계 3위의 석유 수입국으로 연간 약 2억 4,900만 톤(일량 500만 배럴에 상당)의 정제 능력이 있습니다. 그 정제 능력은 향후 5년간 연간 2억 9,800만 톤으로 증가할 것으로 예상됩니다.
- 또한 인도의 유리 산업의 성장은 주로 건설 부문에 의해 견인되었습니다. 주택건축 프로젝트에서 판유리에 대한 수요가 증가함에 따라 건설 및 인프라 산업은 인도의 판유리 시장에서 최고 시장 점유율을 차지합니다. 또한 인도에 본사를 둔 이 제조업체는 생산 능력과 제품 포트폴리오를 크게 확대하고 있습니다.
- 2022년 3월 프랑스 플로트 유리 제조업체인 산고반은 인도 첸나이 서부의 슬리퍼 암부두르에 있는 월드 유리 캠퍼스의 새로운 플로트 유리 시설과 통합 창 라인에 500캐롤 루피(6,763만 달러) 투자했습니다.
- 앞서 언급한 요인은 아시아 태평양의 실리카 샌드 시장의 강한 성장 가능성을 보여줍니다.
기타 혜택
- 엑셀 형식 시장 예측(ME) 시트
- 3개월의 애널리스트 서포트
목차
제1장 서론
- 조사의 전제조건
- 조사 범위
제2장 조사 방법
제3장 주요 요약
제4장 시장 역학
- 성장 촉진 요인
- 주조 업계로부터 수요 증가
- 유리 업계로부터 수요 증가
- 억제 요인
- 대체 요원 확보
- 모래 불법 채굴
- 실리카 샌드 채굴에 의한 환경에 대한 영향에 대한 우려
- 산업 가치사슬 분석
- 포터 Five Forces
- 공급기업의 협상력
- 소비자의 협상력
- 신규 참가업체의 위협
- 대체 제품 및 서비스의 위협
- 경쟁도
제5장 시장 세분화(시장 규모(수량))
- 최종 사용자 산업
- 유리 제조
- 주물 공장
- 화학제품의 제조
- 건설
- 페인트 및 코팅
- 세라믹 및 내화물
- 여과
- 석유 및 가스
- 기타 최종 사용자 산업
- 지역
- 아시아 태평양
- 중국
- 인도
- 일본
- 한국
- 기타 아시아 태평양
- 북미
- 미국
- 캐나다
- 멕시코
- 유럽
- 독일
- 영국
- 이탈리아
- 프랑스
- 기타 유럽
- 남미
- 브라질
- 아르헨티나
- 기타 남미
- 중동 및 아프리카
- 사우디아라비아
- 남아프리카공화국
- 기타 중동 및 아프리카
- 아시아 태평양
제6장 경쟁 구도
- 합병과 인수, 합작사업, 협업 및 계약
- 시장 점유율(%)**/랭킹 분석
- 유력 기업이 채택한 전략
- 기업 개요
- Badger Mining Corporation
- Chongqing Changjiang River Moulding Material Group Co. Ltd
- Covia Holdings LLC
- Euroquarz GmbH
- Hi-Crush Inc.
- JFE Mineral &Alloy Company Ltd
- Mitsubishi Corporation
- PUM GROUP
- Sibelco
- Sil Industrial Minerals
- Source Energy Services
- Superior Silica Sands
- Tochu Corporation
- US Silica
제7장 시장 기회 및 향후 동향
- 성장하는 수처리 산업
- 기타 기회
The Silica Sand Market size is estimated at 354.18 Million tons in 2024, and is expected to reach 455.19 Million tons by 2029, growing at a CAGR of 5.15% during the forecast period (2024-2029).

The market was negatively impacted due to COVID-19. Owing to the pandemic, several countries worldwide went into lockdown to curb the spread of the virus. The shutdown of numerous companies and factories has disrupted worldwide supply networks and harmed global production, delivery schedules, and product sales. Currently, the market has recovered from the COVID-19 pandemic and increasing at a significant rate.
Key Highlights
- Over the medium term, the major factors driving the market growth are the increasing demand from the foundry industry and the growing demand from the glass industry.
- On the flip side, the availability of substitutes and concerns over the environmental impacts of silica sand mining is likely to restrain the market growth.
- The growing water treatment industry is likely to act as an opportunity for the market in the coming years.
- Asia-Pacific accounted for the highest market share, and the region is likely to dominate the market during the forecast period.
Silica Sand Market Trends
Oil and Gas Industry to Dominate the Market
- In the oil industry, silica sand is referred to as frac sand. The hardness of silica is important here. Because of its chemical purity, it can attack corrosive environments. Its granules deposit maximizes formation cuttings, and when pumped down in deep wells, it helps improve the oil flow rate.
- Silica sand, also known as "frac sand," comes from its use in hydraulic fracturing ("fracking"), a completion method used by oil and gas companies to produce natural gas, natural gas liquids, and oil from unconventional, low permeability reservoirs such as shale.
- Silica sand is essential in the process of fracturing shale to release natural gas, oil, and natural gas liquids from pores in the rock. When the high-pressure water stream forces the small perforations to become larger fractures, fracking sand keeps these fractures open to continue releasing fossil fuels. When white sand (or any other type of natural or synthetic substance) is used to prop open these fractures, it is referred to as a proppant.
- When the water pumps are turned off, the fractures must be kept open so the pores from which natural gas and oil are extracted do not deflate. That is why a proppant must be as durable and crush-resistant as possible. The longer the proppant can withstand the enormous pressure of the fractures. The more petroleum can be extracted, maximizing the well's efficiency.
- According to the International Energy Agency, global oil consumption is expected to reach 104.1 million barrels per day by 2026. This would be a 4.4 mb/d increase over current levels. Furthermore, the International Energy Agency projects that global oil demand will increase by 1.9 mb/d in 2023 to a record 101.7 mb/d, nearly half of the increase from China when its Covid limitations were lifted.
- The global oil demand is expected to rise by 5.7 mb/d (million barrels per day), with China and India accounting for about half of the growth by 2025. At the same time, the world's oil production capacity is expected to rise by 5.9 mb/d. Non-OPEC (Organization of the Petroleum Exporting Countries) supply is likely to increase by 4.5 mb/d as OPEC builds another 1.4 mb/d of crude and natural gas liquids capacity, indicating increased demand for the studied market in the oil and gas industry.
- The total production of crude oil and liquid fuels in North America in 2022 was 27.81 million barrels per day, while in 2021 was 26.44 million barrels per day. According to the US Energy Information Administration (EIA), crude oil production in the United States reached 12,462 thousand barrels in January 2023, compared to 12,115 thousand barrels annually in December 2022. The United States is one of the leading countries globally in the exploration of unconventional crude oil reserves, indicating a massive opportunity for the studied market in the country.
- Thus, due to the abovementioned points, the oil and gas industry is likely to dominate the market, which, in turn, is expected to enhance the demand for silica sand during the forecast period.
Asia-Pacific Region to Dominate Market
- The Asian-Pacific region is expected to dominate the studied market, with major economies like China and India leading the growth across the region.
- The oil and gas sector is one of the largest application industries for silica sand in China. China has invested to scale up its refining capacity over the past two decades to its growing economy. Moreover, for a long-term period, China has continuously expanded its refining capacity for all types of crudes. According to Institute for Energy Research, China is likely to register 20 million barrels of refining capacity at the end of 2025, which will trigger the demand for silica sand in the upcoming years.
- Moreover, the crude oil output of China has registered 33.47 million tons in the first two months of 2022, about 4.6% up from the same period of the previous year. According to the National Bureau of Statistics China, the daily output of crude oil is nearly 576,000 tons.
- The glass manufacturing industry is growing at the fastest rate in China, coupled with the growing adoption of glass in several industries, including construction and automotive. According to the National Bureau of Statistics of China, China produced approximately 43.07 million square meters of reinforced glass in April 2023. Additionally, in 2022, the total production of reinforced glass accounted for nearly 580 million square meters.
- As of July 2022, the United Nations has estimated the current population of India over 1.4 billion. Rapid urbanization and expanding population will raise oil demand in the upcoming years. According to India Brand Equity Foundation (IBEF), India will likely register 11 million barrels daily by 2045. Diesel demand is projected to be doubled to 163 MT by 2029-30. The country is the world's third-biggest oil importer and has a refining capacity of about 249 million tons annually, equivalent to 5 million barrels per day. Its refining capacity is expected to climb to 298 million tons annually over the next five years.
- Furthermore, the Indian glass industry's growth has been driven primarily by the construction sector. The construction and infrastructure industry holds the highest market share in the Indian flat glass market due to the growing demand for flat glass in residential building projects. Additionally, the manufacturer based in India is significantly expanding their production capacities and product portfolio. For instance:
- In March 2022, Saint-Gobain, a French manufacturer of float glass, invested INR 500 crore (USD 67.63 million) in a new float glass facility and an integrated window line at its World Glass Campus in Sriperumbudur, west of Chennai, India.
- The aforementioned factors indicate strong growth potential for the silica sand market in the Asian-Pacific region.
Silica Sand Industry Overview
The global silica sand market is consolidated in nature. Some of the major companies in the market (not in any particular order) include Hi-Crush Inc., Covia Holdings LLC, Source Energy Services, Mitsubishi Corporation, and Sil Industrial Minerals, among others.
Additional Benefits:
- The market estimate (ME) sheet in Excel format
- 3 months of analyst support
TABLE OF CONTENTS
1 INTRODUCTION
- 1.1 Study Assumptions
- 1.2 Scope of the Study
2 RESEARCH METHODOLOGY
3 EXECUTIVE SUMMARY
4 MARKET DYNAMICS
- 4.1 Drivers
- 4.1.1 Increasing Demand from the Foundry Industry
- 4.1.2 Growing Demand from the Glass Industry
- 4.2 Restraints
- 4.2.1 Availability of Substitutes
- 4.2.2 Illegal Mining of Sand
- 4.2.3 Concerns over Environmental Impacts of Silica Sand Mining
- 4.3 Industry Value Chain Analysis
- 4.4 Porter Five Forces
- 4.4.1 Bargaining Power of Suppliers
- 4.4.2 Bargaining Power of Consumers
- 4.4.3 Threat of New Entrants
- 4.4.4 Threat of Substitute Products and Services
- 4.4.5 Degree of Competition
5 MARKET SEGMENTATION (Market Size in Volume)
- 5.1 End-user Industry
- 5.1.1 Glass Manufacturing
- 5.1.2 Foundry
- 5.1.3 Chemical Production
- 5.1.4 Construction
- 5.1.5 Paints and Coatings
- 5.1.6 Ceramics and Refractories
- 5.1.7 Filtration
- 5.1.8 Oil and Gas
- 5.1.9 Other End-user Industries
- 5.2 Geography
- 5.2.1 Asia-Pacific
- 5.2.1.1 China
- 5.2.1.2 India
- 5.2.1.3 Japan
- 5.2.1.4 South Korea
- 5.2.1.5 Rest of Asia-Pacific
- 5.2.2 North America
- 5.2.2.1 United States
- 5.2.2.2 Canada
- 5.2.2.3 Mexico
- 5.2.3 Europe
- 5.2.3.1 Germany
- 5.2.3.2 United Kingdom
- 5.2.3.3 Italy
- 5.2.3.4 France
- 5.2.3.5 Rest of Europe
- 5.2.4 South America
- 5.2.4.1 Brazil
- 5.2.4.2 Argentina
- 5.2.4.3 Rest of South America
- 5.2.5 Middle East and Africa
- 5.2.5.1 Saudi Arabia
- 5.2.5.2 South Africa
- 5.2.5.3 Rest of Middle East and Africa
- 5.2.1 Asia-Pacific
6 COMPETITIVE LANDSCAPE
- 6.1 Mergers and Acquisitions, Joint Ventures, Collaborations, and Agreements
- 6.2 Market Share(%)**/Ranking Analysis
- 6.3 Strategies Adopted by Leading Players
- 6.4 Company Profiles
- 6.4.1 Badger Mining Corporation
- 6.4.2 Chongqing Changjiang River Moulding Material Group Co. Ltd
- 6.4.3 Covia Holdings LLC
- 6.4.4 Euroquarz GmbH
- 6.4.5 Hi-Crush Inc.
- 6.4.6 JFE Mineral & Alloy Company Ltd
- 6.4.7 Mitsubishi Corporation
- 6.4.8 PUM GROUP
- 6.4.9 Sibelco
- 6.4.10 Sil Industrial Minerals
- 6.4.11 Source Energy Services
- 6.4.12 Superior Silica Sands
- 6.4.13 Tochu Corporation
- 6.4.14 U.S. Silica
7 MARKET OPPORTUNITIES AND FUTURE TRENDS
- 7.1 Growing Water Treatment Industry
- 7.2 Other Opportunities