|
시장보고서
상품코드
1628772
공급망 빅데이터 분석 : 시장 점유율 분석, 산업 동향, 성장 예측(2025-2030년)Supply Chain Big Data Analytics - Market Share Analysis, Industry Trends & Statistics, Growth Forecasts (2025 - 2030) |
||||||
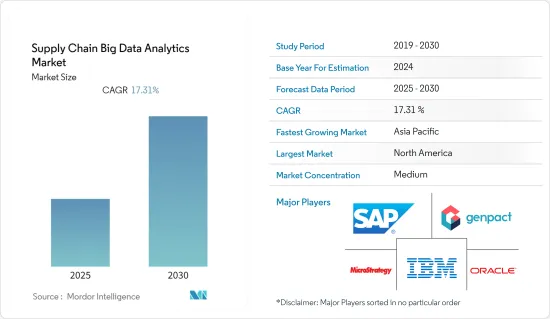
공급망 빅데이터 분석 시장은 예측 기간 동안 CAGR 17.31%를 나타낼 것으로 예상됩니다.
주요 하이라이트
- 디지털 기술의 확산으로 빅데이터 분석(BDA)은 점점 더 방대한 데이터에서 가치를 창출하고, 기업에게 압도적인 경쟁 우위를 확보할 수 있는 더 나은 기회를 제공하는 중요한 비즈니스 역량으로 부상하고 있습니다.
- 빅데이터 분석은 제조업공급망 개선을 돕습니다. 예를 들어, 에너지 소비가 많은 제조 공정의 경우, 전기 요금의 변화를 활용하여 일정을 조정할 수 있습니다. 조립력, 부품 간 크기 차이 등 생산 특성에 대한 데이터를 저장하고 조사하면 몇년후 오류가 발생하더라도 근본적인 원인을 파악하는 데 도움이 될 수 있습니다. 농업용 종자 가공업체와 생산자들은 다양한 유형의 카메라를 사용하여 실시간으로 제품 품질을 모니터링하고 개별 종자의 품질 평가를 얻는다.
- 분석은 이미 트럭 운송 사업자들이 업무 최적화를 위해 활용하고 있습니다. 예를 들어, 차량 경제성을 높이기 위해 연료 사용량 분석을 채택하거나 GPS 기술을 사용하여 저장 공간을 실시간으로 분배하여 대기 시간을 줄이기 위해 GPS 기술을 채택하고 있습니다. 택배 회사는 트럭의 지리적 위치와 혼잡도 데이터를 기반으로 소비자에 대한 배송을 실시간으로 예약하기 시작했습니다. 예를 들어, UPS는 네트워크의 55,000개 경로를 개선하기 위해 온로드 통합 최적화 내비게이션 시스템(Orion)을 구축하는 데 10년을 투자했습니다. 데이비드 애브니(David Abney) CEO에 따르면, 이 새로운 방식은 연간 3억 달러에서 4억 달러의 비용을 절감할 수 있다고 합니다. 빅데이터 분석은 또한 데이터를 마이닝하여 소포가 언제 배송될지 예측함으로써 물류 사업자가 더 적은 배송 작업으로 상품을 배송할 수 있도록 돕습니다.
- 빅데이터 분석은 기업이 관련 상품을 그룹화하여 판매상의 이점을 조사하는 데도 도움이 됩니다. 구글은 고해상도 위성사진을 제공하는 스카이박스(Skybox)를 인수했는데, 스카이박스는 주차장에 있는 자동차를 관찰하고 매장 내 수요를 예측하는 데 사용할 수 있습니다. 또한 카메라가 장착된 드론을 이용해 매장의 재고량을 추적하는 방법을 연구하는 기업도 있습니다.
- 코로나19 팬데믹은 전 세계 공급 시스템에 혼란과 위험을 초래했습니다. 빅데이터 분석(BDA)은 최근 이러한 위험의 영향을 계획하고 완화하기 위해 기업에 예측 가능한 선제적 정보를 제공하는 실행 가능한 솔루션으로 등장했습니다. 이번 재난은 장기적인 경제적 지속가능성을 보장하기 위해 공급망에 대한 솔루션의 필요성을 강조했습니다. 이러한 어려운 시기에 공급망 분석은 기업이 긴급한 조정이 필요한 프로세스와 곧 사라질 것으로 예상되는 제품 및 품목을 감지하고 수요 및 공급의 격차를 성공적으로 관리할 수 있도록 도와주었습니다. 또한, 공급업체들은 전 세계 공급망에 대한 팬데믹의 악영향을 줄이기 위한 솔루션을 적극적으로 개발 및 제공합니다.
공급망 빅데이터 분석 시장 동향
소매업은 큰 폭의 성장이 예상
- 소매 업계는 현재 공급망 빅데이터 분석 시장의 상당 부분을 차지하고 있으며, 공급망 전반에 걸쳐 IoT 솔루션, 비콘 및 RFID 기술을 채택함으로써 생성되는 데이터 소스가 증가함에 따라 많은 성장 기회를 제공할 것으로 예상됩니다. 또한, 소매 매출 증가는 시장 성장의 원동력이 될 것으로 예상됩니다. 예를 들어, 지난해 미국의 소매 총매출액은 약 4조 8,600억 달러로 전년 대비 5,300억 달러가 증가했습니다.
- 소매업체는 새로운 데이터 소스를 활용하여 계획 단계와 수요 감지 능력을 향상시킬 수 있습니다. 예를 들어, Blue Yonder는 130,000개의 SKU와 200개의 영향 변수로부터 매일 150,000,000개의 확률 분포를 도출하는 데이터 집약적 예측 알고리즘을 만들어 이미 소매업에서 사용하고 있습니다. 이를 통해 예측 정확도가 크게 향상되어 회사의 물류 용량 요구 사항을 더 잘 이해할 수 있게 되었으며, 노후화, 재고 수준 및 과잉 재고를 줄일 수 있었습니다. 최근 블루욘더(Blue Yonder)와 같은 제3자 클라우드 기반 플랫폼의 확장으로 다른 소매업체들도 유사한 활동을 더욱 쉽게 이용할 수 있게 되었습니다.
- 각국 정부가 개인에게 자택대기를 권고하고 사회적 거리두기 규제를 시행하면서 인터넷 구매는 더욱 증가하고 있습니다. 팬데믹 기간 동안 소매 업계의 분석 솔루션에 대한 수요가 급격히 증가했습니다. 예를 들어, 월마트는 2021년 월마트 소비자 센터에서 정보를 수집하여 월마트의 수많은 브랜드 인지도, 시청자 행동 및 채널 성공에 대한 통찰력을 제공하는 플랫폼인 월마트 루미네이트(Walmart Luminate)를 개발했습니다. 지난해 10월, 월마트는 공급업체에 대한 무료 기본 패키지를 곧 출시할 것이라고 발표하여, 크고 작은 규모공급업체가 가맹점과 협력하여 기업을 더욱 쉽게 확장할 수 있도록 지원했습니다. 월마트 루미네이트 베이직은 올해 안에 출시될 예정입니다.
- 또한, 가맹점은 IoT 솔루션과 장치를 사용하여 소비자 데이터를 분석하고, 재고 수준을 관리하고, 고객과의 상호 작용을 개선하기 위해 IoT 솔루션과 장치를 사용하고 있습니다. 이러한 기술 발전은 전체 공급망에서 품목에 대한 모니터링을 개선하고 고객의 행동을 명확하게 파악할 수 있게 해줍니다.
- 예를 들어, 매장의 천장 공간에 RFID 리더를 설치하여 진열된 모든 상품을 스캔하여 보다 정확한 재고 가시성을 확보할 수 있습니다. 아메리칸 어패럴은 RFID 태그와 데이터 분석 기술을 활용해 재고 관리를 강화하고, 월마트는 빅데이터 분석을 통해 매장 내 관리와 공급망 관리를 개선하고 있습니다.
북미가 주요 점유율을 차지할 전망
- 미국 기업과 정부는 제조업의 생산성을 높이고 전체 공급망 운영을 강화하는 데 초점을 맞추어 제조업 비즈니스 활성화를 위해 끊임없이 노력하고 있습니다. 미국 내 전자상거래 사업이 확대됨에 따라 효과적인 공급망 관리에 대한 수요도 증가하고 있습니다. 미국 상무부에 따르면 지난해 3분기 미국 전자상거래 사업은 10.8% 성장했습니다. 온라인 주문은 전체 소매 소비 금액의 20.6% 이상을 차지합니다.
- 미국은 세계 최대 규모의 소매 시장이며, 코로나19의 영향을 많이 받았습니다. 그러나 성장세를 유지하고 모멘텀을 유지하기 위해 성장을 강화하기 위해서는 데이터를 규모에 맞게 평가할 수 있는 첨단 기술이 필요합니다. 미국 소매업협회(NRF)에 따르면, 소매업은 미국 최대 민간 산업으로 연간 GDP 3조 9,000억 달러(한화 약 4조 9,000억 원)를 차지하며 미국인 4명 중 1명(5,200만 명)을 고용하고 있습니다.
- 미국 인구조사국에 따르면 지난해 3월 소매판매는 계절 조정 후 2월 대비 0.5% 증가, 전년 동월 대비 6.9% 증가했고, 2월은 전월 대비 0.8% 증가, 전년 동월 대비 18.2% 증가했다고 밝혔습니다.
- 또한, 북미 소매 업계에서 전자 소매업체들은 우수한 공급망 관리를 통해 효율적으로 달성할 수 있는 당일 배송을 포함시켜 소비자 경험을 개선하고자 노력하고 있습니다.
- 또한 지역 스타트업들은 빅데이터 분석 및 기타 신기술을 활용해 업무 효율성을 개선하기 위해 자금을 모으고 있습니다. 예를 들어, 세계 보안과 비즈니스의 교차점에서 기업에 인텔리전스를 제공하는 분석 및 데이터 회사인 Kharon은 지난해 9월 유통망 매핑 및 소액 추적을 위한 국제 비즈니스 연결 및 클라우드 기반 플랫폼인 Transparency-One과의 제휴를 파트너십을 발표했습니다. 고객은 Transparency-One을 통해 제품 수준의 유통망 매핑 및 문서 모니터링을 수행하고, Kharon의 강제 노동 데이터베이스와 비교하여 거부자 및 고위험군 선별을 자동화할 수 있습니다.
공급망 빅데이터 분석 산업 개요
공급망 빅데이터 분석 시장은 경쟁이 치열하고 여러 대기업으로 구성되어 있습니다. 시장 점유율 측면에서 SAP SE, IBM Corporation, Oracle Corporation, MicroStrategy Incorporated, Genpact Limited 등 소수의 대기업이 현재 시장을 독점하고 있습니다. 이들 기업은 전략적 협업 이니셔티브를 통해 시장 점유율과 수익성을 높이고 있습니다.
Oracle은 2022년 10월, 데이터 및 분석 솔루션 포트폴리오 전반에 걸쳐 다양한 신제품을 발표했으며, Oracle 퓨전 애널리틱스(Oracle Fusion Analytics)의 ERP, CX, SCM 및 HCM 분석에 대한 추가 기능을 통해 의사결정권자들은 2022년 11월, AWS는 AWS Supply Chain(AWS Supply Chain)을 발표했으며, 이 새로운 플랫폼은 공급망 관리의 효율성을 향상시키고, 공급망 관리의 효율성을 향상시키는 데 도움이 될 것으로 기대됩니다. 이 새로운 플랫폼을 통해 기업은 공급망에 대한 가시성을 높이고, 위험을 줄이며, 비용을 절감하고, 고객 경험을 개선하기 위해 보다 신속하고 정보에 입각한 선택을 할 수 있습니다. 를 원활하게 통합하고 분석합니다. 이를 통해 기업은 실시간으로 운영을 모니터링하고, 패턴을 보다 빠르게 파악하며, 보다 정확한 수요 예측을 통해 소비자의 기대에 부응하는 충분한 재고를 확보할 수 있습니다.
기타 혜택 :
- 엑셀 형식 시장 예측(ME) 시트
- 3개월간의 애널리스트 지원
목차
제1장 서론
- 조사의 전제조건
- 조사 범위
제2장 조사 방법
제3장 주요 요약
제4장 시장 인사이트
- 시장 개요
- 시장 성장 촉진요인
- 시장 성장 억제요인
- 밸류체인/공급망 분석
- 업계 매력 - Porter's Five Forces
- 신규 진출업체의 위협
- 구매자/소비자의 교섭력
- 공급 기업의 교섭력
- 대체품의 위협
- 경쟁 기업간 경쟁 관계
- 시장에 대한 COVID-19의 영향 평가
제5장 시장 세분화
- 유형별
- 솔루션
- 공급망 조달 및 계획 툴
- 판매 및 업무 계획
- 제조 애널리틱스
- 운송 및 물류 분석
- 기타 솔루션(재고 계획과 최적화 분석, 스케줄링 및 리포팅 툴)
- 서비스
- 전문 서비스
- 지원 및 유지보수 서비스
- 최종사용자별
- 소매
- 운송 및 물류
- 제조업
- 헬스케어
- 기타 최종사용자
- 지역별
- 북미
- 미국
- 캐나다
- 유럽
- 영국
- 독일
- 프랑스
- 이탈리아
- 기타 유럽
- 아시아태평양
- 중국
- 일본
- 한국
- 인도
- 기타 아시아태평양
- 라틴아메리카
- 멕시코
- 브라질
- 아르헨티나
- 기타 라틴아메리카
- 중동 및 아프리카
- 아랍에미리트(UAE)
- 사우디아라비아
- 남아프리카공화국
- 기타 중동 및 아프리카
제6장 경쟁 구도
- 기업 개요
- SAP SE(SAP)
- IBM Corporation
- Oracle Corporation
- MicroStrategy Incorporated
- Genpact Limited
- SAS Institute Inc.
- Sage Clarity Systems
- Salesforce.com Inc(Tableau Software Inc.)
- Birst Inc.
- Capgemini Group
- Kinaxis Inc.
제7장 투자 분석
제8장 시장 기회와 향후 동향
LSH 25.01.22
The Supply Chain Big Data Analytics Market is expected to register a CAGR of 17.31% during the forecast period.

Key Highlights
- The widespread use of digital technologies has led to the emergence of Big Data Analytics (BDA) as a critical business capability to provide companies with better opportunities to obtain value from an increasingly huge amount of data and gain a commanding competitive advantage.
- Big data analytics aid in the improvement of the supply chain in the manufacturing business. For example, energy-intensive manufacturing runs can be scheduled to take advantage of changing electricity rates. Data on production characteristics, such as assembly forces or size variances between components, can be saved and examined to aid in the root-cause investigation of errors, even if they arise years later. Agricultural seed processors and producers monitor the quality of their products in real-time using various types of cameras to obtain quality assessments for every individual seed.
- Analytics are already being used by trucking businesses to optimize their operations. For example, they employ fuel usage analytics to increase vehicle economy and GPS technology to cut waiting times by distributing storage spaces in real time. Courier companies have begun real-time scheduling of deliveries to consumers based on geo-location and congestion data from their trucks. UPS, for example, has invested ten years in creating its On-Road Integrated Optimization and Navigation system (Orion) to improve the network's 55,000 paths. According to the company's CEO, David Abney, the new method would save $300 million to $400 million yearly. Big data analytics will also assist logistics operators in delivering goods with fewer delivery efforts by mining their data to estimate when a parcel will be delivered.
- Big data analytics can help businesses investigate the sales benefits of grouping related goods together. Google has bought Skybox, a source of high-resolution satellite images that can be used to watch automobiles in a parking lot to predict in-store demand. Others have investigated the use of camera-equipped drones to track on-shelf stock levels.
- The pandemic of COVID-19 has caused disruptions and hazards in global supply systems. Big data analytics (BDA) has recently arisen as a viable solution for providing firms with predicted and pre-emptive information to assist them in planning and reducing the effects of such hazards. The outbreak highlighted the need for solutions for supply chains to ensure long-term economic sustainability. During these difficult times, supply chain analytics helped firms to detect processes that needed immediate adjustment or products/items that were expected to run out soon, helping them to manage the demand-supply gap better. Furthermore, the suppliers are actively developing and delivering solutions to mitigate the detrimental effects of the outbreak on global supply chains.
Supply Chain Big Data Analytics Market Trends
Retail is Expected to Register a Significant Growth
- The retail industry currently accounts for a significant portion of the supply chain big data analytics market, and it is expected to present numerous growth opportunities as a result of the increasing number of data sources generated by the adoption of IoT solutions, beacons, and RFID technologies throughout the supply chain. Additionally, growing retail sales are expected to drive market growth. For instance, last year, total retail sales in the United States were roughly USD 4.86 trillion, up USD 53 billion from the previous year.
- Retailers may enhance their planning procedures and demand-sensing capacities by utilizing new data sources. Blue Yonder, for instance, has created data-intensive forecasting algorithms already being used in retail, wherein 130,000 SKUs and 200 impacting variables yield 150,000,000 probability distributions each day. This has significantly improved forecast accuracy, provided a better understanding of the firm's logistical capacity requirements, and decreased obsolescence, stock levels, and excess inventory. The recent expansion of third-party cloud-based platforms such as Blue Yonder makes similar activities more available to other retailers.
- Governments worldwide have advised individuals to stay at home and are enacting social distancing regulations, increasing internet purchasing even more. During the pandemic, the demand for analytics solutions in retail has increased dramatically. Walmart, for example, developed Walmart Luminate in 2021, a platform that collects information from Walmart's consumer center and provides insights on perception, audience behavior, and channel success for the numerous brands at Walmart. In October last year, the company announced the forthcoming introduction of a Basic package at no cost to suppliers, making it even more straightforward for suppliers of any scale to engage with merchants to expand their companies. Walmart Luminate Basic is scheduled to go on the market in the current year.
- Furthermore, merchants use IoT solutions and devices to analyze consumer data, manage stock levels, and improve customer interactions. These technological advancements allow for improved monitoring of items across the supply chain and aid in acquiring a clear insight into client behavior.
- For instance, merchants have also installed a system of RFID readers into the ceiling space of the sales floors, enabling them to scan all of the items on show and offering more precise inventory visibility. American Apparel uses RFID tags and data analytics technologies to enhance inventory control, while Walmart uses Big Data analytics to improve in-store and supply-chain management.
North America is Expected to Hold Major Share
- Companies and governments in the United States are constantly working to boost their manufacturing business by increasing productivity and focusing on strengthening operations across the supply chain in the country's manufacturing industry. As the e-commerce business in the United States expands, so does the demand for effective supply chain management. According to the US Commerce Department, the country's e-commerce business grew by 10.8% in the third quarter of the last year. Online orders accounted for over 20.6% of all retail dollars spent.
- The United States is one of the world's largest retail marketplaces, and covid-19 influenced it considerably. However, getting back on track with rising numbers and augmenting growth to keep the momentum going requires advanced tech to evaluate data at that scale. According to the National Retail Federation (NRF), retail is the country's biggest private industry, accounting for USD 3.9 trillion yearly GDP and employing one in every four Americans (52 million).
- According to the US Census Bureau, retail sales in March last year were up 0.5% seasonally adjusted from February and 6.9% Y-O-Y. In February, there were rises of 0.8% month over month and 18.2% Y-O-Y.
- Additionally, E-retailers in the North American retail sector are trying to improve the consumer experience by including same-day delivery, which may be accomplished efficiently with excellent supply chain management.
- Further, regional startups are gathering funds to improve operational efficiency using Big Data analytics and other new technologies. For example, Kharon, an analytics and data company providing companies with intelligence at the intersection of world security and business, announced a partnership with Transparency-One, an international business connectivity and cloud-based platform for distribution network mapping and sub-tier tracking, in September last year. Clients may use Transparency-One to perform product-level distribution network mapping and document monitoring while also automating refused and high-risk party screenings against Kharon's sector Forced Labor database.
Supply Chain Big Data Analytics Industry Overview
The supply chain big data analytics market is highly competitive and consists of several major players. In terms of market share, a few major players currently dominate the market, including SAP SE, IBM Corporation, Oracle Corporation, MicroStrategy Incorporated, and Genpact Limited, among others. These companies leverage strategic collaborative initiatives to increase their market shares and profitability.
In October 2022, Oracle unveiled a slew of new product developments across its complete data and analytics solutions portfolio. With the additional features in Oracle Fusion Analytics for ERP, CX, SCM, and HCM analytics, decision-makers have a prebuilt collection of over 2,000 best-practice dashboards, KPIs, and reports to evaluate performance against strategic objectives. In November 2022, AWS introduced AWS Supply Chain. This new platform enables organizations to supply chain visibility better to make quicker, more informed choices that reduce risks, save money, and enhance customer experiences. AWS Supply Chain seamlessly aggregates and analyzes data from numerous supply chain systems. This allows businesses to monitor their operations in real-time, identify patterns faster, and provide more accurate demand projections to guarantee enough inventory to fulfill consumer expectations.
Additional Benefits:
- The market estimate (ME) sheet in Excel format
- 3 months of analyst support
TABLE OF CONTENTS
1 INTRODUCTION
- 1.1 Study Assumptions
- 1.2 Scope of the Study
2 RESEARCH METHODOLOGY
3 EXECUTIVE SUMMARY
4 MARKET INSIGHTS
- 4.1 Market Overview
- 4.2 Market Drivers
- 4.2.1 Increasing Need of Business Data to Improve Efficiency
- 4.3 Market Restraints
- 4.3.1 Operational Complexity Coupled with High Maintenance Costs
- 4.4 Value Chain / Supply Chain Analysis
- 4.5 Industry Attractiveness - Porter Five Forces
- 4.5.1 Threat of New Entrants
- 4.5.2 Bargaining Power of Buyers/Consumers
- 4.5.3 Bargaining Power of Suppliers
- 4.5.4 Threat of Substitute Products
- 4.5.5 Intensity of Competitive Rivalry
- 4.6 Assessment of the Impact of COVID-19 on the Market
5 MARKET SEGMENTATION
- 5.1 By Type
- 5.1.1 Solution
- 5.1.1.1 Supply Chain Procurement and Planning Tool
- 5.1.1.2 Sales and Operations Planning
- 5.1.1.3 Manufacturing Analytics
- 5.1.1.4 Transportation and Logistics Analytics
- 5.1.1.5 Other Solutions (Inventory Planning and Optimization Analytics and Scheduling and Reporting Tools)
- 5.1.2 Service
- 5.1.2.1 Professional Service
- 5.1.2.2 Support and Maintenance Service
- 5.2 End User
- 5.2.1 Retail
- 5.2.2 Transportation and Logistics
- 5.2.3 Manufacturing
- 5.2.4 Healthcare
- 5.2.5 Other End Users
- 5.3 Geography
- 5.3.1 North America
- 5.3.1.1 United States
- 5.3.1.2 Canada
- 5.3.2 Europe
- 5.3.2.1 United Kingdom
- 5.3.2.2 Germany
- 5.3.2.3 France
- 5.3.2.4 Italy
- 5.3.2.5 Rest of Europe
- 5.3.3 Asia-Pacific
- 5.3.3.1 China
- 5.3.3.2 Japan
- 5.3.3.3 South Korea
- 5.3.3.4 India
- 5.3.3.5 Rest of Asia-Pacific
- 5.3.4 Latin America
- 5.3.4.1 Mexico
- 5.3.4.2 Brazil
- 5.3.4.3 Argentina
- 5.3.4.4 Rest of Latin America
- 5.3.5 Middle-East & Africa
- 5.3.5.1 United Arab Emirates
- 5.3.5.2 Saudi Arabia
- 5.3.5.3 South Africa
- 5.3.5.4 Rest of Middle-East & Africa
6 COMPETITIVE LANDSCAPE
- 6.1 Company Profiles
- 6.1.1 SAP SE (SAP)
- 6.1.2 IBM Corporation
- 6.1.3 Oracle Corporation
- 6.1.4 MicroStrategy Incorporated
- 6.1.5 Genpact Limited
- 6.1.6 SAS Institute Inc.
- 6.1.7 Sage Clarity Systems
- 6.1.8 Salesforce.com Inc (Tableau Software Inc.)
- 6.1.9 Birst Inc.
- 6.1.10 Capgemini Group
- 6.1.11 Kinaxis Inc.
7 INVESTMENT ANALYSIS
8 MARKET OPPORTUNITIES AND FUTURE TRENDS
- 신규 진출업체의 위협
- 구매자/소비자의 교섭력
- 공급 기업의 교섭력
- 대체품의 위협
- 경쟁 기업간 경쟁 관계
- 솔루션
- 공급망 조달 및 계획 툴
- 판매 및 업무 계획
- 제조 애널리틱스
- 운송 및 물류 분석
- 기타 솔루션(재고 계획과 최적화 분석, 스케줄링 및 리포팅 툴)
- 서비스
- 전문 서비스
- 지원 및 유지보수 서비스
- 소매
- 운송 및 물류
- 제조업
- 헬스케어
- 기타 최종사용자
- 북미
- 미국
- 캐나다
- 유럽
- 영국
- 독일
- 프랑스
- 이탈리아
- 기타 유럽
- 아시아태평양
- 중국
- 일본
- 한국
- 인도
- 기타 아시아태평양
- 라틴아메리카
- 멕시코
- 브라질
- 아르헨티나
- 기타 라틴아메리카
- 중동 및 아프리카
- 아랍에미리트(UAE)
- 사우디아라비아
- 남아프리카공화국
- 기타 중동 및 아프리카
- SAP SE(SAP)
- IBM Corporation
- Oracle Corporation
- MicroStrategy Incorporated
- Genpact Limited
- SAS Institute Inc.
- Sage Clarity Systems
- Salesforce.com Inc(Tableau Software Inc.)
- Birst Inc.
- Capgemini Group
- Kinaxis Inc.
The Supply Chain Big Data Analytics Market is expected to register a CAGR of 17.31% during the forecast period.
Key Highlights
- The widespread use of digital technologies has led to the emergence of Big Data Analytics (BDA) as a critical business capability to provide companies with better opportunities to obtain value from an increasingly huge amount of data and gain a commanding competitive advantage.
- Big data analytics aid in the improvement of the supply chain in the manufacturing business. For example, energy-intensive manufacturing runs can be scheduled to take advantage of changing electricity rates. Data on production characteristics, such as assembly forces or size variances between components, can be saved and examined to aid in the root-cause investigation of errors, even if they arise years later. Agricultural seed processors and producers monitor the quality of their products in real-time using various types of cameras to obtain quality assessments for every individual seed.
- Analytics are already being used by trucking businesses to optimize their operations. For example, they employ fuel usage analytics to increase vehicle economy and GPS technology to cut waiting times by distributing storage spaces in real time. Courier companies have begun real-time scheduling of deliveries to consumers based on geo-location and congestion data from their trucks. UPS, for example, has invested ten years in creating its On-Road Integrated Optimization and Navigation system (Orion) to improve the network's 55,000 paths. According to the company's CEO, David Abney, the new method would save $300 million to $400 million yearly. Big data analytics will also assist logistics operators in delivering goods with fewer delivery efforts by mining their data to estimate when a parcel will be delivered.
- Big data analytics can help businesses investigate the sales benefits of grouping related goods together. Google has bought Skybox, a source of high-resolution satellite images that can be used to watch automobiles in a parking lot to predict in-store demand. Others have investigated the use of camera-equipped drones to track on-shelf stock levels.
- The pandemic of COVID-19 has caused disruptions and hazards in global supply systems. Big data analytics (BDA) has recently arisen as a viable solution for providing firms with predicted and pre-emptive information to assist them in planning and reducing the effects of such hazards. The outbreak highlighted the need for solutions for supply chains to ensure long-term economic sustainability. During these difficult times, supply chain analytics helped firms to detect processes that needed immediate adjustment or products/items that were expected to run out soon, helping them to manage the demand-supply gap better. Furthermore, the suppliers are actively developing and delivering solutions to mitigate the detrimental effects of the outbreak on global supply chains.
Supply Chain Big Data Analytics Market Trends
Retail is Expected to Register a Significant Growth
- The retail industry currently accounts for a significant portion of the supply chain big data analytics market, and it is expected to present numerous growth opportunities as a result of the increasing number of data sources generated by the adoption of IoT solutions, beacons, and RFID technologies throughout the supply chain. Additionally, growing retail sales are expected to drive market growth. For instance, last year, total retail sales in the United States were roughly USD 4.86 trillion, up USD 53 billion from the previous year.
- Retailers may enhance their planning procedures and demand-sensing capacities by utilizing new data sources. Blue Yonder, for instance, has created data-intensive forecasting algorithms already being used in retail, wherein 130,000 SKUs and 200 impacting variables yield 150,000,000 probability distributions each day. This has significantly improved forecast accuracy, provided a better understanding of the firm's logistical capacity requirements, and decreased obsolescence, stock levels, and excess inventory. The recent expansion of third-party cloud-based platforms such as Blue Yonder makes similar activities more available to other retailers.
- Governments worldwide have advised individuals to stay at home and are enacting social distancing regulations, increasing internet purchasing even more. During the pandemic, the demand for analytics solutions in retail has increased dramatically. Walmart, for example, developed Walmart Luminate in 2021, a platform that collects information from Walmart's consumer center and provides insights on perception, audience behavior, and channel success for the numerous brands at Walmart. In October last year, the company announced the forthcoming introduction of a Basic package at no cost to suppliers, making it even more straightforward for suppliers of any scale to engage with merchants to expand their companies. Walmart Luminate Basic is scheduled to go on the market in the current year.
- Furthermore, merchants use IoT solutions and devices to analyze consumer data, manage stock levels, and improve customer interactions. These technological advancements allow for improved monitoring of items across the supply chain and aid in acquiring a clear insight into client behavior.
- For instance, merchants have also installed a system of RFID readers into the ceiling space of the sales floors, enabling them to scan all of the items on show and offering more precise inventory visibility. American Apparel uses RFID tags and data analytics technologies to enhance inventory control, while Walmart uses Big Data analytics to improve in-store and supply-chain management.
North America is Expected to Hold Major Share
- Companies and governments in the United States are constantly working to boost their manufacturing business by increasing productivity and focusing on strengthening operations across the supply chain in the country's manufacturing industry. As the e-commerce business in the United States expands, so does the demand for effective supply chain management. According to the US Commerce Department, the country's e-commerce business grew by 10.8% in the third quarter of the last year. Online orders accounted for over 20.6% of all retail dollars spent.
- The United States is one of the world's largest retail marketplaces, and covid-19 influenced it considerably. However, getting back on track with rising numbers and augmenting growth to keep the momentum going requires advanced tech to evaluate data at that scale. According to the National Retail Federation (NRF), retail is the country's biggest private industry, accounting for USD 3.9 trillion yearly GDP and employing one in every four Americans (52 million).
- According to the US Census Bureau, retail sales in March last year were up 0.5% seasonally adjusted from February and 6.9% Y-O-Y. In February, there were rises of 0.8% month over month and 18.2% Y-O-Y.
- Additionally, E-retailers in the North American retail sector are trying to improve the consumer experience by including same-day delivery, which may be accomplished efficiently with excellent supply chain management.
- Further, regional startups are gathering funds to improve operational efficiency using Big Data analytics and other new technologies. For example, Kharon, an analytics and data company providing companies with intelligence at the intersection of world security and business, announced a partnership with Transparency-One, an international business connectivity and cloud-based platform for distribution network mapping and sub-tier tracking, in September last year. Clients may use Transparency-One to perform product-level distribution network mapping and document monitoring while also automating refused and high-risk party screenings against Kharon's sector Forced Labor database.
Supply Chain Big Data Analytics Industry Overview
The supply chain big data analytics market is highly competitive and consists of several major players. In terms of market share, a few major players currently dominate the market, including SAP SE, IBM Corporation, Oracle Corporation, MicroStrategy Incorporated, and Genpact Limited, among others. These companies leverage strategic collaborative initiatives to increase their market shares and profitability.
In October 2022, Oracle unveiled a slew of new product developments across its complete data and analytics solutions portfolio. With the additional features in Oracle Fusion Analytics for ERP, CX, SCM, and HCM analytics, decision-makers have a prebuilt collection of over 2,000 best-practice dashboards, KPIs, and reports to evaluate performance against strategic objectives. In November 2022, AWS introduced AWS Supply Chain. This new platform enables organizations to supply chain visibility better to make quicker, more informed choices that reduce risks, save money, and enhance customer experiences. AWS Supply Chain seamlessly aggregates and analyzes data from numerous supply chain systems. This allows businesses to monitor their operations in real-time, identify patterns faster, and provide more accurate demand projections to guarantee enough inventory to fulfill consumer expectations.
Additional Benefits:
- The market estimate (ME) sheet in Excel format
- 3 months of analyst support
TABLE OF CONTENTS
1 INTRODUCTION
- 1.1 Study Assumptions
- 1.2 Scope of the Study
2 RESEARCH METHODOLOGY
3 EXECUTIVE SUMMARY
4 MARKET INSIGHTS
- 4.1 Market Overview
- 4.2 Market Drivers
- 4.2.1 Increasing Need of Business Data to Improve Efficiency
- 4.3 Market Restraints
- 4.3.1 Operational Complexity Coupled with High Maintenance Costs
- 4.4 Value Chain / Supply Chain Analysis
- 4.5 Industry Attractiveness - Porter Five Forces
- 4.5.1 Threat of New Entrants
- 4.5.2 Bargaining Power of Buyers/Consumers
- 4.5.3 Bargaining Power of Suppliers
- 4.5.4 Threat of Substitute Products
- 4.5.5 Intensity of Competitive Rivalry
- 4.6 Assessment of the Impact of COVID-19 on the Market
5 MARKET SEGMENTATION
- 5.1 By Type
- 5.1.1 Solution
- 5.1.1.1 Supply Chain Procurement and Planning Tool
- 5.1.1.2 Sales and Operations Planning
- 5.1.1.3 Manufacturing Analytics
- 5.1.1.4 Transportation and Logistics Analytics
- 5.1.1.5 Other Solutions (Inventory Planning and Optimization Analytics and Scheduling and Reporting Tools)
- 5.1.2 Service
- 5.1.2.1 Professional Service
- 5.1.2.2 Support and Maintenance Service
- 5.1.1 Solution
- 5.2 End User
- 5.2.1 Retail
- 5.2.2 Transportation and Logistics
- 5.2.3 Manufacturing
- 5.2.4 Healthcare
- 5.2.5 Other End Users
- 5.3 Geography
- 5.3.1 North America
- 5.3.1.1 United States
- 5.3.1.2 Canada
- 5.3.2 Europe
- 5.3.2.1 United Kingdom
- 5.3.2.2 Germany
- 5.3.2.3 France
- 5.3.2.4 Italy
- 5.3.2.5 Rest of Europe
- 5.3.3 Asia-Pacific
- 5.3.3.1 China
- 5.3.3.2 Japan
- 5.3.3.3 South Korea
- 5.3.3.4 India
- 5.3.3.5 Rest of Asia-Pacific
- 5.3.4 Latin America
- 5.3.4.1 Mexico
- 5.3.4.2 Brazil
- 5.3.4.3 Argentina
- 5.3.4.4 Rest of Latin America
- 5.3.5 Middle-East & Africa
- 5.3.5.1 United Arab Emirates
- 5.3.5.2 Saudi Arabia
- 5.3.5.3 South Africa
- 5.3.5.4 Rest of Middle-East & Africa
- 5.3.1 North America
6 COMPETITIVE LANDSCAPE
- 6.1 Company Profiles
- 6.1.1 SAP SE (SAP)
- 6.1.2 IBM Corporation
- 6.1.3 Oracle Corporation
- 6.1.4 MicroStrategy Incorporated
- 6.1.5 Genpact Limited
- 6.1.6 SAS Institute Inc.
- 6.1.7 Sage Clarity Systems
- 6.1.8 Salesforce.com Inc (Tableau Software Inc.)
- 6.1.9 Birst Inc.
- 6.1.10 Capgemini Group
- 6.1.11 Kinaxis Inc.