|
시장보고서
상품코드
1630389
아시아태평양의 전력 : 시장 점유율 분석, 산업 동향 및 통계, 성장 예측(2025-2030년)Asia-Pacific Power - Market Share Analysis, Industry Trends & Statistics, Growth Forecasts (2025 - 2030) |
||||||
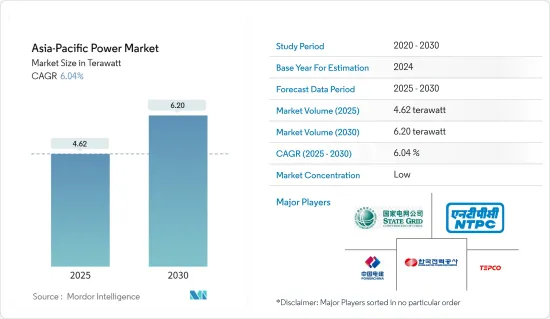
아시아태평양의 전력 시장 규모는 2025년 4.62테라와트로 추정되며, 예측 기간(2025-2030년) 동안 6.04%의 CAGR로 2030년에는 6.20테라와트에 달할 것으로 예상됩니다.

주요 하이라이트
- 중기적으로는 주거, 상업, 산업 부문의 전력 수요 증가, 정부의 재생에너지 도입 촉진 및 전력 부문 투자 증가 등의 요인이 시장을 견인할 것으로 예상됩니다.
- 한편, 발전, 송전, 배전망 설치 및 현대화에 필요한 막대한 투자와 석탄화력발전소 폐쇄 계획에 따른 민간부문의 투자 부진은 시장 성장을 저해할 것으로 예상됩니다.
- 태양전지에 카드뮴 텔루르화 카드뮴 박막 코팅을 사용하는 박막 기술로 만든 새로운 태양전지 모델은 효율이 높고 비용이 저렴하기 때문에 이 부문의 기회가 될 수 있습니다.
아시아태평양의 전력 시장 동향
화력 발전이 시장을 독식
- 아시아태평양은 상당한 양의 화석연료 에너지원으로 구성되어 있으며, 이전에는 증기터빈, 즉 화력 발전소를 이용한 발전이 주요 국가들의 첫 번째 선택이었습니다.
- 2022년 아시아태평양의 발전량은 약 14,546.4 TWh에 달할 것으로 예상됩니다. 모든 부문 중 화력 발전의 기여도가 가장 높으며 2022년 시장 점유율은 약 67.7%에 달할 것으로 예상됩니다.
- 2023년 1월 현재 중국은 세계에서 가장 많은 석탄화력발전소를 가동하고 있으며, 2023년 1월까지 중국에는 약 3092기의 가동중인 석탄화력발전소, 499기의 건설 중인 석탄화력발전소, 112기의 석탄화력발전소 건설이 예정되어 있습니다. 따라서 이러한 추세는 향후 몇 년 동안 화력 부문을 견인할 것으로 보입니다.
- 석탄 외에 천연가스와 같은 화석연료에 의한 발전도 큰 비중을 차지하고 있으며, 2023년 1월 현재 중국에는 약 377개의 가스발전소가 가동되고 있습니다. 가스 발전소는 향후 예정된 다양한 프로젝트로 인해 향후 몇 년 동안 증가할 가능성이 높으며, 2023년 1월 현재 중국에는 238개의 가스 발전소가 건설 중이고 78개의 가스 발전소 프로젝트가 이미 발표되었습니다.
- 또한 태국은 화력 에너지원에 크게 의존하고 있으며, 2022년 태국의 발전 용량은 천연가스가 약 114,640GWh로 가장 많고 석탄과 갈탄이 그 뒤를 이을 것으로 예상됩니다.
- 미쓰비시파워는 지난 10월 태국 촌부리에서 2,650MW 규모의 천연가스 화력 발전소를 완공했다고 발표했습니다. 이 회사는 M701JAC 파워트레인을 발전소 공동 소유주인 Gulf Energy Development PCL과 Mitsui & The Gulf SRC(GSRC) 발전소에 납품했습니다. 이 발전소는 양사의 합작회사인 IPD(Independent Power Development Co., Ltd.)가 개발한 최초의 가스 연소 독립 발전 프로젝트로, GSRC 발전소의 첫 두 660MW 유닛은 각각 2021년 3월과 2021년 10월에 가동을 시작했으며, 세 번째와 네 번째 유닛은 2021년 3월과 10월에 가동을 시작했습니다. 3호기와 4호기는 2022년에 완공될 예정입니다.
- 이러한 화력발전소 건설 및 운영 비용 경쟁과 화력발전 부문에 대한 지속적인 투자로 인해 화력발전소가 아시아태평양 전력 시장을 독점할 가능성이 높다는 것은 위에서 살펴본 바와 같이 분명합니다.
인도가 시장에서 큰 점유율을 차지할 것으로 예상
- 인도는 세계 최고의 경제 대국이며, 완전히 자유화된 광대한 전력 시장을 보유하고 있습니다. 인도의 전력 산업은 인도의 발전, 송전, 배전 및 전력 에너지 판매를 포괄합니다.
- 인도는 아시아태평양에서도 손꼽히는 발전 및 소비 시장입니다. 화석연료를 이용한 발전, 특히 천연가스와 석탄이 큰 비중을 차지하고 있으며, 이는 인도의 전력 시장 확대를 위한 길을 열어주었습니다.
- 전력부 통계에 따르면, 2023년 10월 현재 인도에서 생산되는 전력의 56% 이상(천연가스 6%, 갈탄 1.6%, 디젤 0.1%, 석탄 49%)을 화석연료가 차지하고 있으며, 재생에너지가 약 41.4%(수력 11.2%, 풍력 10.3%, 태양열 16.1%, 소수력 1.2%, 기타 2.6%)를 차지함. 수력 1.2%, 기타 2.6%)를 차지하고 있습니다. 국내에서는 재생에너지의 비중이 빠르게 증가하고 있지만, 단기적으로는 화석연료 기반 전원, 특히 석탄화력발전소가 이 부문을 지배할 것으로 보입니다. 이러한 발전 산업 시나리오는 예측 기간 동안 전력 시장의 성장에 영향을 미칠 것으로 예상됩니다.
- 인도의 전력 부문은 인구 증가, 에너지 수요 증가, 산업 부문의 성장으로 인해 급속한 변화를 겪고 있습니다. 또한, 인도의 발전 믹스는 지난 10년간 천연가스와 재생에너지 발전으로 전환되었습니다.
- 신재생에너지 부문은 고정가격매입제도(FIT)를 포함한 인도의 재생에너지 법규의 제정과 시행을 담당하는 신재생에너지부(MNRE)에서 관리하고 있습니다.
- 예를 들어, 2022년 현재 신재생에너지부(MNRE)는 세부 프로젝트 보고서(DPR) 작성에 대해 태양광발전소 1건당 최대 250만 인도 루피의 중앙 재정 지원(CFA)을 제공하고 있습니다. 이 외에도 1MW당 200만 인도 루피 또는 계통연계 비용을 포함한 프로젝트 비용의 30% 중 낮은 금액을 한도로 CFA가 제공됩니다. 또한, 200만 인도 루피/MW의 CFA는 태양광발전소 내부 인프라 개발은 SPPD에, 외부 송전 시스템 개발은 중앙 송전 사업자(CTU)/주 송전 사업자(STU)에 각각 60:40의 비율로 배분됩니다.
- 또한 인도는 아시아태평양에서 가장 큰 재생에너지 시장 중 하나입니다. 인도의 재생에너지 설비용량은 2023년 11월 현재 수력발전을 제외하고 132GW 이상에 달합니다. 태양광, 풍력, 바이오 에너지가 인도의 주요 재생에너지원이며, 2023년 11월 기준 수력발전을 포함한 재생에너지 발전량은 전체 발전량의 약 41.4%를 차지합니다.
- 따라서 위와 같은 측면에서 볼 때, 인도는 전력 소비량이 많고 전력 사업에 대한 투자 규모가 크기 때문에 시장에서 큰 점유율을 차지할 것으로 예상됩니다.
아시아태평양의 전력 산업 개요
아시아태평양의 전력 시장은 세분화되어 있습니다. 이 시장의 주요 기업으로는 Power Construction Corporation of China, NTPC Limited, Tokyo Electric Power Company Holdings, State Grid Corporation of China, Korea Electric Power Corporation 등이 있습니다.
기타 혜택
- 엑셀 형식의 시장 예측(ME) 시트
- 3개월간의 애널리스트 지원
목차
제1장 소개
- 조사 범위
- 시장 정의
- 조사 가정
제2장 조사 방법
제3장 주요 요약
제4장 시장 개요
- 소개
- 2028년까지 설치 용량과 수요 예측(단위 : TW)
- 최근 동향과 개발
- 정부 규제와 시책
- 시장 역학
- 성장 촉진요인
- 지수함수적으로 증가하는 전력 수요
- 재생에너지 채용
- 성장 억제요인
- 재생에너지 인프라 구축을 위한 거액 투자
- 성장 촉진요인
- 공급망 분석
- Porter's Five Forces 분석
- 공급 기업의 교섭력
- 소비자의 협상력
- 신규 참여업체의 위협
- 대체품의 위협
- 경쟁 기업 간의 경쟁 관계
제5장 시장 내역
- 발전원
- 화력
- 수력
- 재생에너지
- 기타
- 송배전(T&D)
- 지역
- 중국
- 인도
- 일본
- 한국
- 기타 아시아태평양
제6장 경쟁 구도
- 합병, 인수, 제휴, 합작투자
- 주요 기업의 전략
- Key Companies Profile
- Power Construction Corporation of China
- National Thermal Power Corporation Limited
- Tokyo Electric Power Company Holdings
- State Grid Corporation of China
- Korea Electric Power Corporation
- China Huaneng Group Co., Ltd.
- China Huadian Corporation Ltd.
- Tata Power Company Ltd
- Kansai Electric Power Co., Inc.
- Chubu Electric Power Co., Inc.
제7장 시장의 가능성과 향후 동향
- 스마트 그리드 네트워크 개발
The Asia-Pacific Power Market size is estimated at 4.62 terawatt in 2025, and is expected to reach 6.20 terawatt by 2030, at a CAGR of 6.04% during the forecast period (2025-2030).
Key Highlights
- Over the medium term, factors such as increasing demand for electricity in residential, commercial, and industrial segments and the governmental push towards the adoption of renewable energy sources coupled with rising investment in the power sector are expected to drive the market.
- On the other hand, a huge investment that is required for setting up and modernizing of power generation, transmission and distribution network, and weak private sector investment along with the plans to shut down coal-fired power plants are expected to impede the growth of the market.
- Nevertheless, new models of solar cells made of a thin film technology that uses thin coatings of cadmium telluride in solar cells, which has higher efficiency and lower cost, may prove to be an opportunity in the sector.
APAC Power Market Trends
Thermal Power to Dominate the Market
- The Asia Pacific region consists of a substantial amount of fossil fuel energy sources, which in earlier eras became the first choice of the major countries for generating power by the use of steam turbines, i.e. thermal power stations.
- Electricity generation in Asia-Pacifc was around 14546.4 TWh in 2022. Among all the segments, thermal power contributes the highest, with a market share of approximately 67.7% in 2022.
- As of January 2023, China has the highest number of operating coal thermal power plants in the world. Till January 2023, China has around 3092 units of operating coal thermal power plants, 499 under-construction coal power plants, and 112 announced coal power plants. Hence, such a trend would propel the thermal sector in the upcoming years.
- Apart from coal, the country has a significant share of electricity generation from fossil fuels like natural gas. As of January 2023, the country has nearly 377 operating gas power plants. The units for gas power plants are likely to increase during the upcoming years on account of various forthcoming projects. As of January 2023, China has around 238 under-construction gas power plants and 78 announced gas power plant projects.
- Furthermore, Thailand is also significantly reliant on thermal energy sources. In 2022, natural gas accounted for the highest power generation capacity in Thailand, with approximately 114.64 thousand GWh, followed by coal and lignite.
- In October 2022, Mitsubishi Power announced the completion of a 2,650-MW natural gas-fired power plant in Chonburi, Thailand. The company has delivered M701JAC power trains to the joint owner of the plant Gulf Energy Development PCL and Mitsui & Co., Ltd. The Gulf SRC (GSRC) power plant is the first gas-fired independent power project developed by the two companies under their joint venture, Independent Power Development Co. (IPD). The first two 660-MW units at the GSRC plant went online in March 2021 and October 2021, respectively. The third and fourth units were completed in 2022.
- Thus the above points clearly mention that, the thermal power plants are likely to dominate the Asia-Pacific power market due to their competitive costs of construction and operating and the continued investment in the thermal power sector.
India is Expected to Have a Significant Share in the Market
- India is one of the major economy in the world and is home to a vast power market that has been fully liberalized. The electric power industry in India covers the generation, transmission, distribution, and sale of electric energy in India.
- India is one of the prominent power-generation and consuming markets in the Asia-Pacific region. Fossil fuel-based power generation, particularly natural gas and coal, had a significant share, paving the way for the increased deployment of the power market in the country.
- According to the Ministry of Power statistics, as of October 2023, the total electricity generation was dominated by fossil fuels, which account for more than 56% (~6% from natural gas, 1.6% from lignite, ~0.1% from diesel, and ~49% from coal) of the electricity produced in India, followed by renewable energy, which accounts for about 41.4% (11.2 % from hydro, 10.3 % from wind, 16.1 % from solar, 1.2% from small hydro power and 2.6% other sources). Though the share of renewable power sources is increasing rapidly in the country, fossil fuels-based power sources, especially coal-fired power plants, are likely to dominate the sector in the short term. Such a scenario in the power generation industry is expected to influence the growth of the power market during the forecast period.
- The power sector in India is undergoing a rapid transformation, owing to the increasing population, rising energy demand, and growing industrial sector. Moreover, India's electricity generation mix shifted to natural gas, and renewable energy sources over the past decade.
- The renewable energy sector is governed by the Ministry of New & Renewable Energy (MNRE) which is responsible for creating and enforcing India's renewable energy laws and regulations, including the Feed-in Tariff system (FIT).
- For instance, as of 2022, the Ministry of New and Renewable Energy (MNRE) provides Central Financial Assistance (CFA) of up to INR 2.5 million per solar park for the preparation of Detailed Project Report (DPR). Besides this, CFA of up to INR 2 million per MW or 30% of the project cost, including grid-connectivity cost, whichever is lower, is also provided. Additionally, the CFA of INR 2 million/MW is apportioned on 60:40 basis towards development of internal infrastructure of solar park to the SPPD and for development of external transmission system to Central Transmission Utility (CTU)/ State Transmission Utility (STU) respectively.
- India is also one of the largest renewable energy markets in Asia-Pacific. India's renewable energy installed capacity reached more than 132 GW as of November 2023, excluding hydropower. Solar, wind, and bioenergy are the major renewable energy sources in the country. As of November 2023, renewable energy sources, including hydropower, accounted for approximately 41.4% of the total electricity generation mix.
- Therefore, with the above cited points, India is expected to have a significant share in the market due to its large electricity consumption and massive investment in power projects.
APAC Power Industry Overview
The Asia-Pacific power market is fragmented. Some of the key players in the market (in no particular order) incluge Power Construction Corporation of China, NTPC Limited, Tokyo Electric Power Company Holdings, State Grid Corporation of China, and Korea Electric Power Corporation., among others
Additional Benefits:
- The market estimate (ME) sheet in Excel format
- 3 months of analyst support
TABLE OF CONTENTS
1 INTRODUCTION
- 1.1 Scope of the Study
- 1.2 Market Definition
- 1.3 Study Assumptions
2 RESEARCH METHODOLOGY
3 EXECUTIVE SUMMARY
4 MARKET OVERVIEW
- 4.1 Introduction
- 4.2 Installed Capacity and Demand Forecast in TW, till 2028
- 4.3 Recent Trends and Developments
- 4.4 Government Policies and Regulations
- 4.5 Market Dynamics
- 4.5.1 Drivers
- 4.5.1.1 Exponentially Increasing Electricity Demand
- 4.5.1.2 Adoption of Renewable Energy
- 4.5.2 Restraints
- 4.5.2.1 Huge Investments for Setting Up Renewable Energy Infrastructure
- 4.5.1 Drivers
- 4.6 Supply Chain Analysis
- 4.7 Porter's Five Forces Analysis
- 4.7.1 Bargaining Power of Suppliers
- 4.7.2 Bargaining Power of Consumers
- 4.7.3 Threat of New Entrants
- 4.7.4 Threat of Substitutes Products and Services
- 4.7.5 Intensity of Competitive Rivalry
5 MARKET SEGEMENTATION
- 5.1 Power Generation Source
- 5.1.1 Thermal
- 5.1.2 Hydro
- 5.1.3 Renewables
- 5.1.4 Others
- 5.2 Power Transmission and Distribution (T&D)
- 5.3 Geography
- 5.3.1 China
- 5.3.2 India
- 5.3.3 Japan
- 5.3.4 South Korea
- 5.3.5 Rest of Asia-Pacific
6 COMPETITIVE LANDSCAPE
- 6.1 Mergers, Acquisitions, Collaboration and Joint Ventures
- 6.2 Strategies Adopted by Key Players
- 6.3 Key Companies Profile
- 6.3.1 Power Construction Corporation of China
- 6.3.2 National Thermal Power Corporation Limited
- 6.3.3 Tokyo Electric Power Company Holdings
- 6.3.4 State Grid Corporation of China
- 6.3.5 Korea Electric Power Corporation
- 6.3.6 China Huaneng Group Co., Ltd.
- 6.3.7 China Huadian Corporation Ltd.
- 6.3.8 Tata Power Company Ltd
- 6.3.9 Kansai Electric Power Co., Inc.
- 6.3.10 Chubu Electric Power Co., Inc.
7 MARKET OPPORTUNITIES and FUTURE TRENDS
- 7.1 Development of Smart Grid Network