|
시장보고서
상품코드
1631566
북미의 자동 수요 반응 관리 시스템 : 시장 점유율 분석, 산업 동향 및 통계, 성장 예측(2025-2030년)North America Automated Demand Response Management System - Market Share Analysis, Industry Trends & Statistics, Growth Forecasts (2025 - 2030) |
||||||
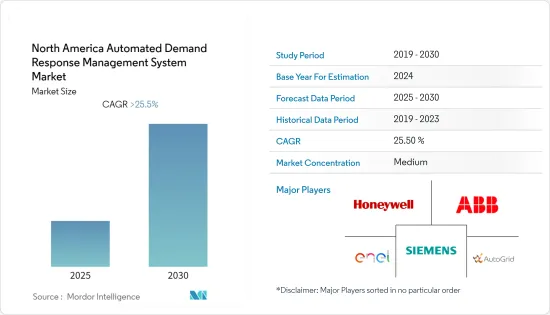
북미의 자동 수요 반응 관리 시스템 시장은 예측 기간 동안 25.5% 이상의 CAGR을 기록할 것으로 예상됩니다.
COVID-19는 시장에 부정적인 영향을 미쳤지만, 현재 시장은 전염병 이전 수준으로 회복되고 있습니다.
주요 하이라이트
- 에너지 관리 시스템이 잘 작동해야 할 필요성 등이 시장을 견인할 것으로 예상됩니다. 또한, 재생에너지의 보급 확대도 예측 기간 동안 시장을 견인할 것으로 예상됩니다.
- 그러나 개인정보 보호에 대한 우려와 일부 산업에서 필요한 시기에 수요 감소에 대응할 수 없다는 점이 시장 억제요인으로 작용할 것으로 보입니다.
- 통합 수요측 관리(IDSM)는 조사 대상 시장에 큰 기회를 제공할 것으로 예상됩니다. 여러 수요측 자원을 긴밀하게 조정하는 IDSM의 활용은 건물 에너지 관리에 대한 보다 진보적이고 스마트한 접근 방식을 제공하여 고객이 비용 효율적인 절감 및 제어 기회를 최대한 활용할 수 있도록 돕습니다.
- 미국은 재생에너지 발전에 대한 수요 증가와 효율적인 발전 믹스 관리 방식으로 인해 지역 전체에서 시장을 독식할 것으로 예상됩니다.
북미의 자동 수요 반응 관리 시스템 시장 동향
신재생에너지의 보급이 시장 주도
- 재생에너지 전원은 간헐적이고 시간에 따라 변동이 심합니다. 예를 들어, 태양광과 풍력발전은 날씨에 크게 영향을 받습니다.
- 수요 반응 관리 시스템의 도입은 이러한 혼란이 발생했을 때 수요를 확실히 줄이고 수요와 공급의 균형을 맞추는 데 도움이 될 수 있습니다. 수요가 많은 시간대에 공급을 전환하는 것을 목표로 하는 에너지 저장과 달리 DRMS는 수요와 공급의 격차가 확대될 때 수요를 전환하는 것을 목표로 하기 때문에 양측의 문제를 모두 해결할 수 있습니다.
- 지열, 태양열, 풍력, 바이오매스 또는 매립지에서 발생하는 가스를 이용한 자가 발전과 결합된 수요 반응 제어는 계통으로부터의 에너지 사용을 줄이면서 시설의 운영을 유지하는 데 필요한 오프그리드 전력을 공급합니다. 수요 반응은 변동성이 큰 재생에너지 발전을 통합하는 데 도움을 줄 수 있는 대량 전력 계통 서비스의 중요한 공급원이 될 수 있습니다.
- 이와는 별도로, 일부 전력회사는 소비자에게 소비뿐만 아니라 전력망에 판매할 수 있는 전력 가격을 제시함으로써 수요 반응 시스템의 범위를 확장하고 있습니다. 예를 들어, 피크 시간대에 소비자는 계통에 전력을 판매하여 더 높은 가격을 받을 수 있습니다. 수요 반응 시스템의 범위가 확대됨에 따라 전력회사 규모뿐만 아니라 소규모 주택용 재생에너지도 발전 시스템에 통합될 것으로 예상됩니다.
- 또한, 정부 지원, 에너지 안보, 비용 감소로 인해 재생에너지 부문은 예측 기간 동안 북미 수요 반응 관리 시스템 시장을 주도할 것으로 예상됩니다.
시장을 주도하는 미국
- 수요 반응 프로그램은 일반적으로 지정된 시간대에 에너지 사용을 줄이거나 전력 회사가 필요할 때 에어컨 시스템을 순환시켜 고객에게 리베이트 또는 에너지 비용 절감을 명시하고 있습니다.
- Advanced Meter는 미국 전역에 배치된 미터 중 가장 널리 보급된 유형으로, 미국 내 설치 및 운영 중인 전체 미터의 50% 이상을 차지합니다. 또한, 미국의 수요 반응 프로그램에 등록된 총 고객 수는 약 1,020만 명(주거, 상업, 산업, 운송 포함)에 달해 2013년 대비 6.1% 증가했습니다. 2020년 수요 반응 프로그램에 등록된 전체 고객 중 주거용 고객이 93% 이상을 차지했으며, 나머지 점유율은 산업 및 운송 고객이 차지했습니다.
- 2022년 5월, NJR Clean Energy Ventures(CEV)는 뉴저지 주 밀번(Millburn)에 8.9MW 규모의 부유식 태양광발전소 건설을 시작했습니다. 이 프로젝트는 부유식 랙킹 시스템을 사용하며, 16,510개의 태양광 패널이 뉴저지 아메리칸 워터의 카누 브룩(Canoe Brook) 정수장에 있는 저수지에 설치될 것으로 보입니다.
- 수요 반응(DR)은 미국에서 수년 동안 존재해 왔으며, DR 시스템은 신뢰할 수 있고, 빠르고, 비용 효율적이며, 자동화 된 방식으로 소비자가 불필요한 전력을 일시적으로 끄거나 낮추거나 전환 할 수 있도록 허용하고 장려합니다.
- 또한 2021년 미국 전력회사의 첨단(스마트) 계량 인프라(AMI) 설치 건수는 약 1억 1,100만 건으로 전년 대비 약 10% 증가했으며, AMI 설치의 약 88%는 주택용입니다. 전국 11개 이상의 주에서 채택한 스마트 미터 설치 계획과 요구사항이 효과를 발휘하여 미터 보급률이 크게 증가한 것으로 보입니다.
- 이와 같이 스마트/AMI 계량기 설치 증가 추세는 스마트 그리드 인프라를 촉진하여 향후 몇 년 동안 ADRMS에 대한 수요를 증가시킬 것으로 예상됩니다.
북미의 자동 수요 반응 관리 시스템 산업 개요
북미의 수요 반응 관리 시스템 시장은 상당히 세분화되어 있습니다. 주요 진입 기업으로는 ABB Ltd, Siemens AG, Honeywell International Inc., Enel SpA, AutoGrid Systems Inc. 등이 있습니다.
기타 혜택
- 엑셀 형식의 시장 예측(ME) 시트
- 3개월간의 애널리스트 지원
목차
제1장 소개
- 조사 범위
- 시장 정의
- 조사 가정
제2장 주요 요약
제3장 조사 방법
제4장 시장 개요
- 소개
- 2028년까지 시장 규모와 수요 예측(단위 : 100만 달러)
- 최근 동향과 개발
- 정부 규제와 시책
- 시장 역학
- 성장 촉진요인
- 성장 억제요인
- 공급망 분석
- 산업의 매력 - Porter's Five Forces 분석
- 공급 기업의 교섭력
- 소비자의 협상력
- 신규 참여업체의 위협
- 대체품의 위협
- 경쟁 기업 간의 경쟁 관계
제5장 지역별 시장 세분화
- 미국
- 캐나다
- 기타 북미
제6장 경쟁 구도
- M&A, 합작투자, 제휴, 협정
- 주요 기업의 전략
- 기업 개요
- ABB Ltd.
- Siemens AG
- Honeywell International Inc.
- Enel SpA
- AutoGrid Systems Inc.
- General Electric Company
- Centrica PLC
- Itron Inc.
- Lockheed Martin Corporation
제7장 시장 기회와 향후 동향
ksm 25.01.23The North America Automated Demand Response Management System Market is expected to register a CAGR of greater than 25.5% during the forecast period.

COVID-19 had a detrimental effect on the market.However, the market has currently rebounded to pre-pandemic levels.
Key Highlights
- The market is likely to be driven by things like the need for an energy management system that works well.Also, increased penetration of renewable energy is expected to drive the market during the forecast period.
- However, the privacy concern and the inability of some industries to comply with the reduction in demand at the need of the hour are likely to act as restraints for the market.
- Integrated demand-side management (IDSM) is expected to provide a great opportunity for the studied market. The use of IDSM, closely coordinating multiple demand-side resources, offers a more forward-thinking and smarter approach to building energy management and helps customers maximize cost-effective savings and control opportunities.
- The United States is expected to dominate the market across the region due to the growing demand for renewable energy and efficient ways to manage the electricity generation mix.
North America Automated Demand Response Management System Market Trends
Increased Penetration of Renewable Energy to Drive the Market
- Renewable energy power sources are intermittent, and they fluctuate over time. For instance, solar power and wind power plants are heavily dependent on weather conditions.
- Implementation of demand response management system can help by ensuring that when such disruptions happen, demand can be reduced, in order to meet the supply demand balance. In contrast to energy storage, which aims to reallocate supply to times of greater demand, DRMS aims to reallocate demand to times of increased supply-demand gap, hence, addressing the problems on the both sides.
- Demand response controls coupled with on-site generation using geothermal, solar, wind, biomass, or landfill-gas-to-energy provide the off-grid power needed to keep facilities running, while reducing energy use from the grid. Demand response present potentially important sources of bulk power system services that can aid in integrating variable renewable generation.
- Apart from that, some utility companies have expanded the scope of demand-response system, by proving the dynamic electricity prices for their consumers for not only consumption but also for selling electricity back to the grid. For example, during peak hours, the consumers can get higher prices for selling the electricity back to the grid system. The enhanced scope of the demand-response system is expected to help integrating not only the utility-scale but also small, residential renewable sources in the power generation system.
- Moreover, with government assistance, energy security, and declining costs, the renewable energy sector is expected to register significant growth, in turn driving the North America demand response management systems market during the forecast period.
United States To Drive the Market
- Demand response programs typically offer customers a rebate or lower energy costs for reducing energy use during specified hours or allowing the utility to cycle their air-conditioning systems when needed.
- Advanced meters are the most prevalent type of metering deployed throughout the United States, accounting for more than 50% of all meters installed and operational in the country. Adding to this, the total number of customers enrolled under the demand response programs in the United States reached around 10.2 million (including residential, commercial, industrial, and transportation), representing an increase of 6.1% from 2013's value. Of all the customers enrolled in the demand response program, residential customers accounted for more than 93% in 2020 and the remaining share was distributed among the industrial and transportation customers.
- In May 2022, NJR Clean Energy Ventures (CEV) started construction on an 8.9-MW floating solar installation in Millburn, New Jersey, which is expected to be the largest floating array in the United States. The project uses a floating racking system, with 16,510 solar panels that are likely to be installed on a reservoir located at the New Jersey American Water Canoe Brook Water Treatment Plant.
- Demand Response (DR) has been in existence in the United States for many years. DR system allows and encourages consumers to temporarily switch off, turn down or shift the nonessential electricity in a reliable, fast, cost-effective, and automated fashion.
- Moreover, in 2021, electric utilities in the United States had about 111 million advanced (smart) metering infrastructure (AMI) installations, representing an increase of around 10% over the previous year's value. About 88% of the AMI installations were residential customer installations. Plans and requirements for the installation of smart meters adopted in more than 11 states across the country appear to be paying off significant increases in meter penetration rates.
- This, increasing trend in the smart/ AMI meter installations in the country is expected to boost the smart grid infrastructure, thereby, increasing the demand for ADRMS in the coming years.
North America Automated Demand Response Management System Industry Overview
The North America demand response management system market is moderately fragmented. Some of the key players (in no particular order) are ABB Ltd, Siemens AG, Honeywell International Inc., Enel SpA, AutoGrid Systems Inc., etc.
Additional Benefits:
- The market estimate (ME) sheet in Excel format
- 3 months of analyst support
TABLE OF CONTENTS
1 INTRODUCTION
- 1.1 Scope of the Study
- 1.2 Market Definition
- 1.3 Study Assumptions
2 EXECUTIVE SUMMARY
3 RESEARCH METHODOLOGY
4 MARKET OVERVIEW
- 4.1 Introduction
- 4.2 Market Size and Demand Forecast in USD million, till 2028
- 4.3 Recent Trends and Developments
- 4.4 Government Policies and Regulations
- 4.5 Market Dynamics
- 4.5.1 Drivers
- 4.5.2 Restraints
- 4.6 Supply Chain Analysis
- 4.7 Industry Attractiveness - Porter's Five Forces Analysis
- 4.7.1 Bargaining Power of Suppliers
- 4.7.2 Bargaining Power of Consumers
- 4.7.3 Threat of New Entrants
- 4.7.4 Threat of Substitutes
- 4.7.5 Intensity of Competitive Rivalry
5 MARKET SEGMENTATION BY GEOGRAPHY
- 5.1 United States
- 5.2 Canada
- 5.3 Rest of North America
6 COMPETITIVE LANDSCAPE
- 6.1 Mergers and Acquisitions, Joint Ventures, Collaborations, and Agreements
- 6.2 Strategies Adopted by Leading Players
- 6.3 Company Profiles
- 6.3.1 ABB Ltd.
- 6.3.2 Siemens AG
- 6.3.3 Honeywell International Inc.
- 6.3.4 Enel SpA
- 6.3.5 AutoGrid Systems Inc.
- 6.3.6 General Electric Company
- 6.3.7 Centrica PLC
- 6.3.8 Itron Inc.
- 6.3.9 Lockheed Martin Corporation