


|
시장보고서
상품코드
1636209
북미의 도시 고형 폐기물 관리 - 시장 점유율 분석, 산업 동향 및 통계, 성장 예측(2025-2030년)North America Municipal Solid Waste Management - Market Share Analysis, Industry Trends & Statistics, Growth Forecasts (2025 - 2030) |
||||||
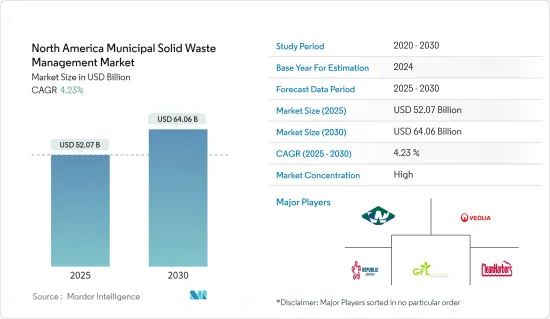
북미의 도시 고형 폐기물 관리 시장 규모는 2025년에 520억 7,000만 달러로 추정 및 예측되며, 예측 기간(2025-2030년) 동안 4.23%의 CAGR로 2030년에는 640억 6,000만 달러에 달할 것으로 예상됩니다.
북미 도시 고형 폐기물(MSW) 관리 시장은 환경 서비스 산업에서 매우 중요한 시장입니다. 이 시장에는 주거, 상업 및 산업 시설에서 발생하는 고형 폐기물의 수집, 운송, 처리, 재활용 및 처분이 포함됩니다. 북미, 특히 미국과 캐나다는 MSW 관리 시장에 크게 기여하고 있습니다. 폐기물 발생량 증가와 선진 폐기물 관리 방법의 채택을 고려할 때, 시장은 향후 몇 년 동안 안정적인 성장세를 보일 것으로 예상됩니다.
미국에서의 도시 고형 폐기물(MSW) 관리는 대체로 만족스러운 수준입니다. 민간단체가 주로 MSW의 운송과 처리를 담당하고 있으며, 충분한 자금이 확보되어 있습니다. 미국에서는 연간 약 2억 5,800만 톤의 MSW가 배출되고 있습니다. 이 중 약 53%는 매립지로 운반되며, 이 수치는 안정적으로 유지되고 있습니다. 현재 MSW의 34.6%는 재활용되고 12.8%는 에너지 생산을 위해 소각되고 있습니다.
미국의 자원 보존 및 회수법(RCRA)과 같은 연방, 주, 지방 차원의 엄격한 환경 규제는 적절한 폐기물 관리의 중요성을 강조하고 있습니다. 지방화와 인구 증가는 폐기물 발생량 증가와 직결되어 있으며, 확장 가능한 폐기물 관리 솔루션이 요구되고 있습니다.
국민들의 의식과 정부의 노력은 재활용, 폐기물 감소, 폐기물 에너지화 추진을 촉진하고 있습니다. 자동 분류 및 IoT 기반 폐기물 수거와 같은 기술 혁신은 폐기물 관리 프로세스의 효율성을 높이고 있습니다. 또한, 경제 발전과 소득 수준 증가에 따라 소비량과 그에 따른 폐기물 발생량도 증가하여 첨단 폐기물 관리 서비스에 대한 수요가 더욱 증가하고 있습니다.
북미의 도시 고형 폐기물 관리 시장 동향
도시 고형 폐기물 성장의 주요 원동력은 음식물쓰레기 증가입니다.
매년 미국인들은 수십억 파운드의 음식물 쓰레기를 발생시켜 환경과 경제에 큰 영향을 미치고 있습니다. 평균적으로 미국인들은 연간 400파운드(181kg) 이상의 식품을 폐기하고 있으며, 이는 미국 전체 식품 공급량의 30-40%에 해당합니다. 이러한 우려스러운 추세에는 식품 공급망의 지속 불가능한 관행, 소매업체와 소비자가 설정한 까다로운 미적 기준, 종종 무지한 소비자 행동 등 여러 가지 요인이 있습니다.
온실 가스 배출량 증가, 수자원 낭비, 경제 침체 등 음식물 쓰레기의 영향은 광범위하게 퍼져 있습니다. 그러나 잉여 식품을 푸드뱅크나 교회 등의 단체에 기부하는 등의 노력으로 음식물 쓰레기와 싸우고 국내 식량 불안에 대처하고 있습니다. 또한, 가정에서의 퇴비화도 중요한 전략으로 떠오르고 있으며, 식품을 매립지에서 전환하고 온실 가스 배출을 억제하고 있습니다.
미국인들은 연간 1,080억 파운드(약 490억 kg)에 달하는 엄청난 양의 식품을 낭비하고 있으며, 그 양은 꾸준히 증가하고 있습니다. 이러한 폐기물은 지속 불가능한 식품 생산 및 운송 방식, 과일과 채소에 대한 완벽한 미적 감각에 대한 집착, 무수히 많은 소비 습관에 기인합니다. 이러한 음식물 쓰레기의 만연이 가져오는 결과는 비참하며, 이산화탄소와 메탄의 대량 배출, 수자원의 오염과 고갈, 막대한 경제적 손실로 이어집니다. 그러나 잉여 식품을 재분배하고 가정 내 퇴비화를 촉진함으로써 미국은 연간 음식물 쓰레기를 크게 줄일 수 있습니다.
미국의 음식물 쓰레기는 매립지의 주요 폐기물이라는 불명예스러운 지위를 가지고 있으며, 전체 지자체 고형 폐기물의 24.1%를 차지합니다. 미국인들은 과일과 채소의 46%, 해산물의 35%, 육류의 21%, 유제품의 17%를 버립니다. 미국에서는 매년 식량 공급의 30%에서 40%가 버려지고 있습니다.
미국의 내 음식물 쓰레기의 규모는 환경과 경제에 큰 영향을 미치는 심각한 수준입니다. 식품 재분배, 가정 내 퇴비화 등의 노력을 통해 이 문제를 해결하면 그 영향을 크게 완화하고, 지속가능성을 촉진하며, 식량 불안을 줄일 수 있습니다.
미국 지자체 인구 증가로 미국 지자체 고형 폐기물 관리 시장 성장 촉진
미국의 도시 고형 폐기물 관리 시장은 처분가능소득의 증가에 따른 지자체 인구의 증가에 의해 주도되고 있으며, 이러한 추세는 시장 성장에 큰 영향을 미칠 것으로 보입니다.
미국의 전체에서 대부분의 쓰레기는 매립 또는 소각 처리되고 있습니다. 소각은 쓰레기의 양을 90%, 무게를 75% 줄입니다. 그러나 소각과 매립 모두 환경에 심각한 위협이 되고 있습니다. 따라서 많은 주정부 정책 입안자들은 지속가능한 폐기물 관리를 옹호하고 있으며, 특히 재활용에 중점을 두고 있습니다. 재활용 과정에서 분리된 폐기물은 다양한 유용한 재료로 재가공됩니다.
미국의 도시 고형 폐기물 관리 시장은 눈에 띄게 개선되고 있습니다. 환경 친화적인 폐기물 처리를 촉진하기 위한 엄격한 규제가 시장을 강화하고 있습니다. 각 지역은 현재 재활용 및 퇴비화 AD 산업에 대한 투자를 강화하고 있습니다.
COVID-19 팬데믹은 미국의 폐기물 관리 회사들에게 도전과제를 던져주었습니다. 특히 폐쇄 기간 동안 폐기물 처리의 물류적 복잡성을 고려할 때, 노동력의 연속성과 업무 효율성을 유지하기 위한 지원이 필요했습니다.
플라스틱 사용을 억제하는 규제는 종이와 판지의 소비, 특히 포장 및 신문, 컵, 티슈 페이퍼와 같은 비내구성 제품의 소비에 영향을 미쳤습니다. 반면 우유팩, 봉지, 골판지 상자와 같은 제품은 포장 및 용기에 해당하며 재활용 가능성이 높기 때문에 수요가 급증하고 적용 범위가 확대되고 있습니다.
미국의 환경보호청에 따르면 종이와 판지의 재활용률은 약 65%로 전체 재료 중 가장 높습니다. 또한, 이러한 재료를 소각해도 환경에 미치는 영향이 최소화되어 폐기물 처리에 대한 선호도를 더욱 높이고 있습니다.
미국의 서부, 중남부, 남대서양, 북동부, 태평양 지역이 미국 도시 고형 폐기물 관리 시장 점유율의 65% 이상을 차지하고 있습니다. 이 시장은 첨단 폐기물 처리 기술에 대한 관심이 높아짐에 따라 크게 성장할 것으로 예상됩니다.
미국에서는 자치화, 가처분 소득 증가, 환경 친화적 규제가 미국 내 폐기물 관리 시장의 성장에 박차를 가하고 있습니다. 이 시장은 지속가능한 폐기물 관리 관행에 대한 강조에 힘입어 재활용 및 퇴비화에 대한 투자가 증가하고 있으며, 이는 이 시장의 성장 궤도를 가속화할 것으로 보입니다.
북미의 도시 고형 폐기물 관리 산업 개요
북미의 도시 고형 폐기물 관리 시장은 소수의 주요 진입자들이 큰 영향력을 행사하는 등 상당한 집중도를 보이고 있습니다. 이 시장의 주요 기업으로는 Waste Connection, Veolia, GFL Environmental, Republic Services, Clean Harbors 등이 있습니다.
기타 혜택
- 엑셀 형식의 시장 예측(ME) 시트
- 3개월간 애널리스트 지원
목차
제1장 소개
- 조사 성과
- 조사 가정
- 조사 범위
제2장 조사 방법
제3장 주요 요약
제4장 시장 역학
- 시장 개요
- 시장 성장 촉진요인
- 환경 문제에 대한 인식 확산
- 급속한 자치체화와 인구 증가
- 시장 성장 억제요인
- 높은 초기 투자와 운영 비용
- 시장 기회
- 첨단 폐기물 관리 기술 채용
- 밸류체인/공급망 분석
- Porter's Five Forces 분석
- 신규 참여업체의 위협
- 구매자/소비자의 협상력
- 공급 기업의 교섭력
- 대체품의 위협
- 경쟁 기업 간의 경쟁 강도
- PESTLE 분석
- 시장의 기술 혁신에 관한 인사이트
제5장 시장 세분화
- 폐기물 유형별
- 종이·골판지
- 전자폐기물
- 플라스틱 폐기물
- 금속 폐기물
- 유리 쓰레기
- 기타 폐기물
- 발생원별
- 주택 폐기물
- 상업
- 건설 폐기물
- 기타
- 폐기 방법별
- 매립
- 소각
- 재활용
- 기타 처분 방법
- 국가별
- 미국
- 캐나다
- 멕시코
제6장 경쟁 구도
- 시장 집중 개요
- 기업 개요
- Waste Management
- Republic Services
- Waste Connections
- Casella Waste Systems
- Advanced Disposal Services
- Clean Harbors
- GFL Environmental
- Veolia
- Covanta Holding Corporation
- Stericycle
- Rumpke Waste & Recycling
- EDCO Disposal Corporation
제7장 향후 동향
ksm 25.02.05The North America Municipal Solid Waste Management Market size is estimated at USD 52.07 billion in 2025, and is expected to reach USD 64.06 billion by 2030, at a CAGR of 4.23% during the forecast period (2025-2030).

The North American municipal solid waste (MSW) management market is pivotal in the environmental services industry. It encompasses the collection, transportation, processing, recycling, and disposal of solid waste from residential, commercial, and industrial sources. North America, particularly the United States and Canada, significantly contributes to the MSW management market. Given the rising waste generation and the adoption of advanced waste management practices, the market is poised for steady growth in the coming years.
Managing municipal solid waste (MSW) in the United States is generally satisfactory. Private entities predominantly handle the transportation and disposal of MSW, ensuring adequate funding. Annually, Americans produce around 258 million tons of MSW. Of this, roughly 53% finds its way to landfills, a figure that has stabilized. Presently, 34.6% of MSW is recycled, while 12.8% is incinerated for energy generation.
Stringent environmental regulations at the federal, state, and local levels, such as the US Resource Conservation and Recovery Act (RCRA), underscore the importance of proper waste management. Urbanization and population growth are directly linked to increased waste generation, necessitating scalable waste management solutions.
Public awareness and government initiatives drive the push for recycling, waste reduction, and waste-to-energy practices. Technological innovations, like automated sorting and IoT-based waste collection, are enhancing the efficiency of waste management processes. Also, as economic development and income levels rise, so does consumption and subsequent waste generation, further bolstering the demand for advanced waste management services.
North America Municipal Solid Waste Management Market Trends
The Primary Driver of Growth in Municipal Solid Waste is the Increasing Generation of Food Waste
Every year, Americans generate billions of pounds of food waste, significantly impacting the environment and the economy. On average, an American discards over 400 lbs (181 kg) of food annually, equating to a staggering 30%-40% of the entire US food supply. Several factors contribute to this alarming trend, including unsustainable practices in the food supply chain, stringent aesthetic standards set by retailers and consumers, and often uninformed consumer behavior.
The repercussions of this waste are far-reaching, encompassing heightened greenhouse gas emissions, squandered water resources, and substantial economic setbacks. However, initiatives like redirecting surplus food to entities such as food banks and churches combat food waste and address food insecurity in the nation. Also, household composting emerges as a pivotal strategy, diverting food from landfills and curbing greenhouse gas emissions.
The US food waste scale is staggering, with Americans squandering a colossal 108 billion lbs (49 billion kg) annually, steadily climbing. This waste contributes to unsustainable food production and transportation practices, the insistence on near-perfect aesthetics for fruits and vegetables, and a myriad of consumer habits. The consequences of this rampant food waste are dire, leading to significant carbon dioxide and methane emissions, contamination and depletion of water resources, and substantial economic losses. However, the nation can significantly reduce its annual food waste output by redistributing excess food and encouraging household composting.
Food waste in the United States holds the dubious distinction of being the primary material in landfills, constituting a substantial 24.1% of all municipal solid waste. Americans discard 46% of fruits and vegetables, 35% of seafood, 21% of meat, and 17% of dairy products. The United States discards 30% to 40% of its food supply annually.
The scale of food waste in the United States is alarming, with significant environmental and economic repercussions. Addressing this issue through initiatives like food redistribution and household composting can substantially mitigate its impact, promoting sustainability and reducing food insecurity.
An Expanding Urban Population is Driving Growth in the US Municipal Solid Waste Management Market
The US municipal solid waste management market is driven by a growing urban population with rising disposable incomes, a trend poised to impact market growth significantly.
Across the United States, most trash is either landfilled or incinerated. Incineration reduces waste volume and weight by 90% and 75%, respectively. However, both incineration and landfilling pose notable environmental threats. Consequently, policymakers in many states increasingly advocate for sustainable waste management, strongly focusing on recycling. In the recycling process, segregated waste is reprocessed into various useful materials.
The US municipal waste management market has seen marked improvements. Stringent regulatory mandates aimed at promoting eco-friendly waste disposal have bolstered the market. Regions are now ramping up investments in recycling and composting AD industries.
The COVID-19 pandemic raised challenges for waste management companies in the United States. They needed help maintaining workforce continuity and operational efficiency, especially given the logistical complexities of waste disposal during lockdowns.
Regulations that discourage plastic use have impacted the consumption of paper and paperboard, especially in packaging and non-durable goods like newspapers, cups, and tissue paper. On the other hand, products like milk cartons, bags, and corrugated boxes fall under packaging and containers and are highly recyclable, leading to a surge in demand and application scope.
According to the US Environmental Protection Agency, the recycling rate for paper and paperboard stood at nearly 65%, the highest among all materials. Moreover, incinerating these materials has minimal environmental impact, further fueling their preference for waste management.
The West, South Central, South Atlantic, Northeast, and Pacific States collectively hold over 65% of the US municipal waste management market share. This market is poised for substantial growth, driven by a heightened focus on advanced waste treatment technologies.
Urbanization, rising disposable incomes, and eco-friendly regulations fuel notable US municipal solid waste management market growth. The market is witnessing heightened investments in recycling and composting, underpinned by a robust emphasis on sustainable waste management practices, all set to amplify its growth trajectory.
North America Municipal Solid Waste Management Industry Overview
In North America, the municipal solid waste management market exhibits a notable concentration, with a handful of critical players holding significant sway. Some key players in this market are Waste Connection, Veolia, GFL Environmental, Republic Services, and Clean Harbors.
Additional Benefits:
- The market estimate (ME) sheet in Excel format
- 3 months of analyst support
TABLE OF CONTENTS
1 INTRODUCTION
- 1.1 Study Deliverables
- 1.2 Study Assumptions
- 1.3 Scope of the Study
2 RESEARCH METHODOLOGY
3 EXECUTIVE SUMMARY
4 MARKET DYNAMICS
- 4.1 Market Overview
- 4.2 Market Drivers
- 4.2.1 Heightened Public Awareness of Environmental Concerns
- 4.2.2 Rapid Urbanization and Growing Population
- 4.3 Market Restraints
- 4.3.1 High Initial Investment and Operational Costs
- 4.4 Market Opportunities
- 4.4.1 Adoption of Advanced Waste Management Technologies
- 4.5 Value Chain / Supply Chain Analysis
- 4.6 Porter's Five Force Analysis
- 4.6.1 Threat of New Entrants
- 4.6.2 Bargaining Power of Buyers/Consumers
- 4.6.3 Bargaining Power of Suppliers
- 4.6.4 Threat of Substitute Products
- 4.6.5 Intensity of Competitive Rivalry
- 4.7 PESTLE Analysis
- 4.8 Insights on technology Innovation in the Market
5 MARKET SEGMENTATION
- 5.1 By Waste Type
- 5.1.1 Paper and Cardboard
- 5.1.2 E-waste
- 5.1.3 Plastic Waste
- 5.1.4 Metal Waste
- 5.1.5 Glass Waste
- 5.1.6 Other Waste Types
- 5.2 By Source
- 5.2.1 Residential
- 5.2.2 Commercial
- 5.2.3 Construction
- 5.2.4 Other Sources
- 5.3 By Disposal Methods
- 5.3.1 Landfill
- 5.3.2 Incineration
- 5.3.3 Recycling
- 5.3.4 Other Disposal Methods
- 5.4 By Country
- 5.4.1 United States
- 5.4.2 Canada
- 5.4.3 Mexico
6 COMPETITIVE LANDSCAPE
- 6.1 Market Concetration Overview
- 6.2 Company Profiles
- 6.2.1 Waste Management
- 6.2.2 Republic Services
- 6.2.3 Waste Connections
- 6.2.4 Casella Waste Systems
- 6.2.5 Advanced Disposal Services
- 6.2.6 Clean Harbors
- 6.2.7 GFL Environmental
- 6.2.8 Veolia
- 6.2.9 Covanta Holding Corporation
- 6.2.10 Stericycle
- 6.2.11 Rumpke Waste & Recycling
- 6.2.12 EDCO Disposal Corporation
